
@stellensatz @Ashutos61 @Sandeep_1966 @shekhar_mande This pandemic has a way of embarrassing those making predictions😀. We are indeed in the midst of second wave now. Of course, this wave is being driven primarily by Maharashtra. 1/n
https://twitter.com/agrawalmanindra/status/1369005212875157505
We had to wait for a couple of weeks for the new trajectory to stabilize. Here is what we found: the spike observed in many states is primarily due to a significant increase in contact rate (parameter beta). This parameter determines how fast the pandemic is spreading. 2/n
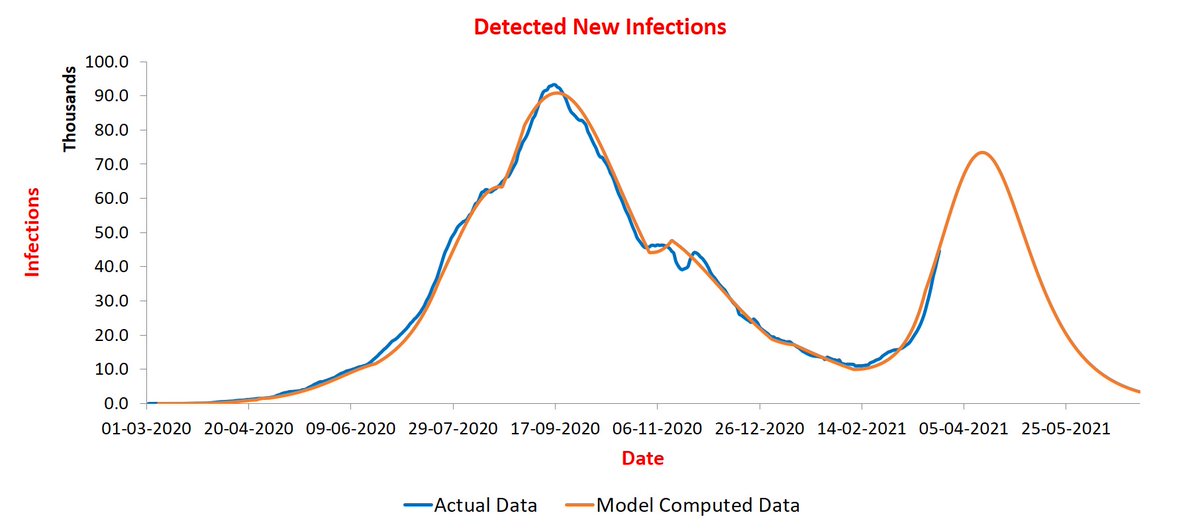
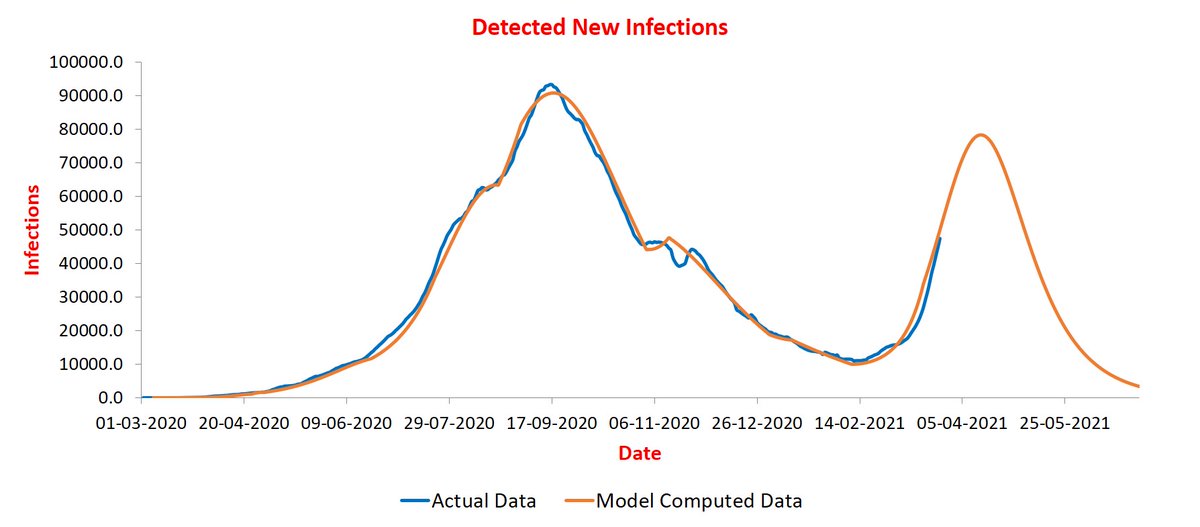
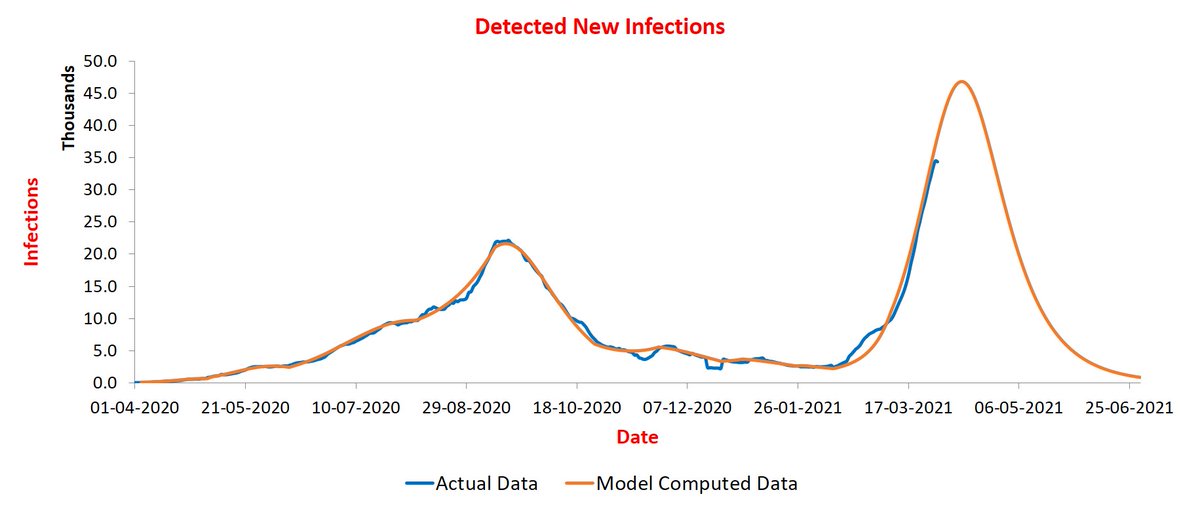
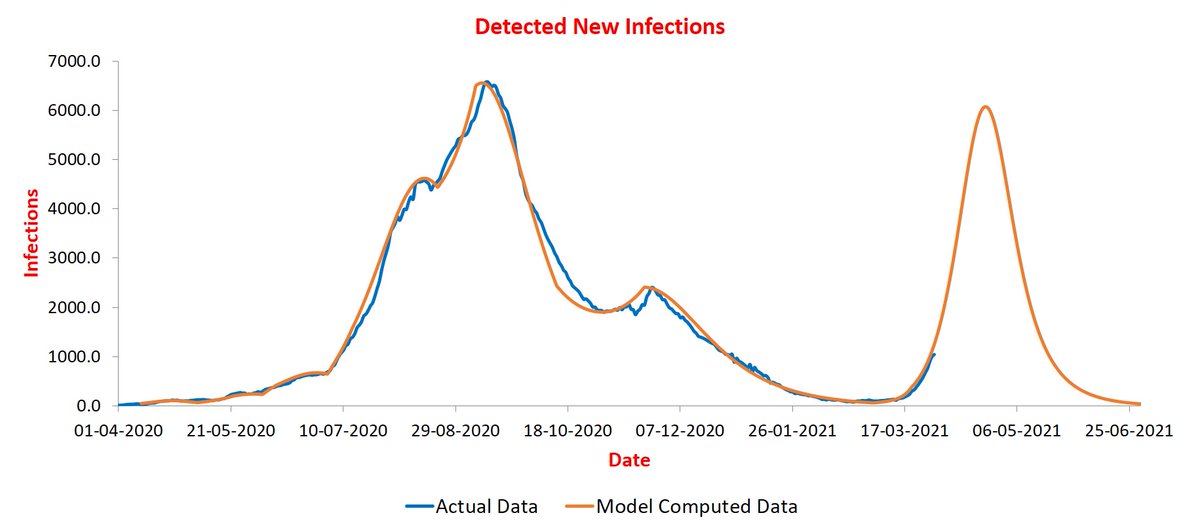
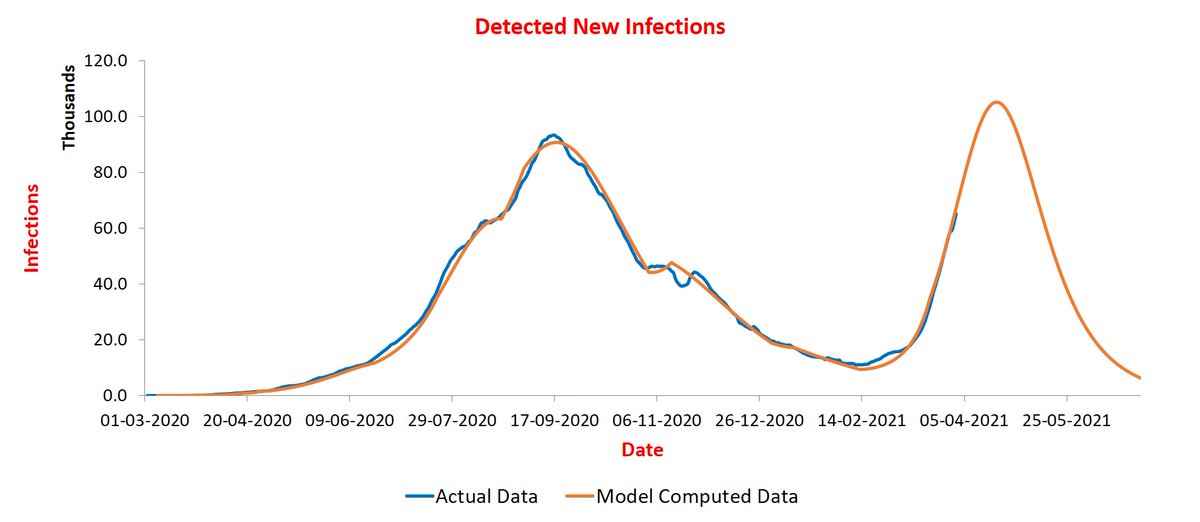
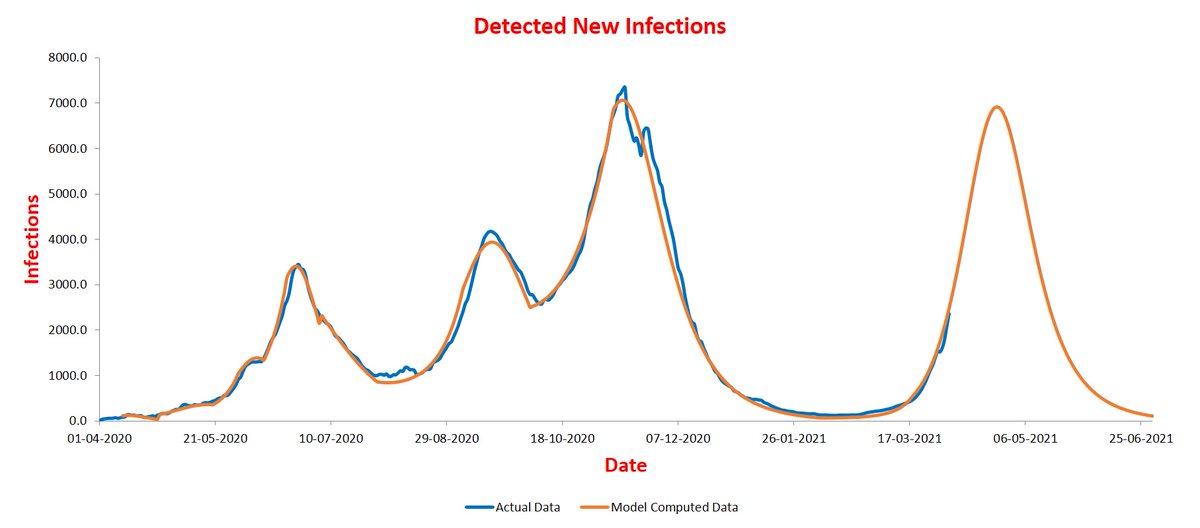
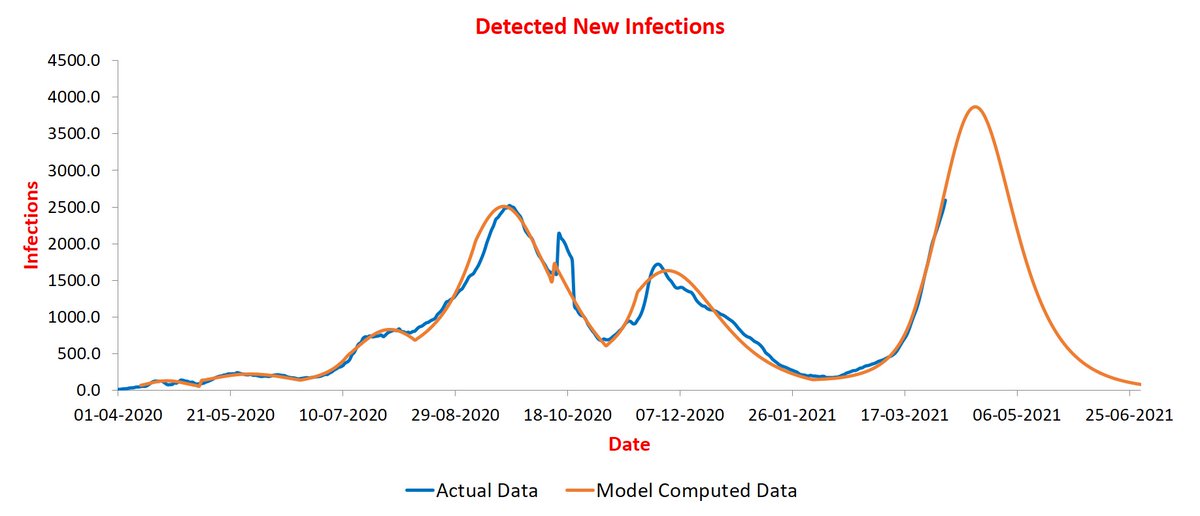
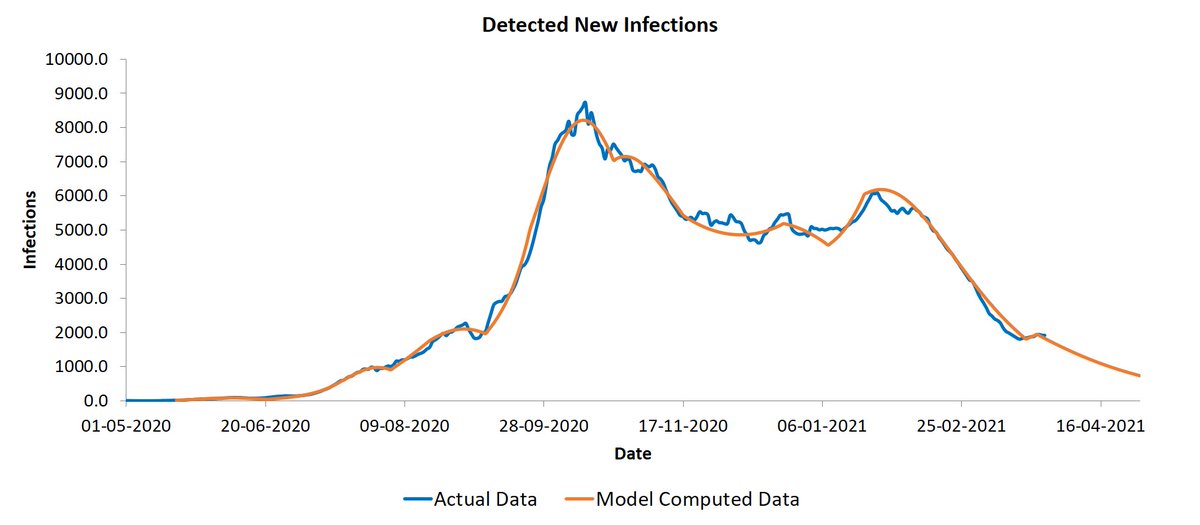
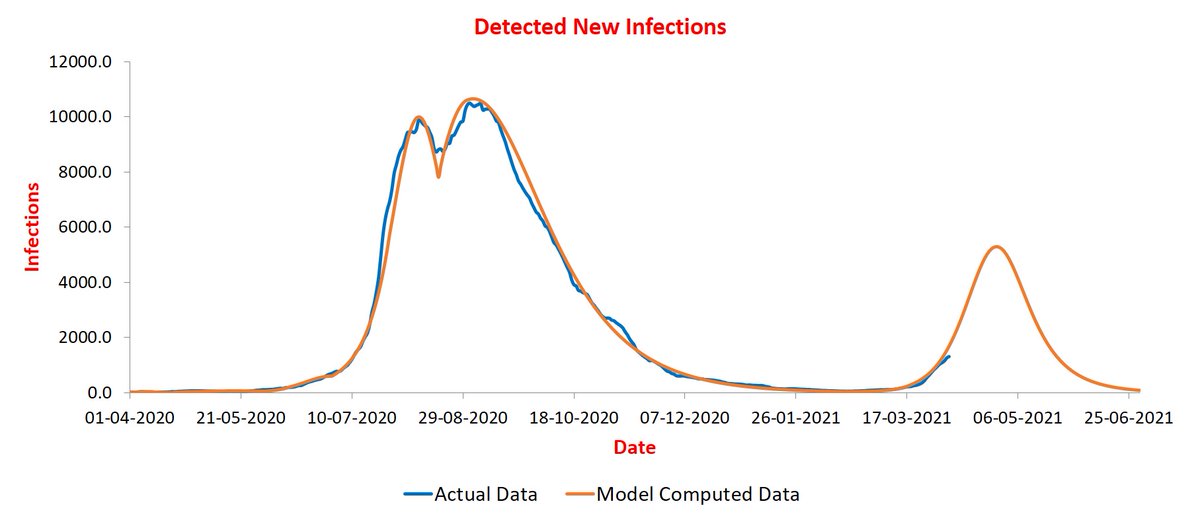
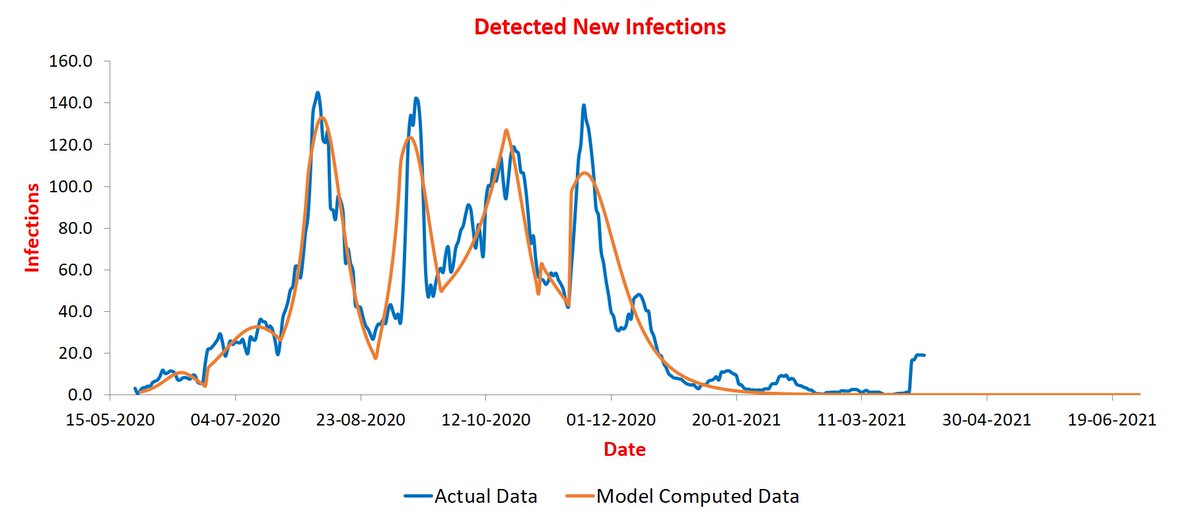
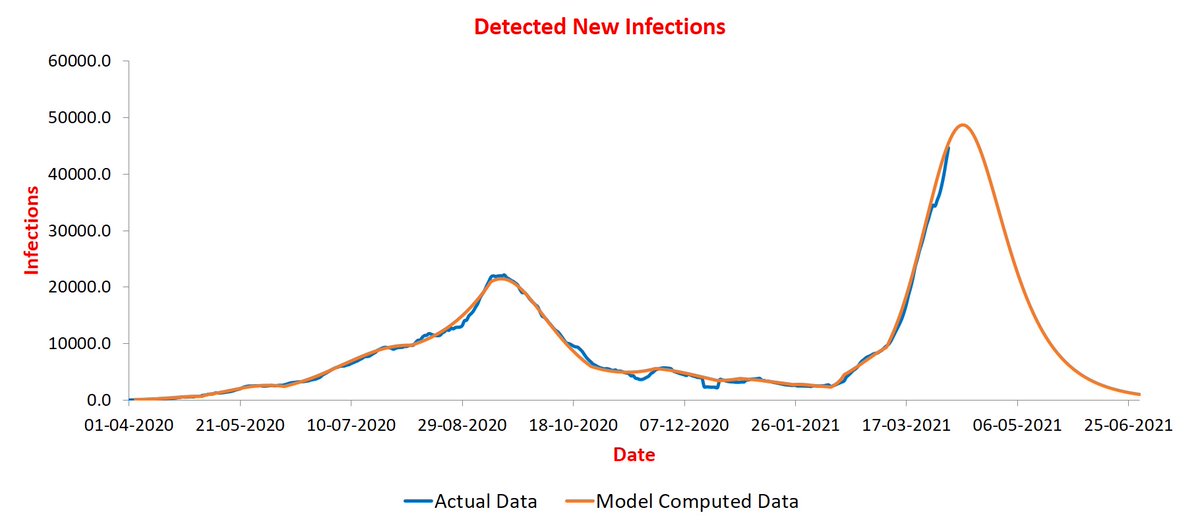
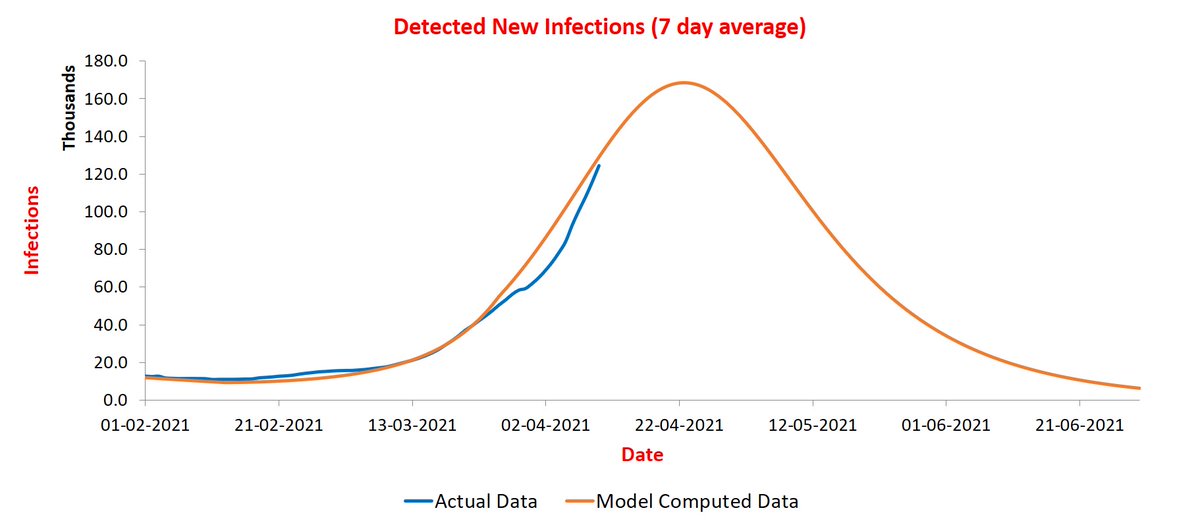
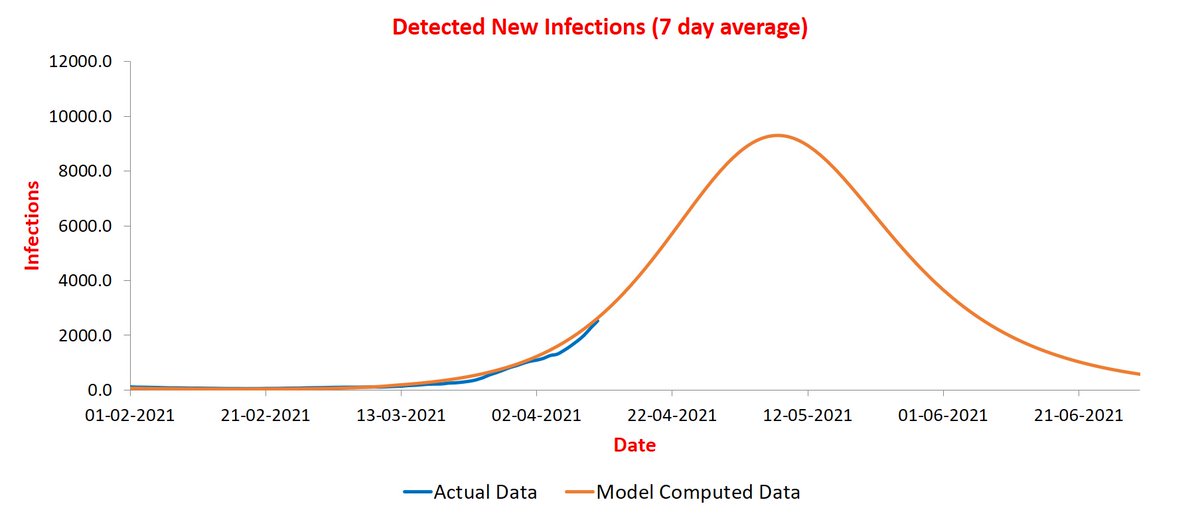
Consider India. Contact rate has doubled in March (0.24 to 0.48). This results in plot below. The peak is expected to arrive in mid-April at between 70-80K new infections per day. 3/n 
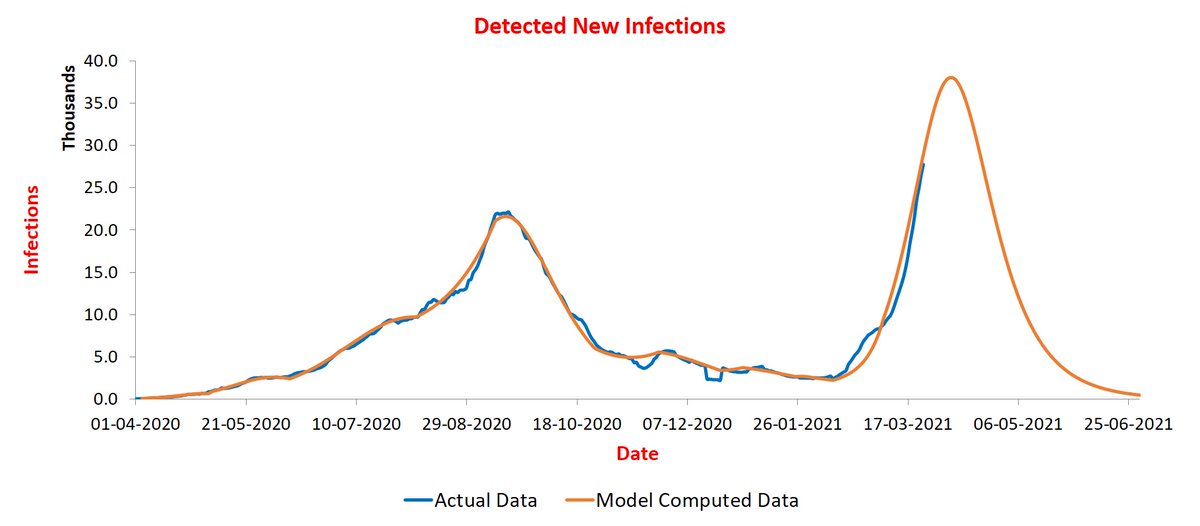
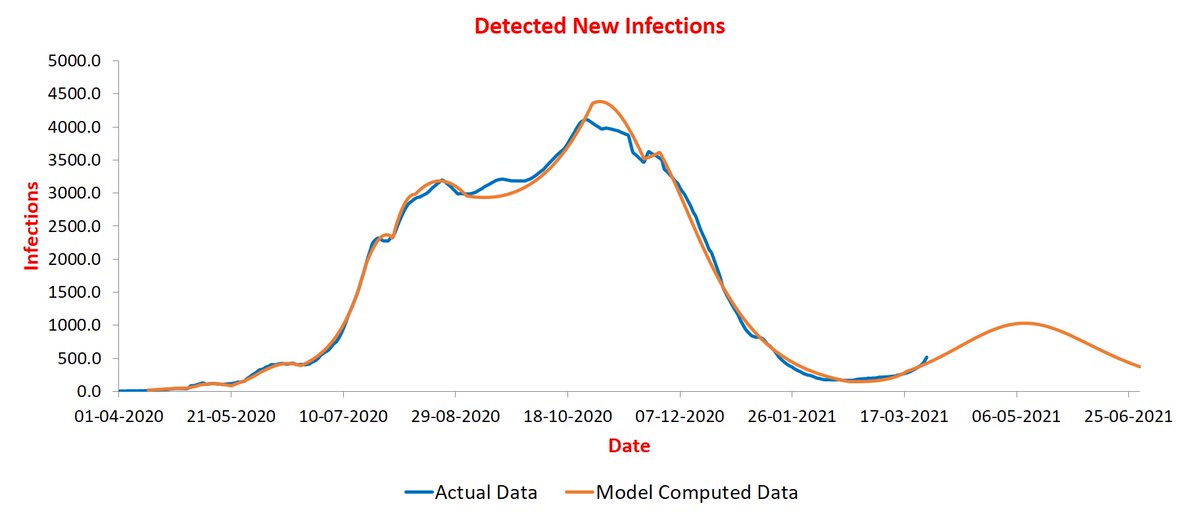
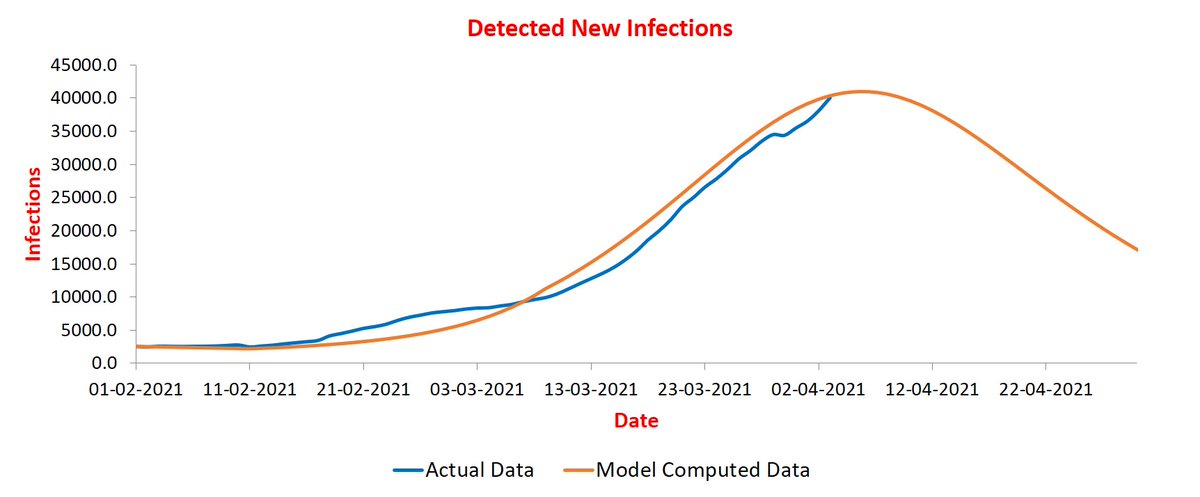
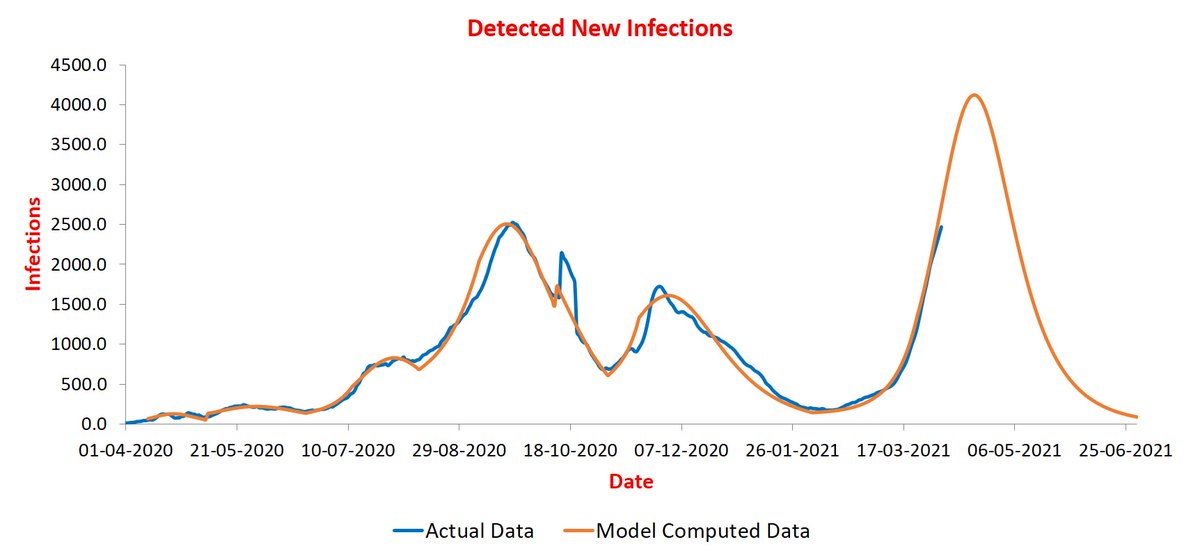
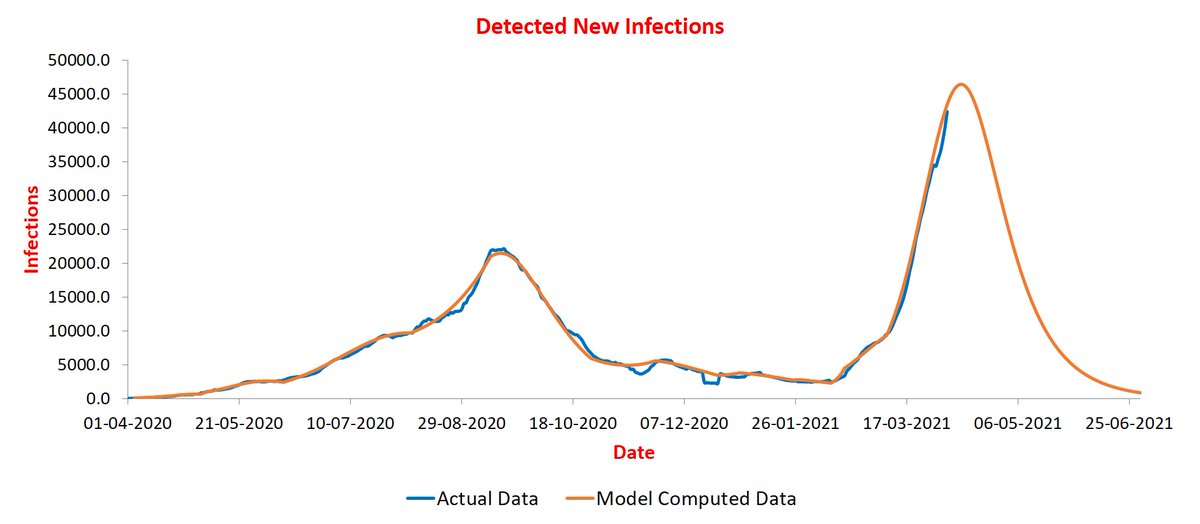
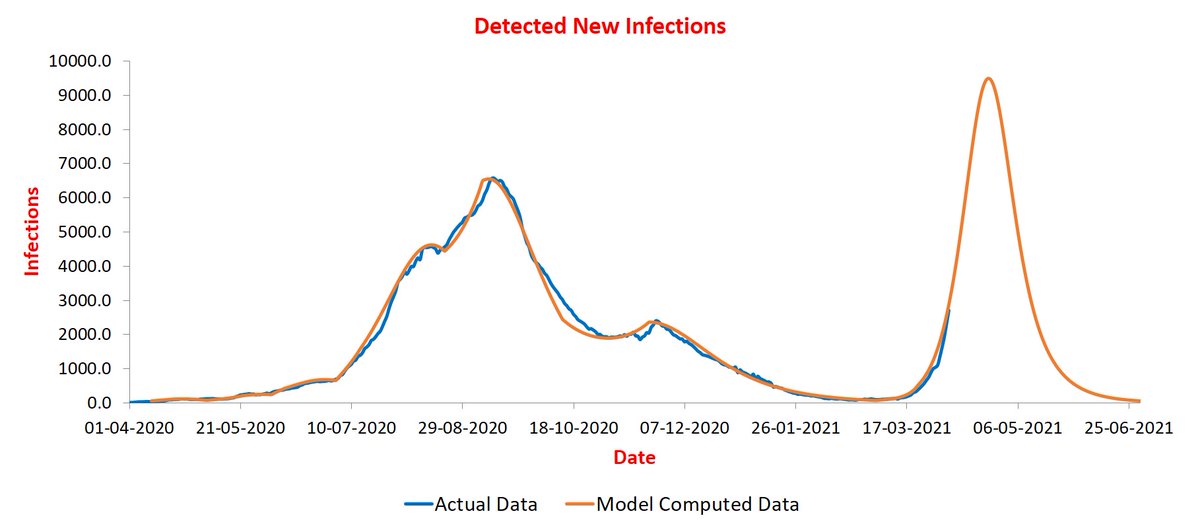
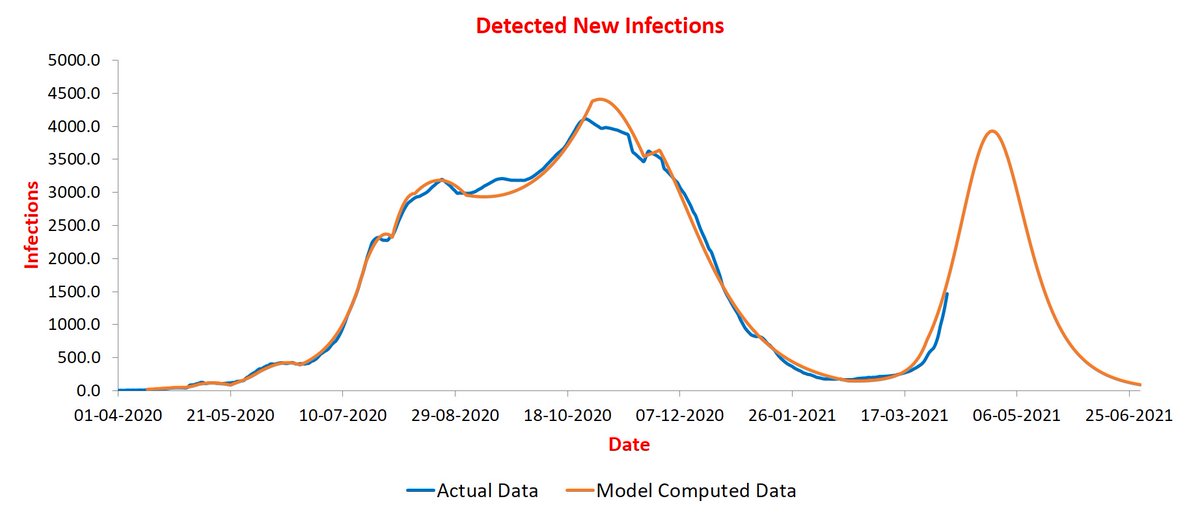
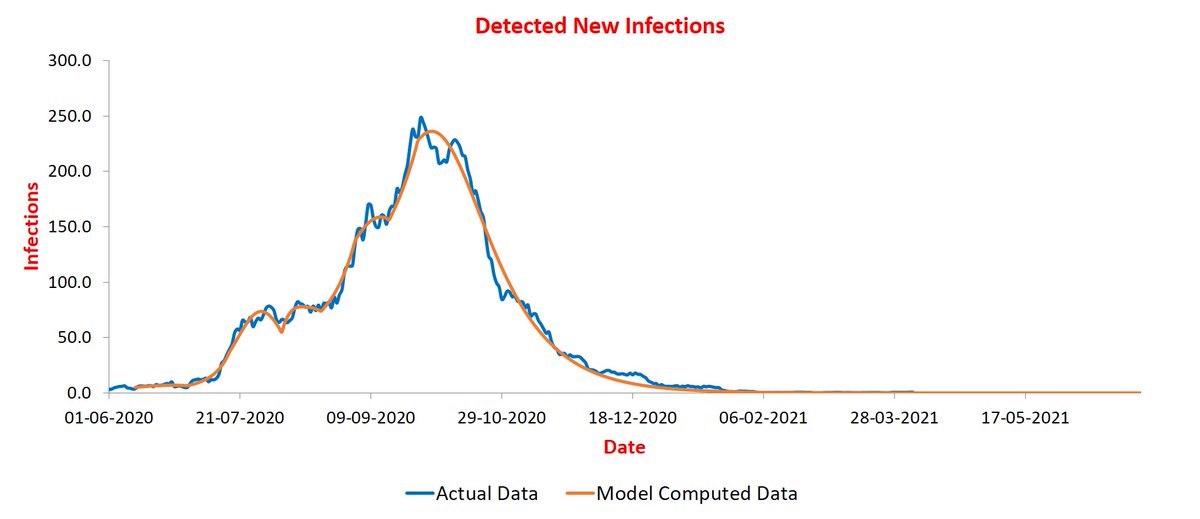
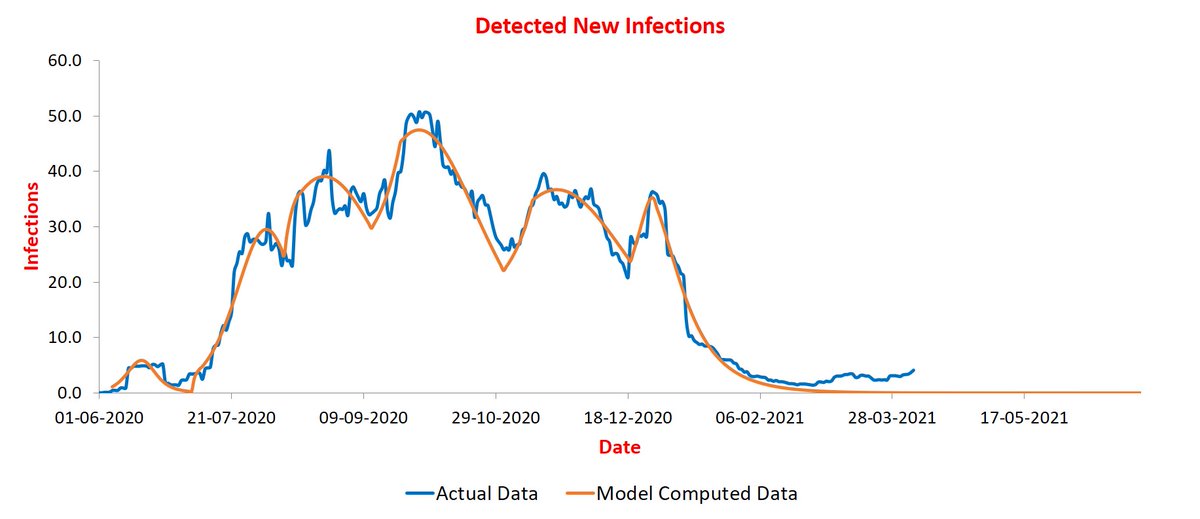
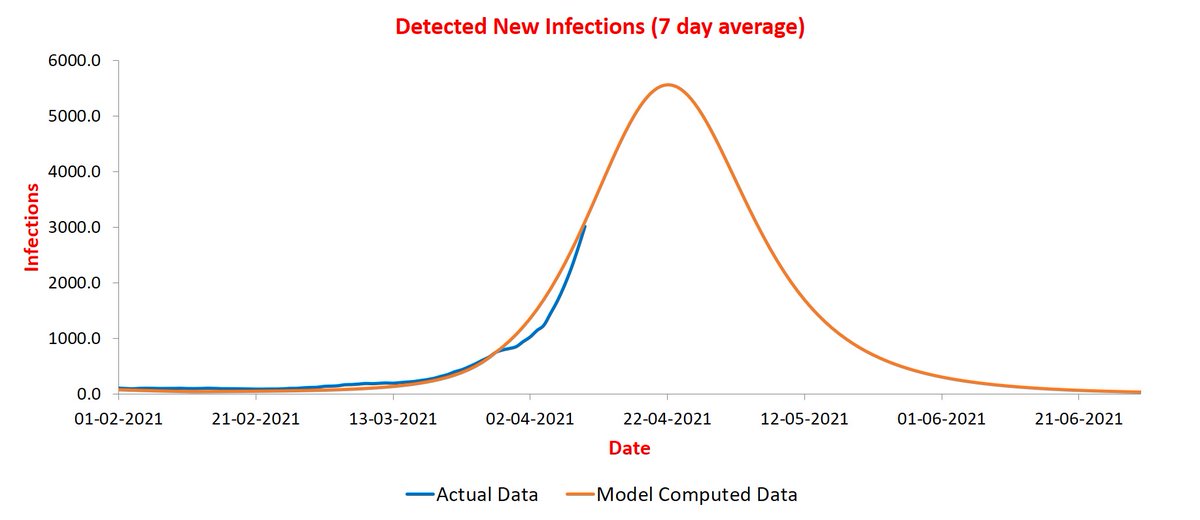
Now let us see Maharashtra, the driver of second wave. The contact rate is high for a while here (0.38 at present). The peak will be bigger than first at ~40K new infections per day. It is likely to arrive in early April. 4/n
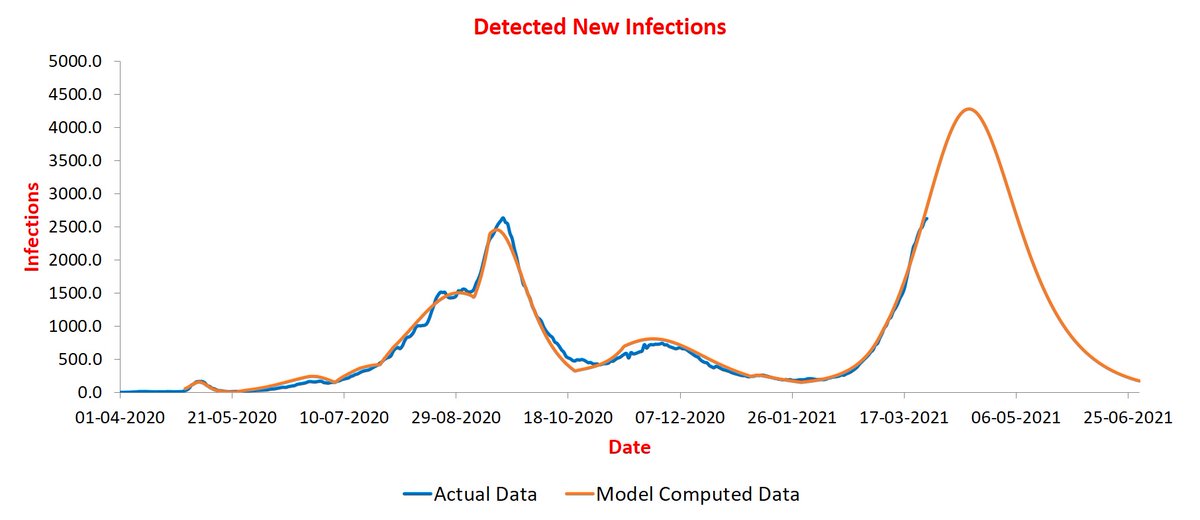
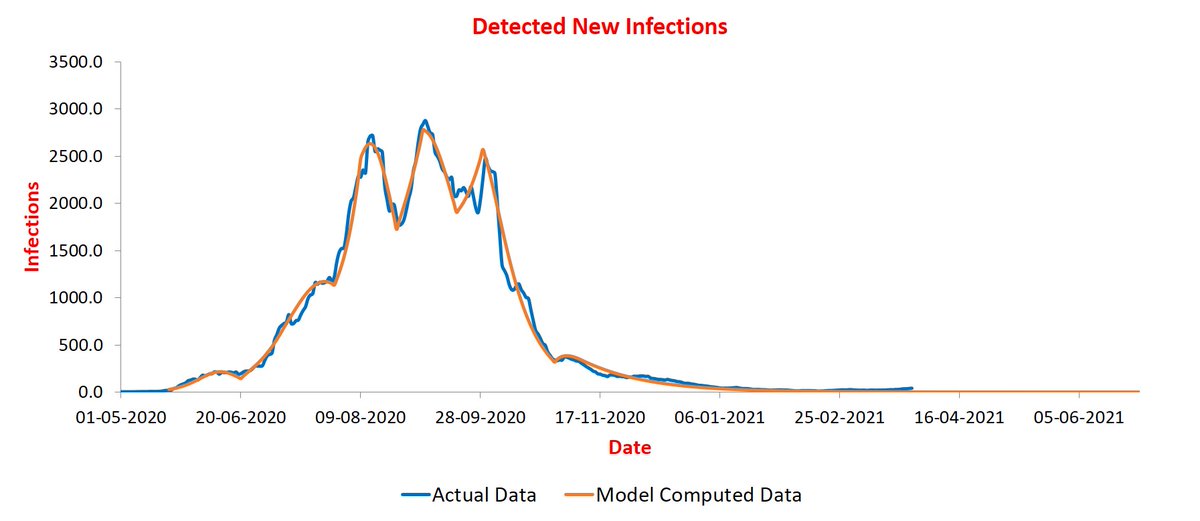
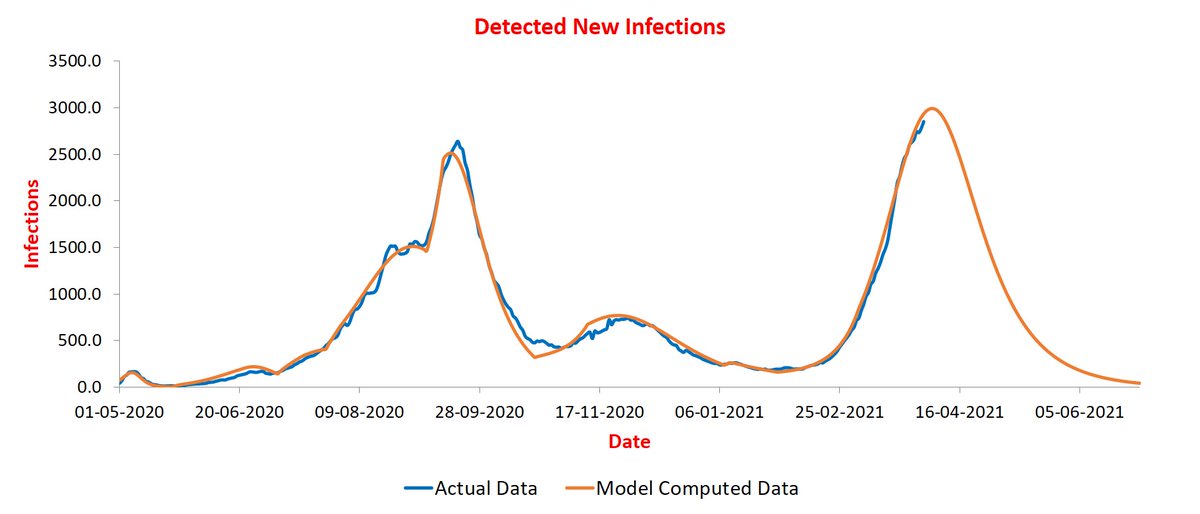
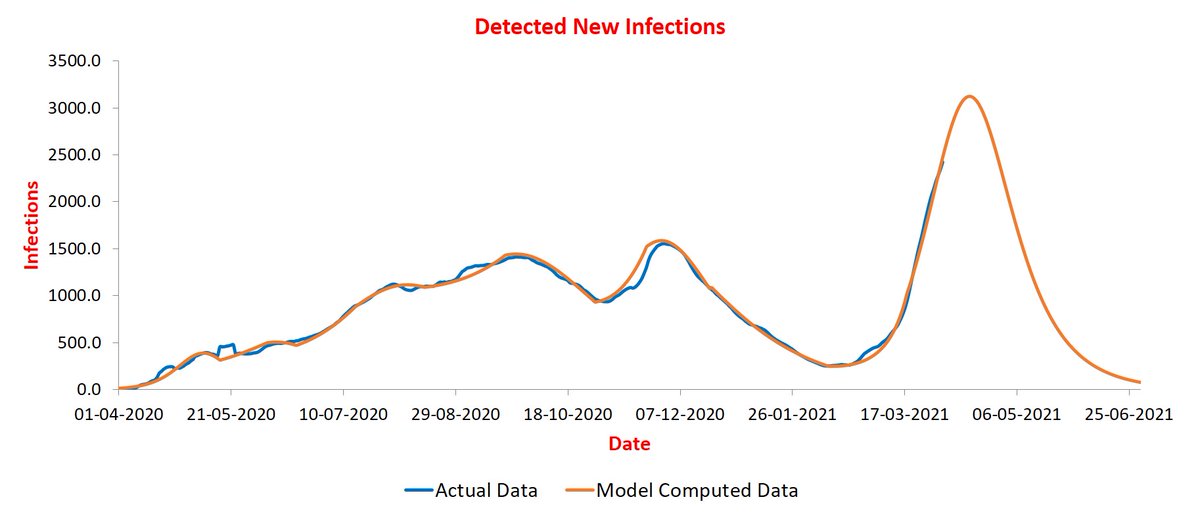
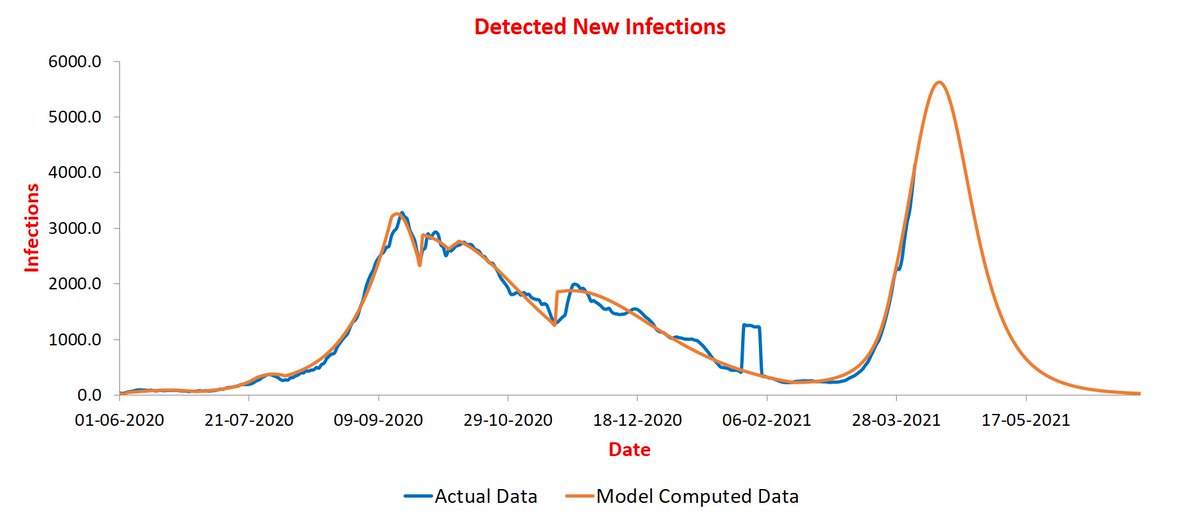
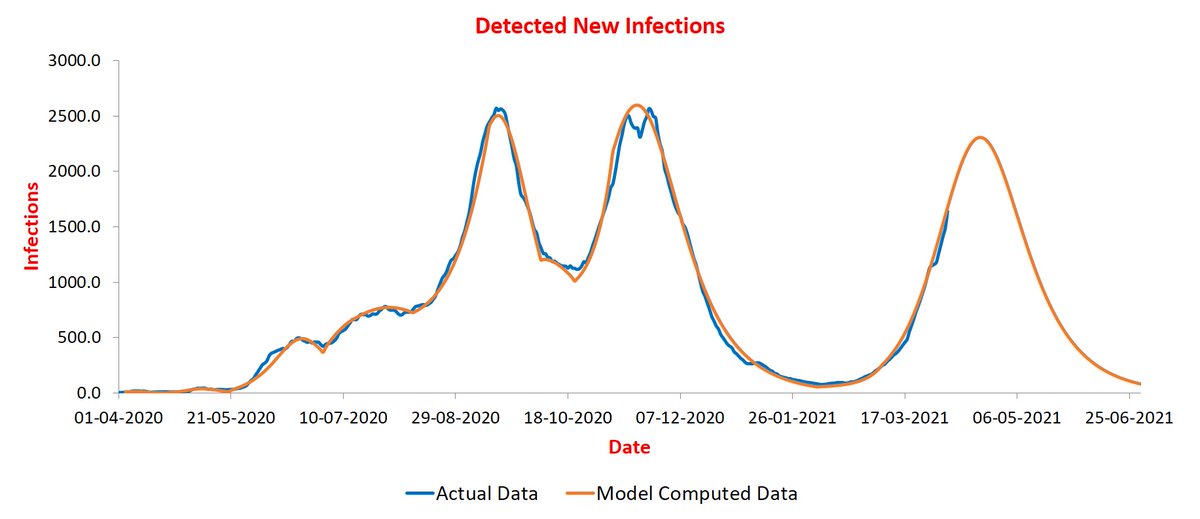
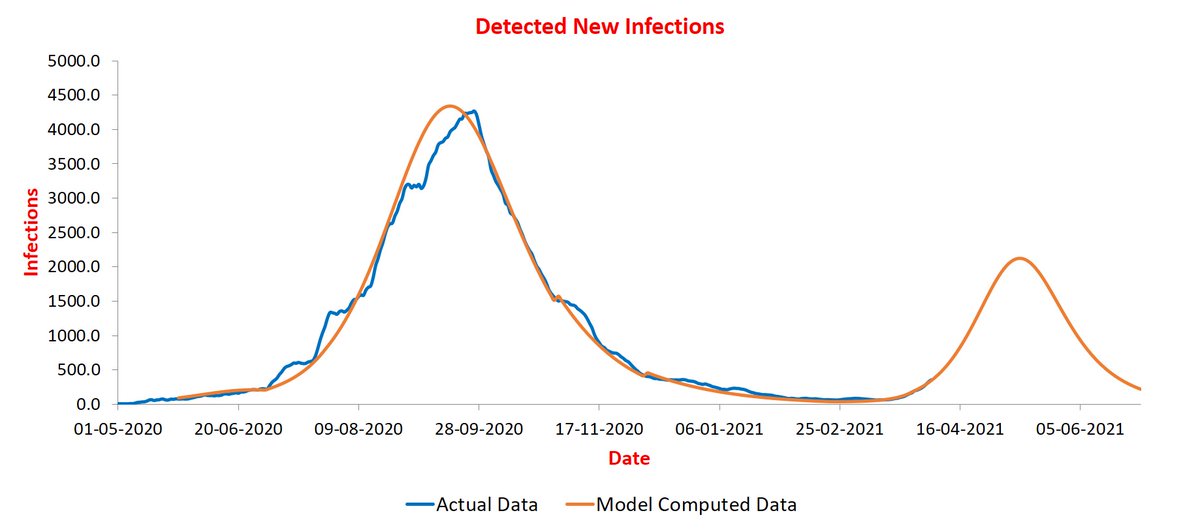
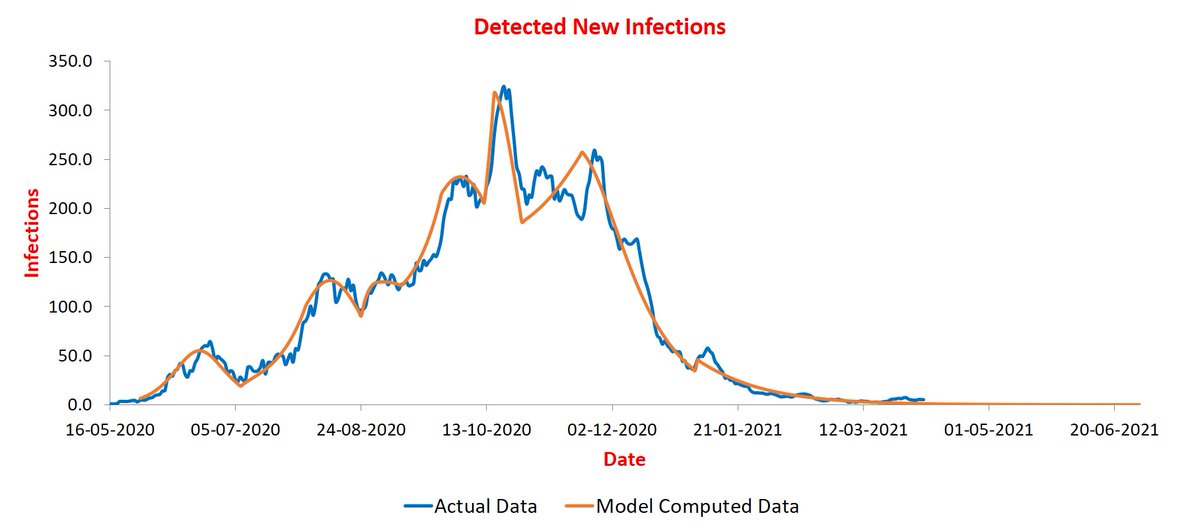
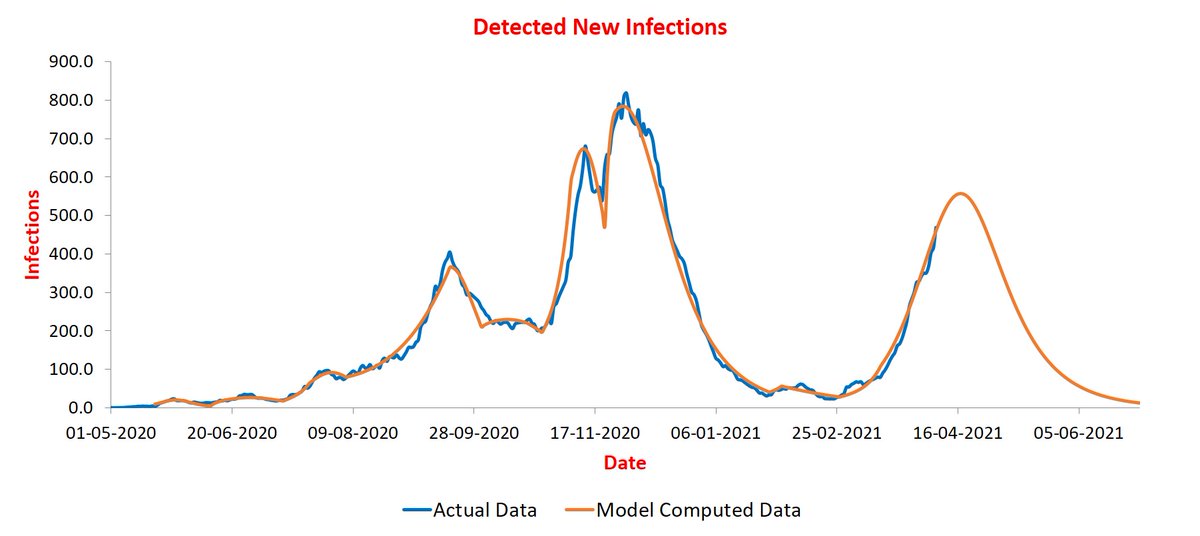
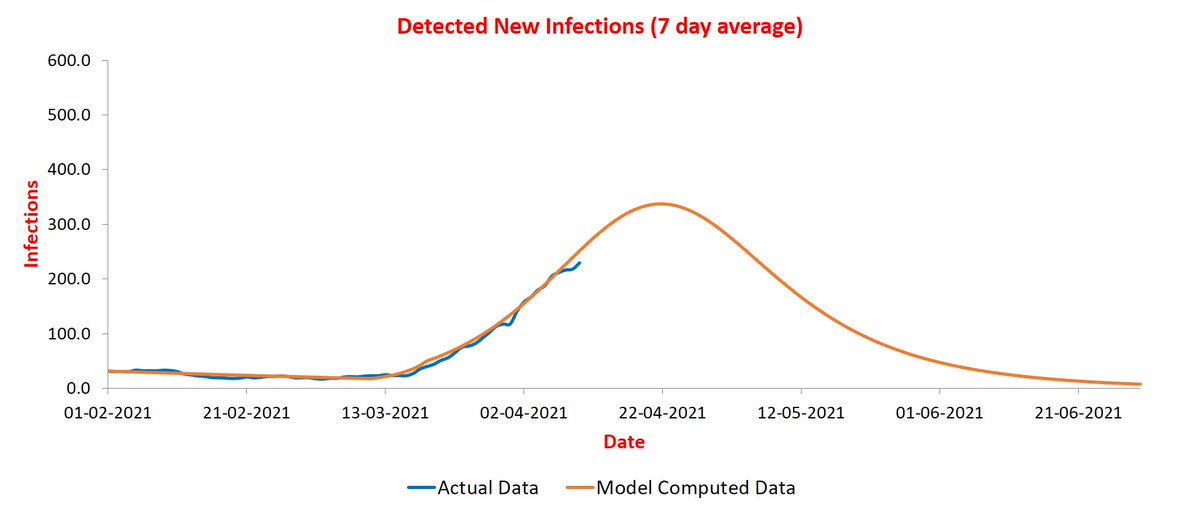
Now Punjab. Again, second peak will be bigger than first at around 4K new infections per day, and will arrive in mid-April. Here, the contact rate is not as high (0.3), but there has been a significant increase in reach (nearly doubled). 5/n

While many other states are now showing upward trend, none is likely to be as large as Maharashtra. So what was special about Maharashtra? Apart from high contact rate, reach also increased by about 40%. The combination of increase in both is lethal! 6/6
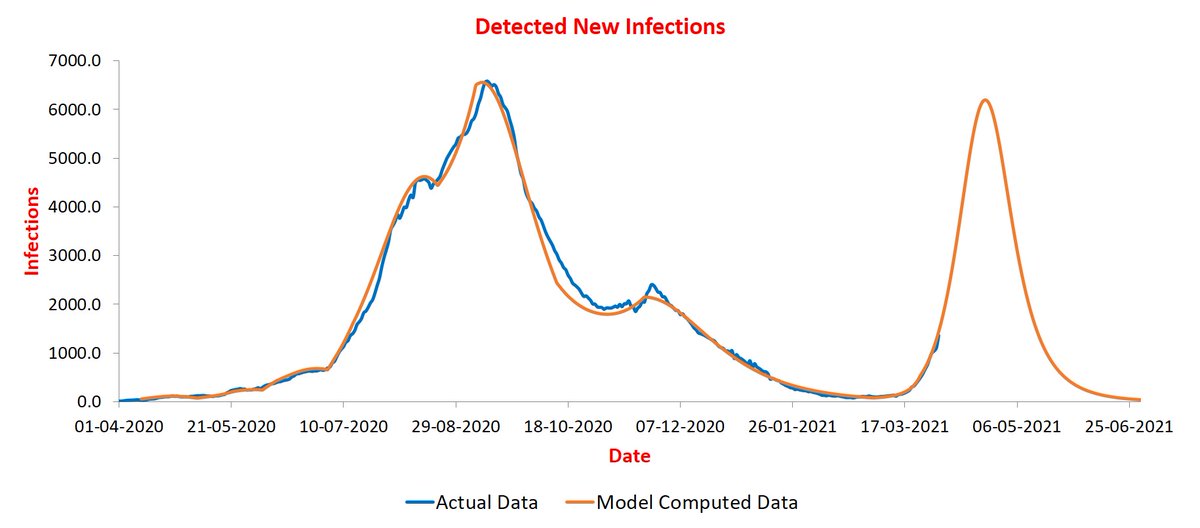
26/3 Update: Actual trajectories continue to follow predicted ones. As new data is added for everyday, the parameter values are hardly changing showing their stability. India is likely to peak in mid-April at between 70-80K infections per day (averaged over 7 days)
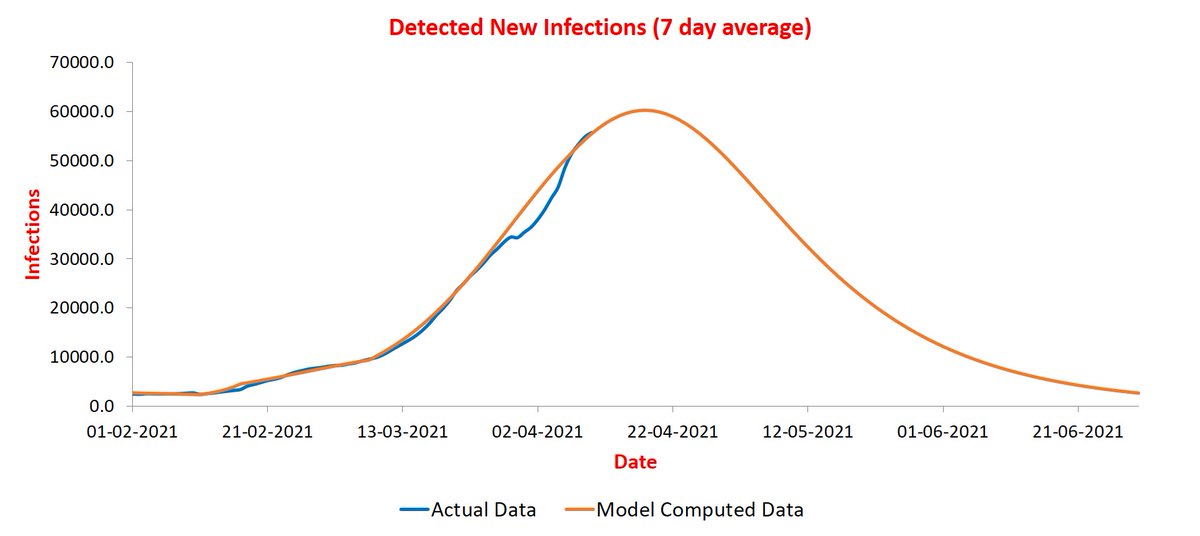
Maharashtra is similar story. Peaking in early-April at around 40K infections per day (gone up slightly).

28/2 Update: The blue curve continues to follow path traced by orange curve😊. India is peaking in mid-April. The peak value has gone up a bit to ~85K.

Maharashtra is approaching peak (within two weeks).

Punjab should peak in mid-April.
Now Delhi that started rising only recently. It took some time for the model to capture it, but there is still uncertainly -- more data is needed to plot the trajectory with confidence. It appears to peak in end-April at 4K infections per day.

Situation with poll-bound states is similar. All started rising recently and the more data is needed to project trajectory with confidence. Assam:
West Bengal:
Puducherry:

Kerala:

Tamil Nadu data is rather inaccurate and the model is unable to capture the trajectory properly. So I am not putting it out.
31/3 Update: All trajectories are showing a slowdown. This is likely due to extended Holi weekend as testing goes down. India plot:

Maharashtra:
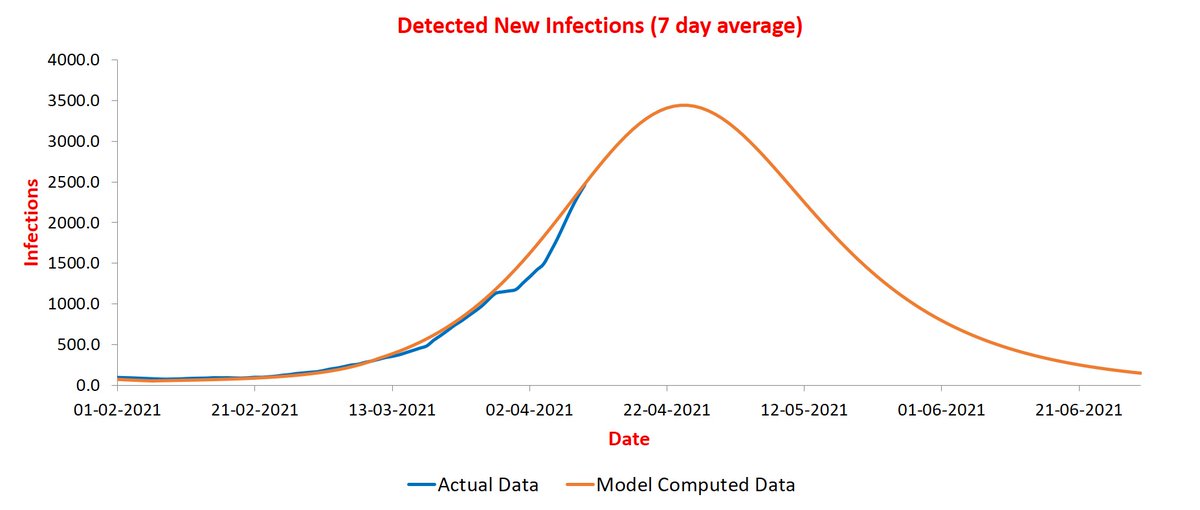
Punjab is showing significant slowdown. It may now peak at around 3500 infections/day.

Delhi is on track to surpass first two peaks, but not the third one.
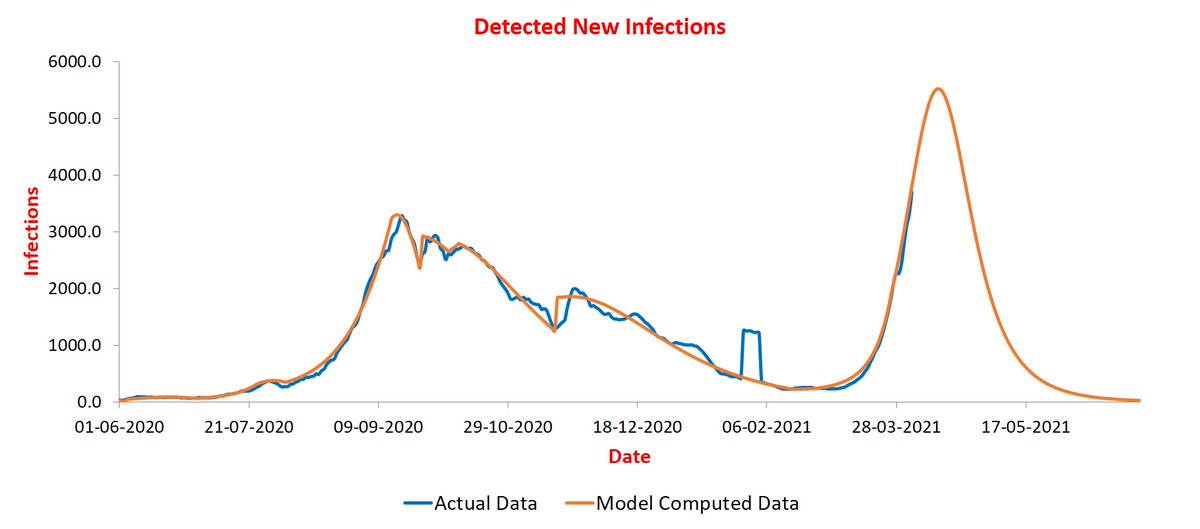
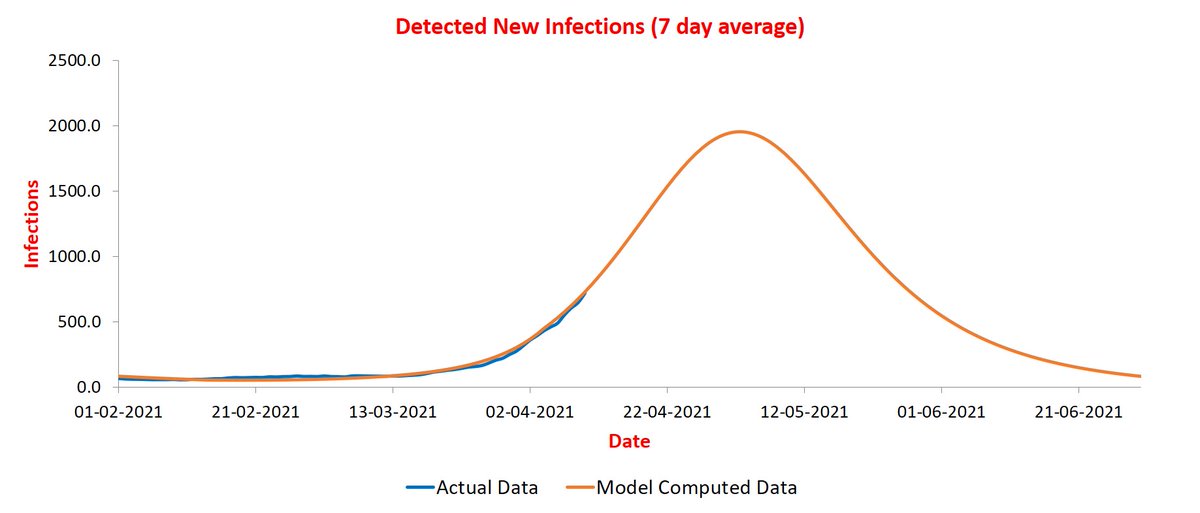
UP is a new entrant. Rise there is recent and at its beginning. It is expected by peak by April-end at around 6000 infections/day.
An interesting phenomenon is being observed during simulations. Since the rise is very sharp this time, even a slight change is parameter values causes the peak value to change by a reasonable amount. That is why, with every additional data point, the peak value is varying.
On the other hand, the timing of the peak hardly changes making prediction of peak period more robust.
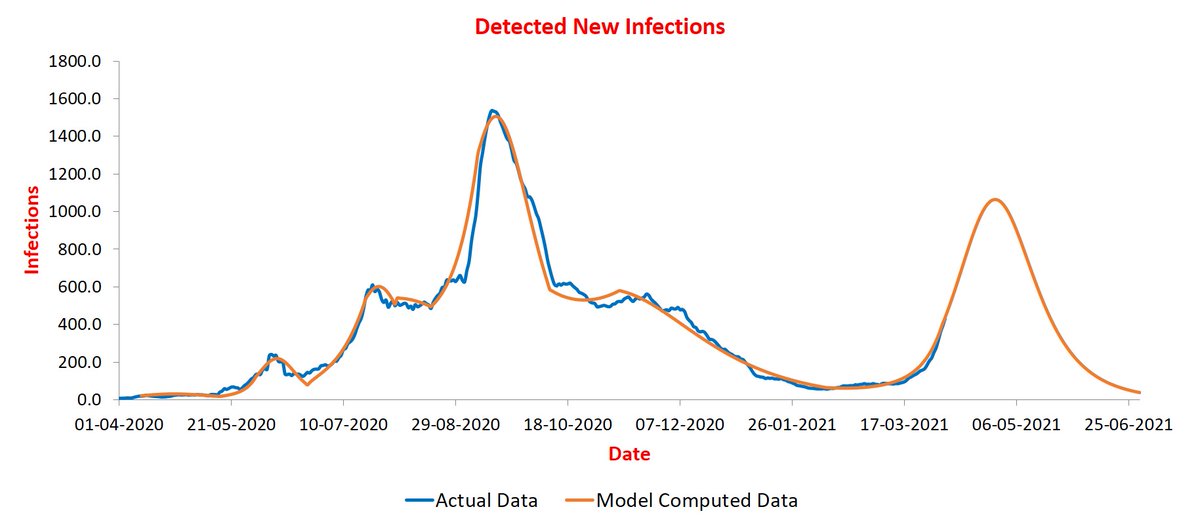
@rrgajjala Goa plot. Peak expected in early May at around 300 infections/day.

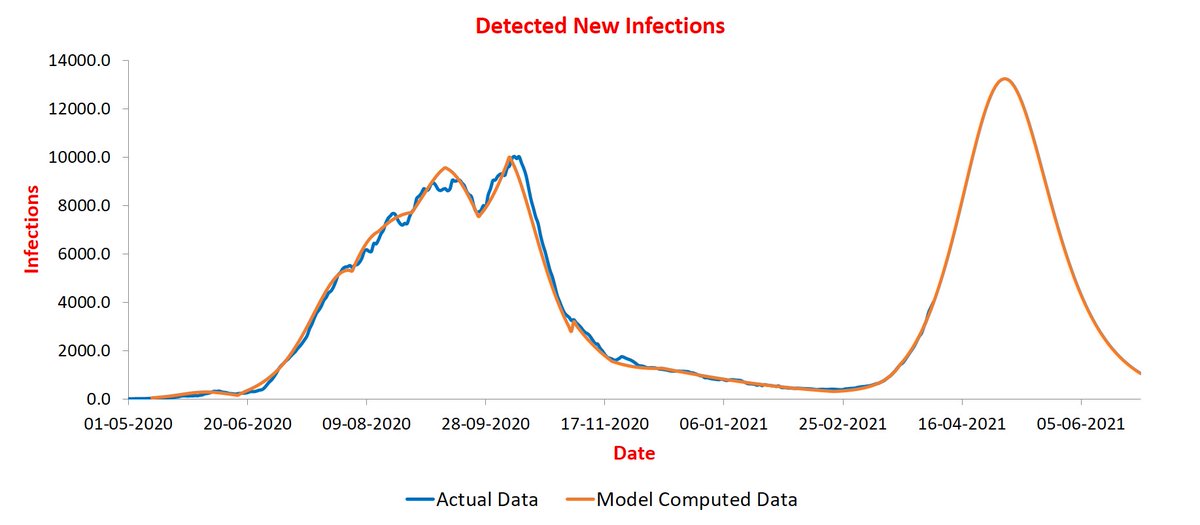
@AlokIndian8 Karnataka plot. Peak in April-end around 7K infections per day.

2/4 Update: there was a significant uptick in infections yesterday, making up for small downward trajectory during Holi weekend. India peak is still in mid-April but peak value has gone up to 100K infections/day.

First state to peak will be Punjab. Peak coming within 3-4 days.
Next should be Maharashtra around 10th April.

UP stays the course to peak in April second half at around 6K infections/day.
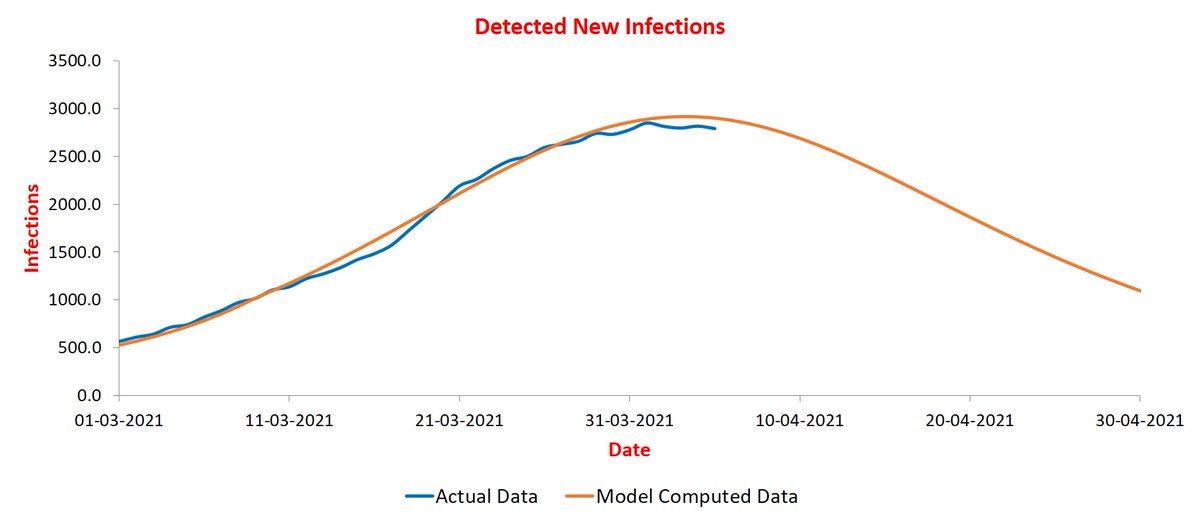
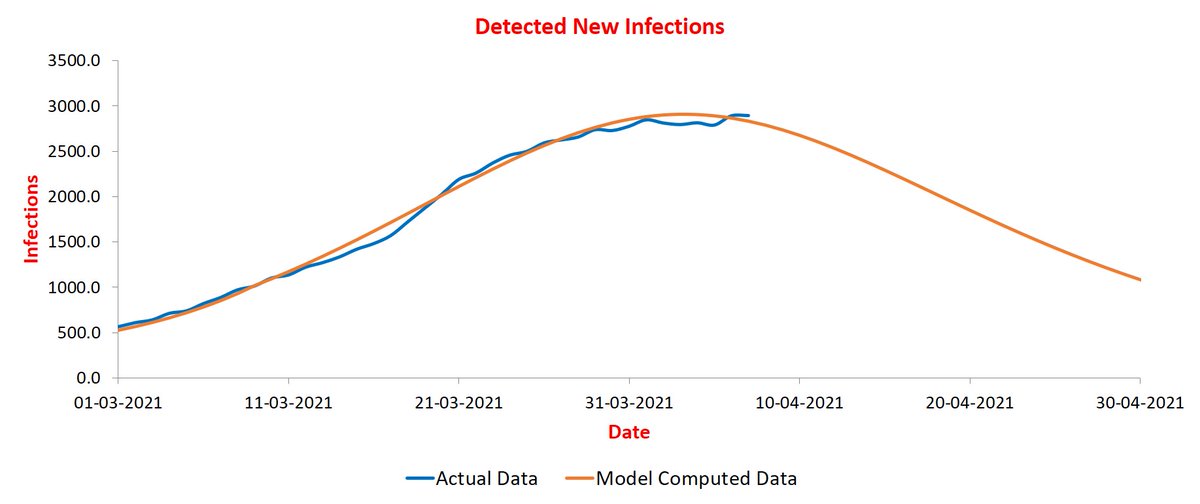
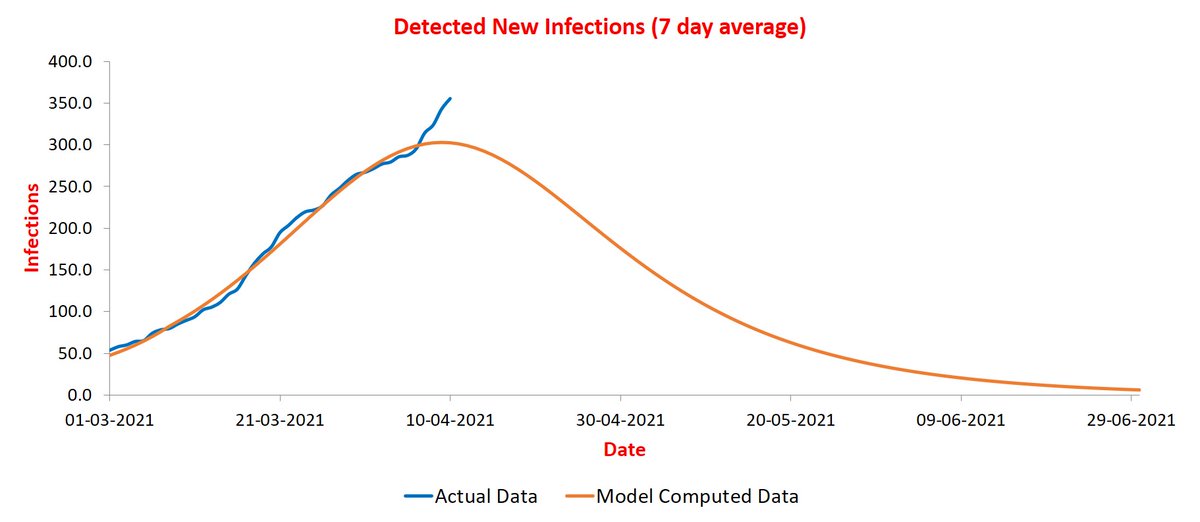
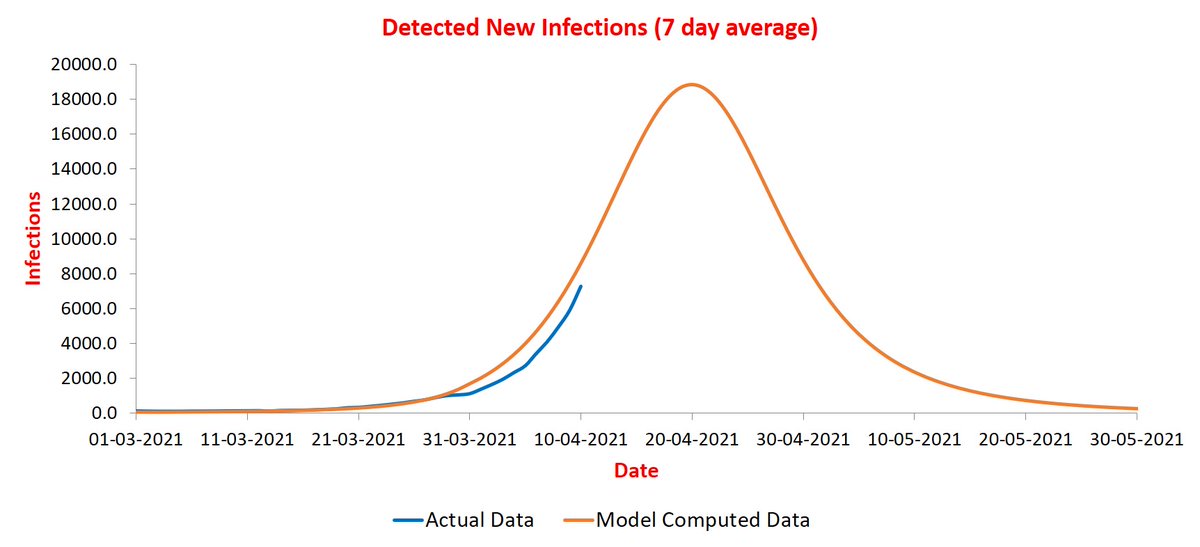
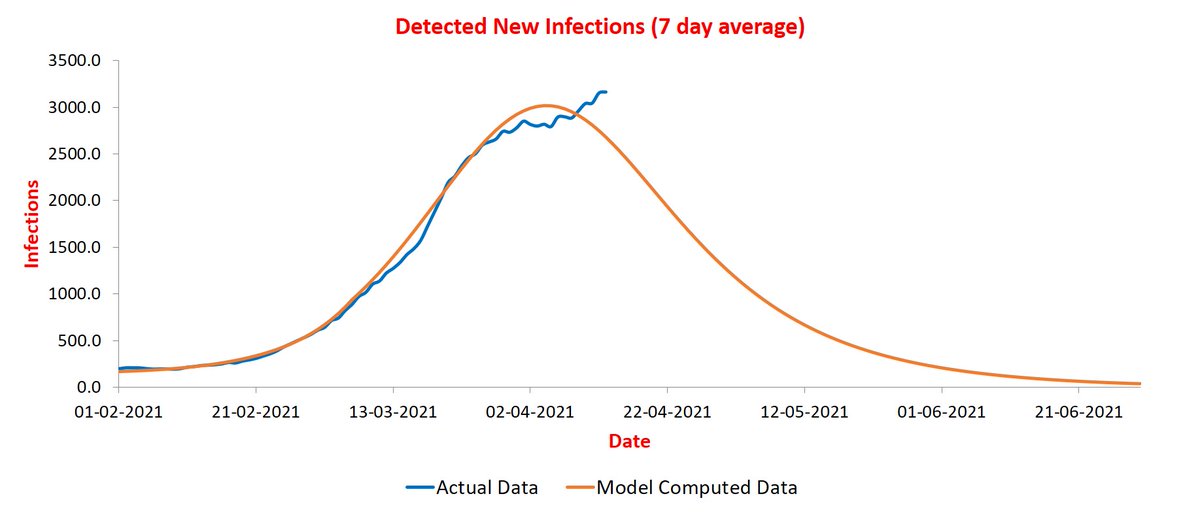
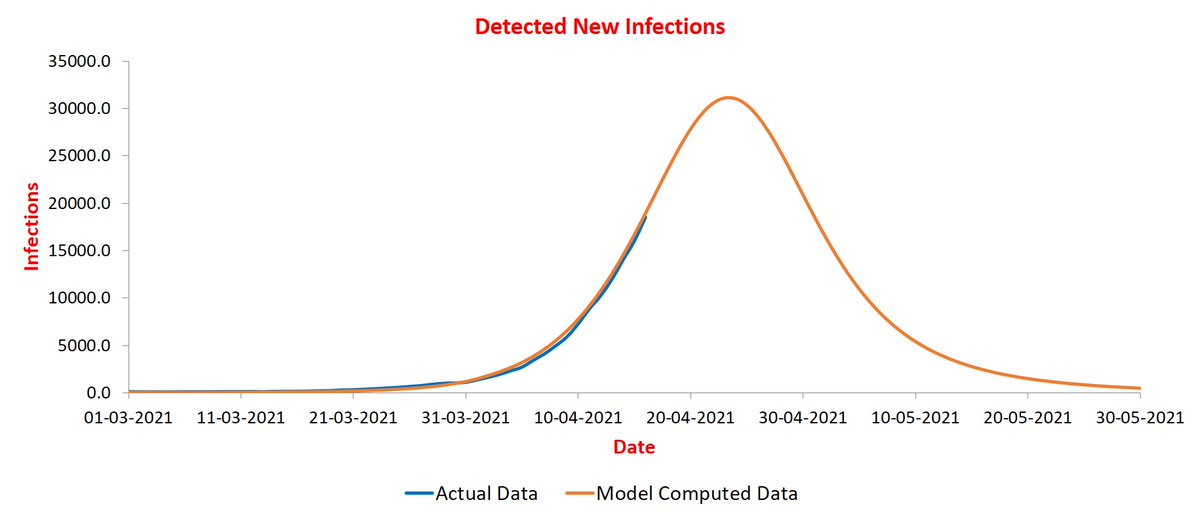
Update 4/4: Big news of the day: Punjab has hit the peak as predicted! Below is magnified plot of trajectory from 1st March. The blue curve has become almost flat, a typical characteristic of peak.

On the other hand, Maharashtra is a little puzzling. See the magnified plot below. Blue curve is still rising while orange curve is insisting it is time to peak😀. Who will win? Next couple of days will tell.
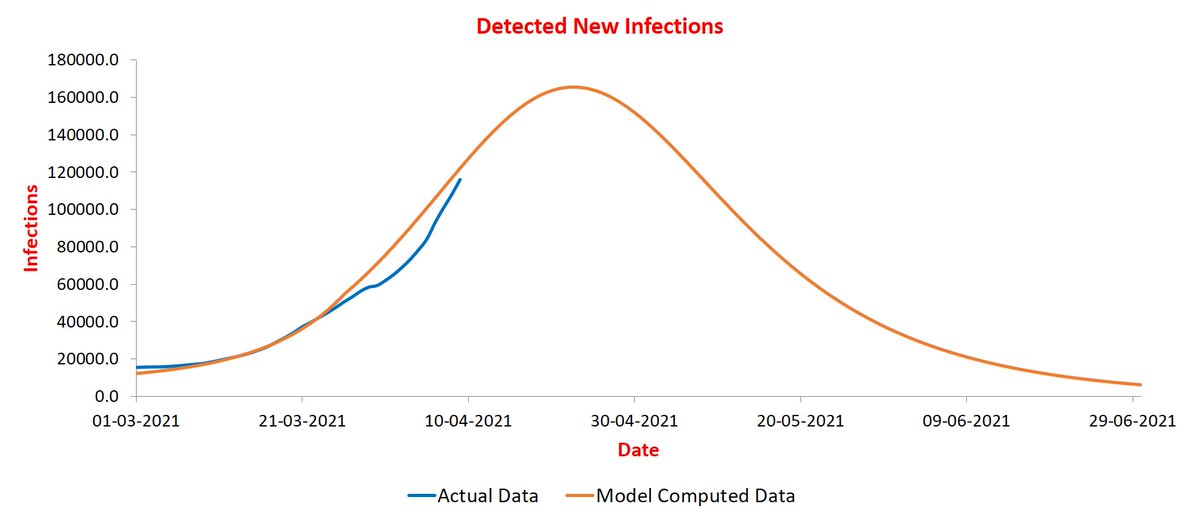
Overall, India trajectory remains the same. The peak keeps going up though and is now at 110K infections per day. As observed earlier, small changes in parameter values affect the peak significantly. Timing of peak stays between 20-25 April.
Several more states are peaking in mid-April. Here are some. Gujarat at around 3K infections/day.
MP at around 4K infections/day.
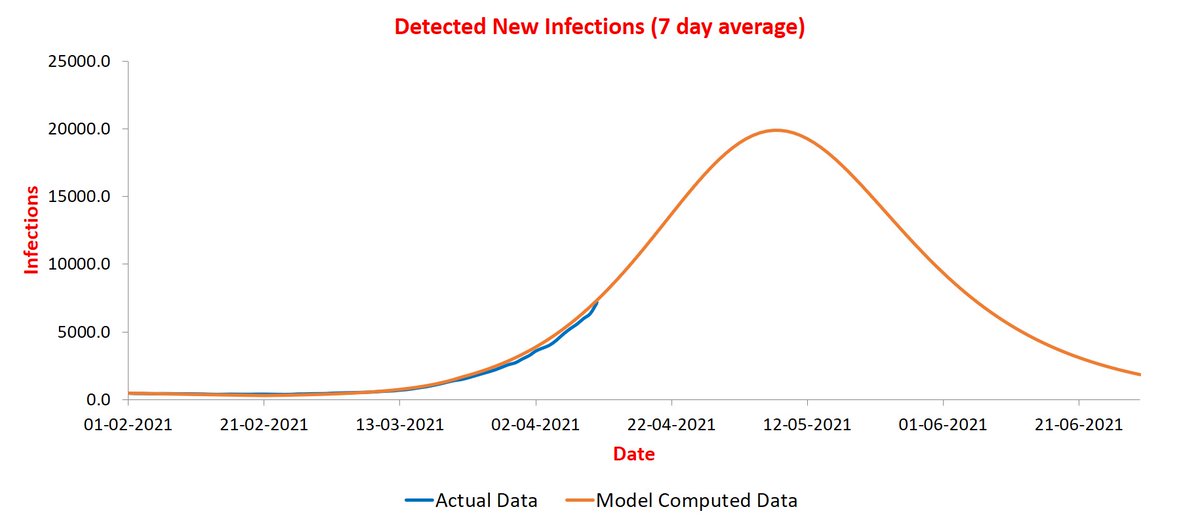
Chhattisgarh at around 5.5K infections/day. The state announced partial lockdown yesterday.
Delhi at around 7K infections/day.
And UP at around 7.5K infections/day. The peak for UP has been increasing and may go further up over next few days. The time of the peak is more-or-less the same.

I will be tweeting daily updates now as we are entering critical period. I close by plot of Pune district. It is going to peak in next few days.

Update on 5/4: The blue curve for Maharashtra and Pune pierced through orange one yesterday! This caused a closer look at trajectory of current phase. In both, there is a prominent kink on 29th March. This could be due to error in reporting or start of a new phase.
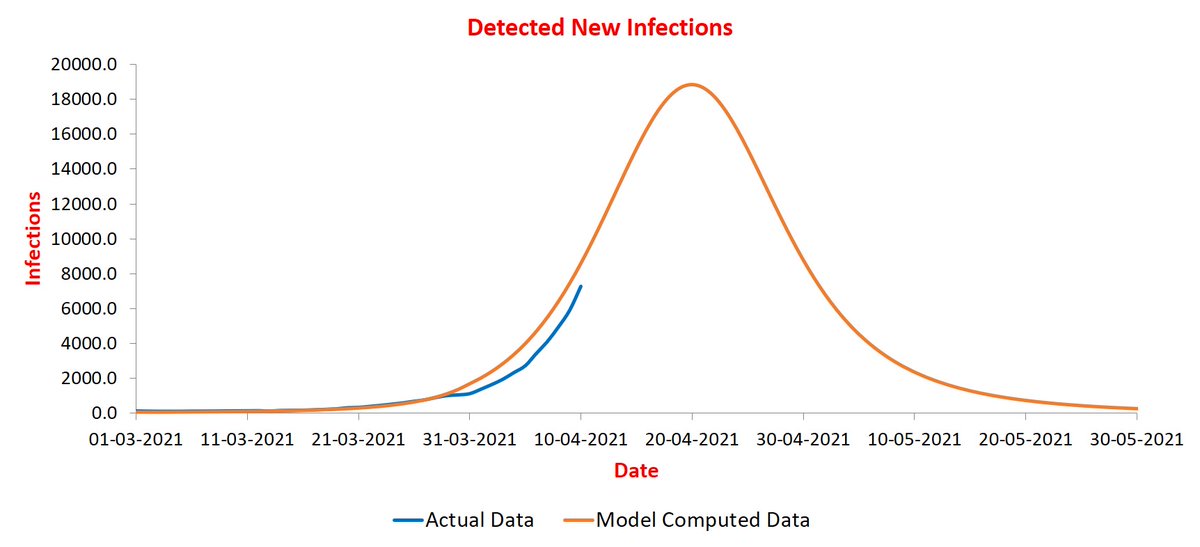
More likely to be due to error. Usually such errors do not cause much change, however, as already observed, small changes are causing major changes in peak value. Ignoring data after 28th March shows Maharashtra peak at around 47K infections/day. Period is same: 10-15 April
Pune is peaking now at around 10K infections/day. Period of peak is 10-15 April. Keep in mind that daily infection values are average of past seven days. For MH, it was ~42K and for Pune ~8.5K yesterday.

Punjab continues hovering at the peak. Blue curve should start its downward journey in a few days.

India trajectory has become slightly more peaky. Peak now at around 114K infections/day (yesterday value was ~78K). Peak date has stayed in 20-25 April range for a while now.

Gujarat is also peaking during 10-15 April with peak value of ~3K infections/day (yesterday was ~2.5K).

<Update 6/4> I decided to plot trajectories of all states and UTs today. It is now done except for very small UTs (Andamans, Dadar, and Lakshadweep). These fall in 8 groups according to peaking dates. Six of these are: now, Apr 10-15, Apr 16-20, Apr 21-25, Apr 26-30, May 1-10.
Remaining two are: ones with uncertain trajectory (not stabilized yet) and ones that have no second wave at all. I enumerate them below along with peak value. Keep in mind that (1) peak values are average of seven days, and (2) peak value may change with time due to steep slope.
Group #1: peaking now. First is Punjab.
Second is Chandigarh (no prizes for guessing!):

Group #2: peaking during April 10-15. It has four states. Maharashtra at ~50K infections/day:

Chhattisgarh at ~5.5K infections/day:
Gujarat at ~3K infections/day:

And Himanchal Pradesh at ~500 infections/day:

Group #3: peaking during April 16-20. This has only Madhya Pradesh peaking at ~4K infections/day:
Group #4: peaking during April 21-25. It has three states. UP is peaking at ~10K infections/day:
Haryana peaking at ~2.5K infections/day:
And Jharkhand peaking at ~2.5K infections/day:

Group #5: peaking during April 26-30. This has four states. Delhi peaking at ~8.5K infections/day:
Puducherry peaking at ~500 infections/day:

Rajasthan peaking at ~3.5K infections/day:

And Jammu & Kashmir peaking at ~1K infections/day:
Group #6: peaking during May 1-10. This has six states. Karnataka peaking at ~13.5K infections/day:
Uttarakhand peaking at ~1.5K infections/day:

Tamil Nadu peaking at ~9K infections/day:
Goa peaking at ~500 infections/day:
Odisha peaking at ~2K infections/day:
And Telangana peaking at ~2K infections/day:

Group #7: states where current trajectory has not stabilized yet. This has five states. First is Kerala where a slow rise is observed for past few days. Model has not yet captured it fully.
Second is West Bengal that is seeing a sharp rise for past few days.
Third is Bihar. Again a sharp recent rise.
Fourth is Andhra Pradesh. It is not clear if the rise is going to to sharp or slow! A few more days data is needed.
And fifth is Ladakh. Numbers are very small here and so estimation is rather erratic.

Group #8: these are states that must be wondering why all the hungama about the second wave! It has all seven NE states plus Sikkim. The only one to show some sign is second wave is Assam:

Where are infections in Arunachal?
What about Manipur? Observe that orange curve does not capture blue one as well as other states. The reason is very small numbers. Smaller the numbers, more difficult it becomes for model to capture the trajectories well.
Rise of past few days in Meghalaya is so small (~10 cases) that it is hard to differentiate it from random noise.
Same is true for tiny increase in Mizoram.

And Nagaland. This one was very challenging to capture due to very small numbers.
Tripura was much better. No signs of second wave here too.

The smallest numbers belong to Sikkim with highest peak at 50 infections/day!
After one month, we will know how many of these predictions (about timing of peaks) have turned out to be correct. Will keep a count😊.
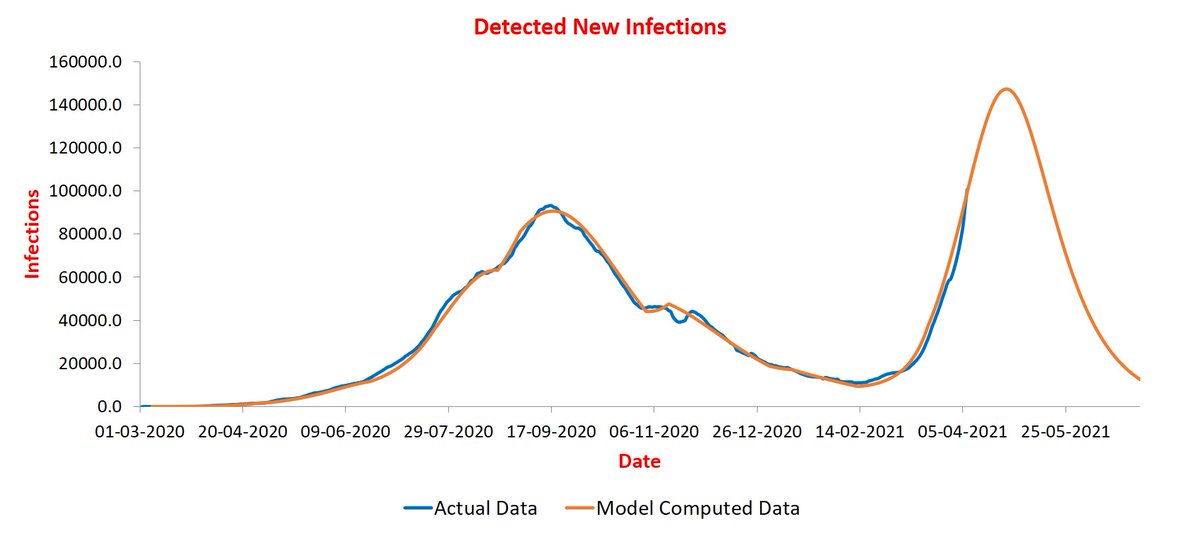
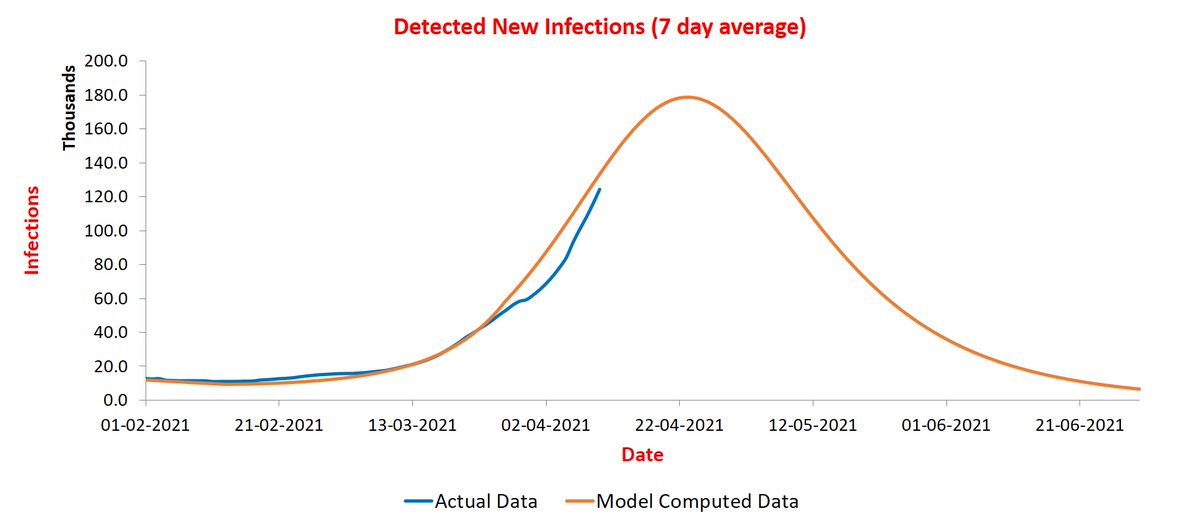
Update on 7/4. I am posting India and states that are expected to peak by April 15th. Peak value for India keeps rising! It is now ~150K infections/day. Peak period remains the same: Apr 21-25.
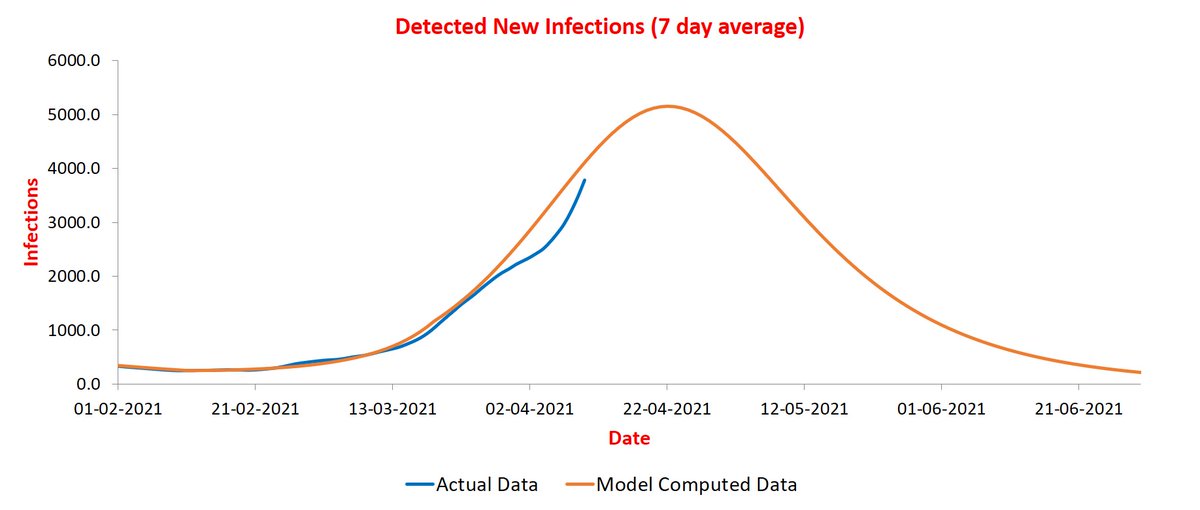
Punjab shows a slight uptick. About time it should start going down...
The uptick in Chandigarh is more prominent. This is typical when numbers are small (as observed in low population states). Hopefully it is temporary!

Maharashtra remains on course to peak during Apr 11-15 at ~50K infections/day.
Chhattisgarh has been rising sharply. Peak value has gone up to ~8.5K infections/day. It is likely to increase further.

Gujarat peak value may also rise the way blue curve is going. We will know in a day or two.

Finally Himanchal. Its peak value may also go up.
<Update on 10/4> I could update simulations due to a personal issue in the last three days. Doing it today for a few states, I noticed a consistent pattern: there was a significant reduction in cases starting from Holi weekend and now the infections are rising rapidly.
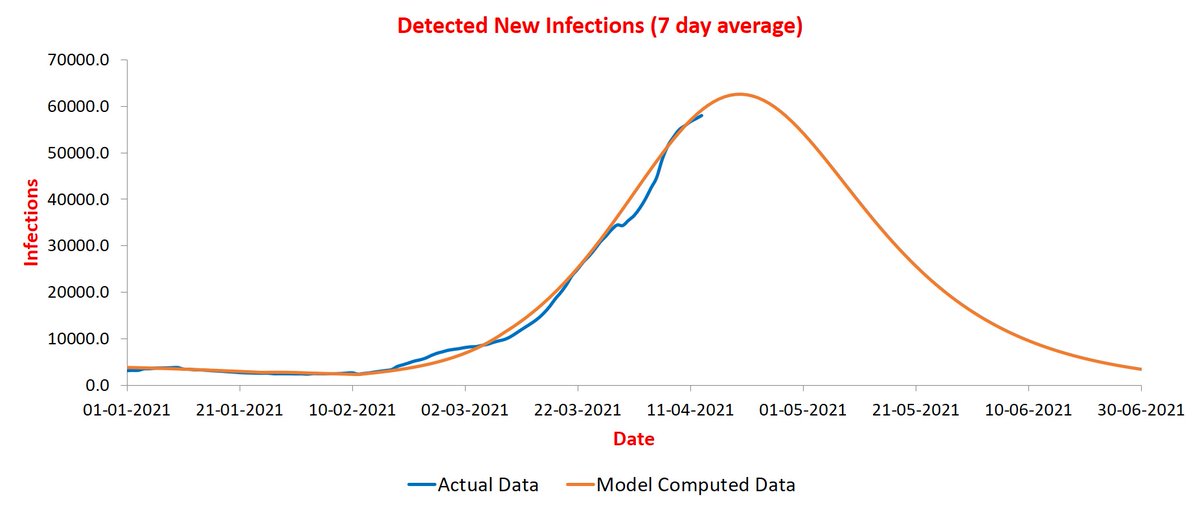
This also throws estimation of peak values off. I am posting blown up plots from March '21 onwards below. First India. The blue curve goes down after 25th March and is only now climbing back up. Peak value up to ~165K. Timing of the peak as before: Apr 21-25.
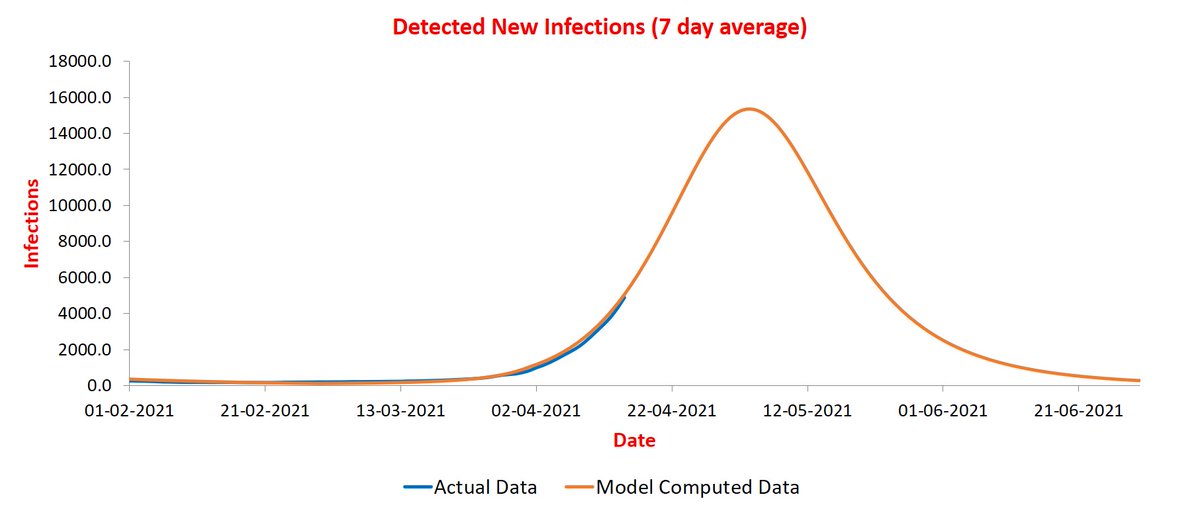
Next Maharashtra. Blue curve dips after 25th March and has now come back. Peak value up to ~63K, and timing shifts from Apr 11-15 group to Apr 16-20 group.

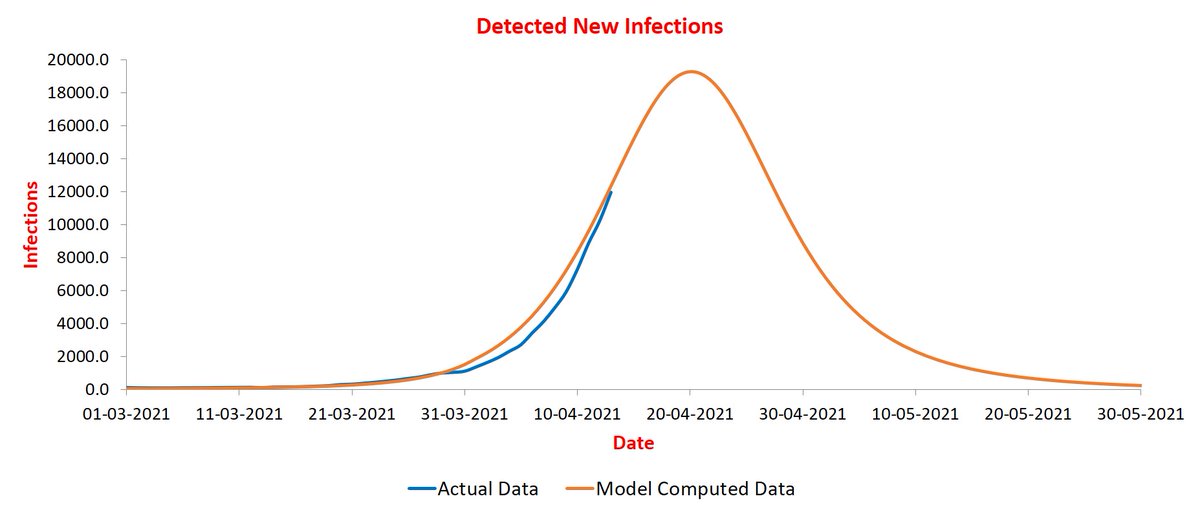
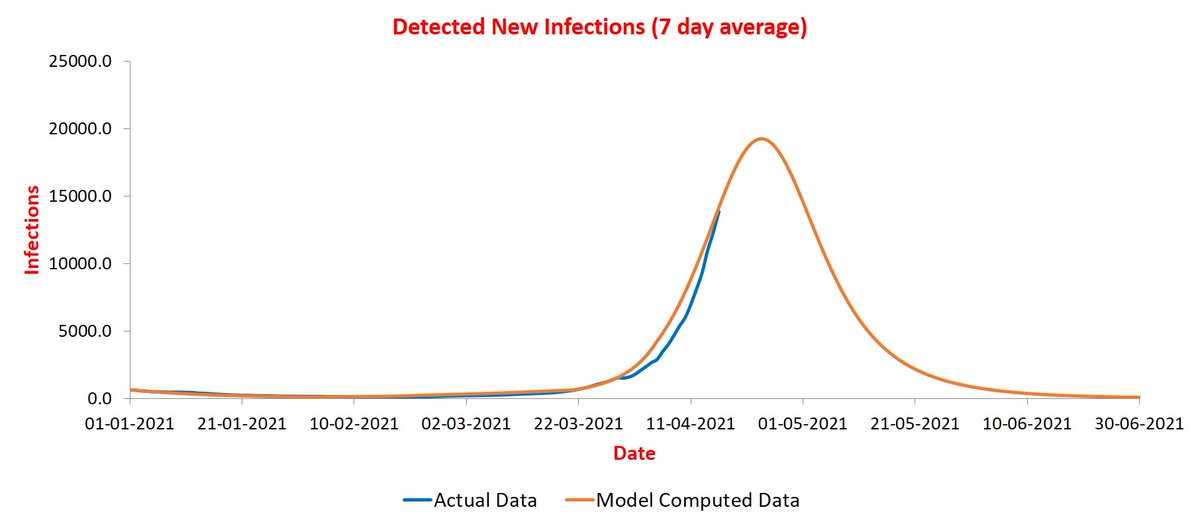
Contrast this with UP where the curve dips after 27th March and is now on its way back (hopefully to sync with orange one!). Peak value is up to ~19K, but timing stays the same: Apr 20-25.
I will need to revise all other simulations also factoring in the Holi dip. I do not expect peak timing to change (at most it may shift to neighboring block of five days), but the peak values would change. In any case, peak value estimates were a little flaky due to sharp slope.
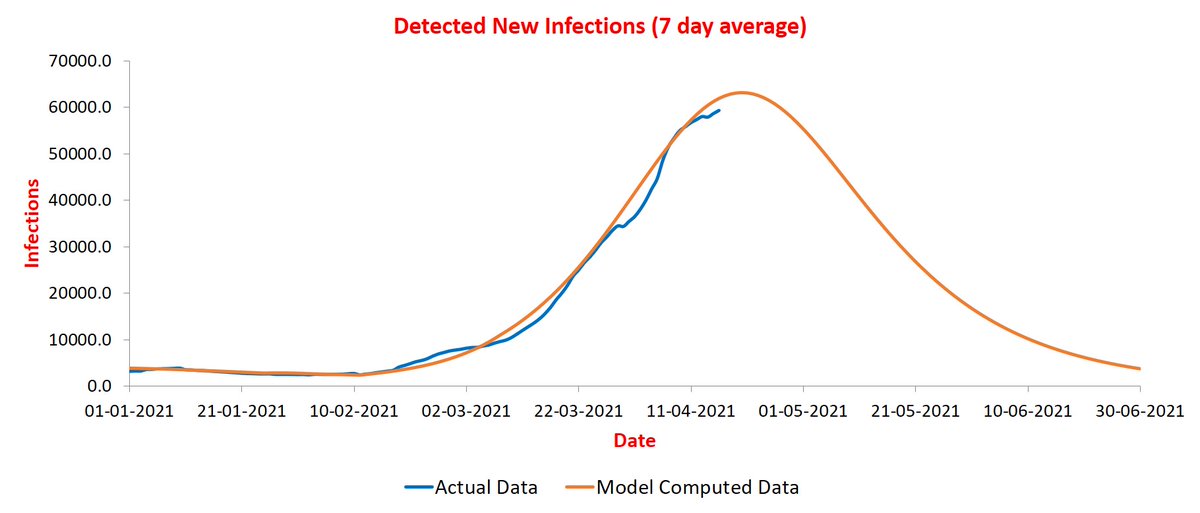
<Update 11/4> I have now redone most of the simulations explicitly accounting for Holi dip. Overall, India remains on track to peak during April 21-25. The peak value is now ~170K and may go up futher.
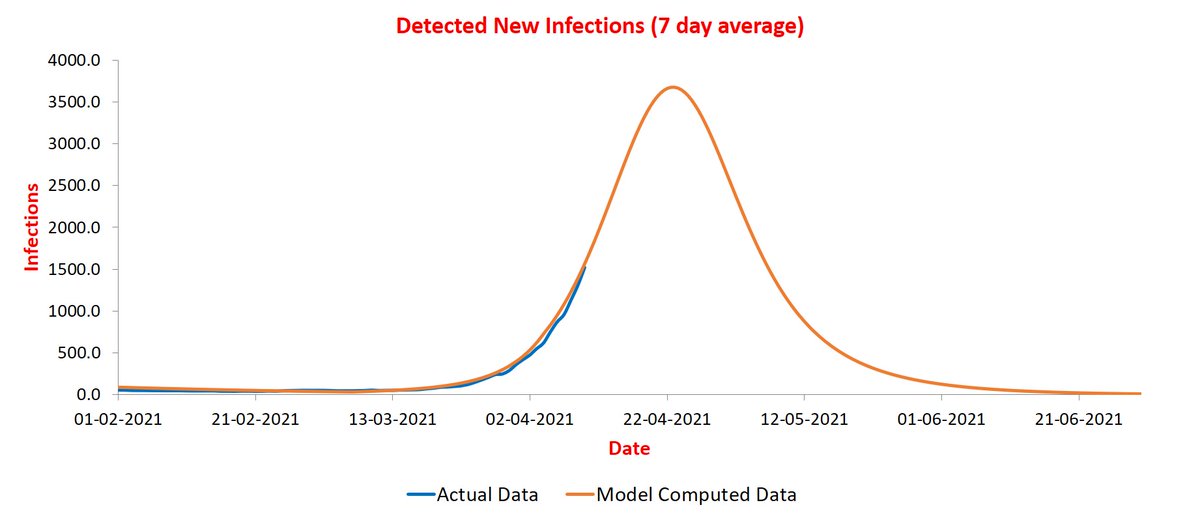
Punjab was projected to have peaked. It seems to be liking the peak and so is spending extra time there😀. Any suggestions on how to convince it to come down?🤔

Chandigarh curve flattened but is climbing up again. This could be due to multiple reasons. A plausible one is that the model assumes a state to be a closed system, but in reality, there are people coming in and going out. For small states, this may change numbers significantly.
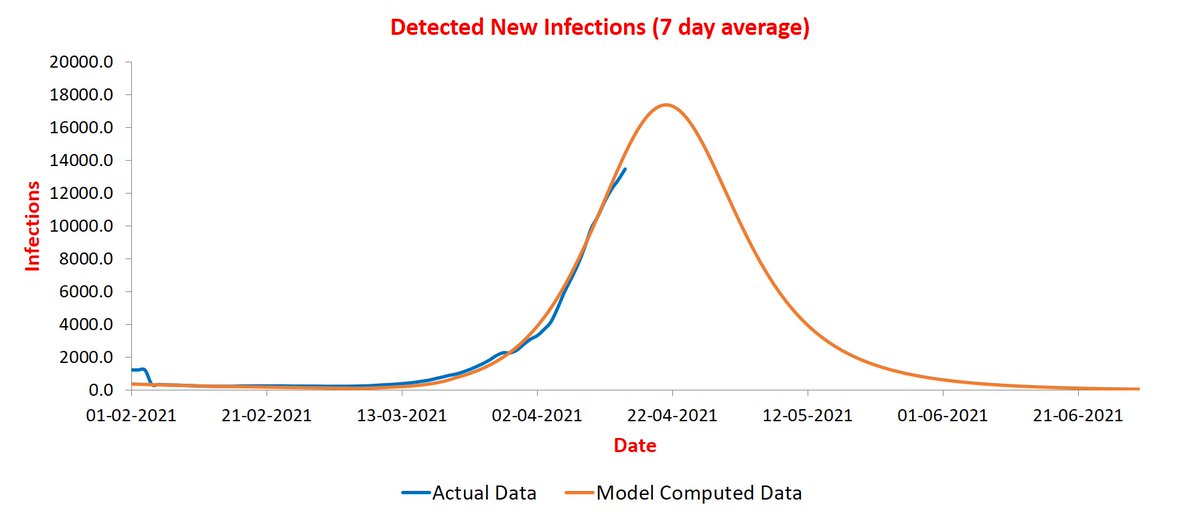
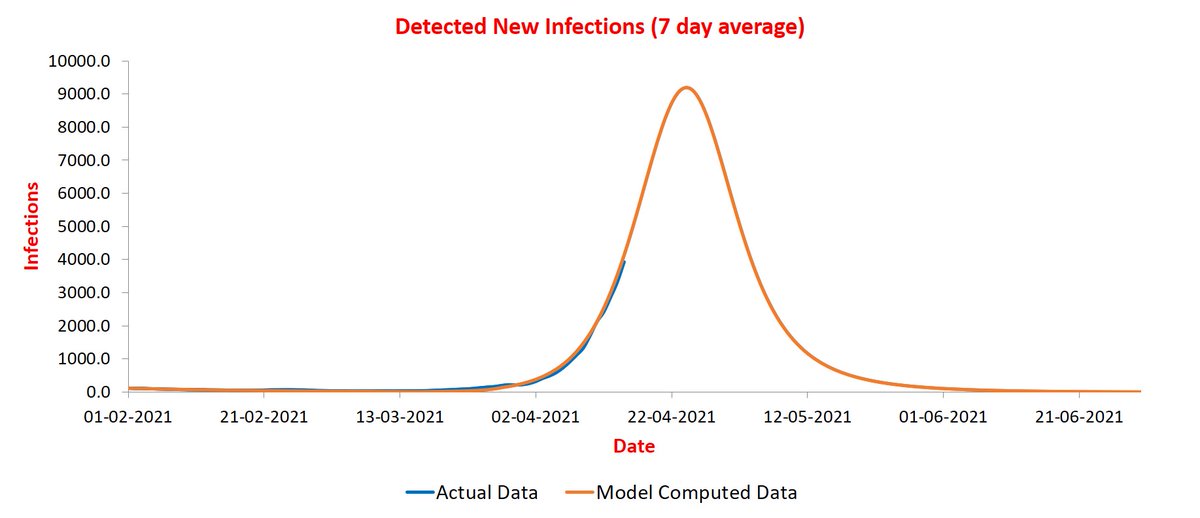
Maharashtra is back on track after Holi dip. Its peak has shifted to April 16-20 at ~61K. Note that the plot is for past 7-day average of new infections.
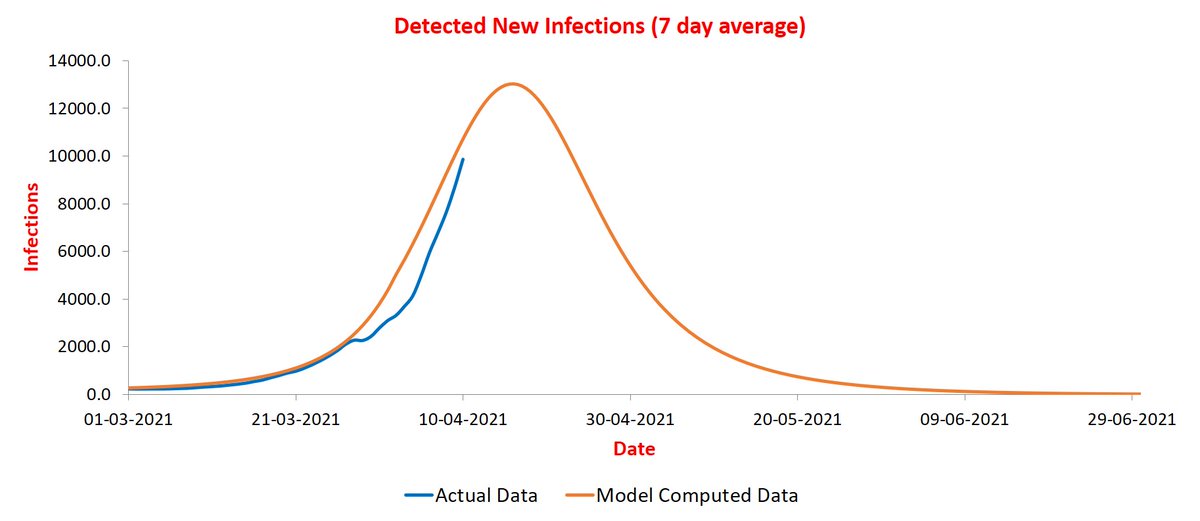
Chhattisgarh Holi dip is not yet over. It is still slated to peak during in next few days. The peak value is now ~13K and may go up further.
UP is also not yet done with Holi dip. Let us see when it comes up! Peak is still in 21-25 period with value ~19K. There is enough scope for it to go up further.
Bihar is done with Holi dip which was relatively small. In earlier analysis, Bihar had not stabilized. It is expected to peak during 21-25 period at ~5K infections.

Haryana is also done with Holi dip and blue curve is back in sync with orange one. It if continues this way, it will peak during 21-25 at ~3.5K infections/day.
Jharkhand hardly had a dip. It should peak during 21-25 at ~3.7K.
Telangana had a prominent dip and seems to be getting back to normal. Its peak period has advanced from May to April 21-25. Peak value is ~4K and may go up further.

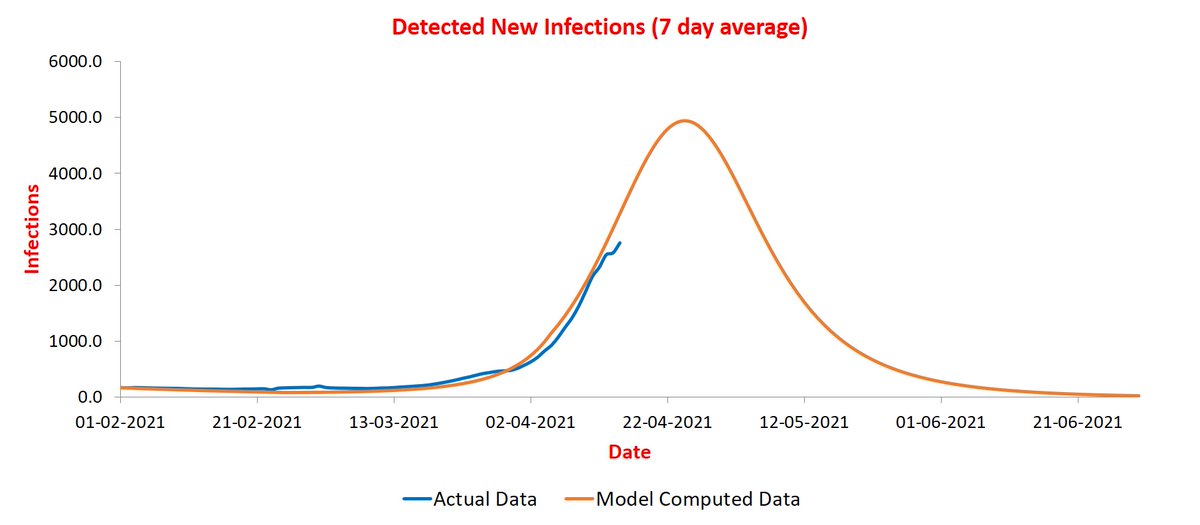
Goa also had a significant dip. Its peak also advances from May to April 21-25 at ~700 infections/day.

Himanchal curve is not well-captured and its future is uncertain. The best estimate as of now (which looks wrong) is peaking during 21-25 at ~800 infections/day.

Gujarat's dip is not yet over. It is projected now to peak during 21-25 at ~5K infections/day.
MP shows an extended dip that started before Holi. It appears to be getting over now. Expected to peak during 21-25 (earlier the period was 11-15) at ~5.4K.

Delhi's dip continues. Expected to peak now during 21-25 (earlier period was 26-30) at ~16K.

Puducherry shows no dip. It is also expected to peak during 21-25 at ~350 infections/day.
Rajasthan's dip is over. It should also peak during 21-25 at ~5.5K.
J&K shows no dip. Expected to peak during May 1-5 at ~2K infections/day.
West Bengal is another state that had not converged earlier but has now. It shows a very minor dip. Expected to peak during 26-30 April at ~7.5K.

At present, only Kerala has not stabilized. Needs a few more day's data. I will tweet the status of other major states tomorrow.
The four states I have plotted today are all in early phase of rise. So estimation of their peak value can be off by significant margin for reasons mentioned earlier. First Karnataka: peaking during May 1-10 at ~20K infections/day.
Next Tamil Nadu. It is peaking even later: during May 11-20 at ~15K infections/day.

Third is Andhra Pradesh. It is peaking during May 1-10 at ~10K infections/day.
Finally Odisha, which peaks slightly earlier during April 26-30 at ~2.5K infections/day.

India plot is roughly the same: peaking at ~170K during April 21-25.
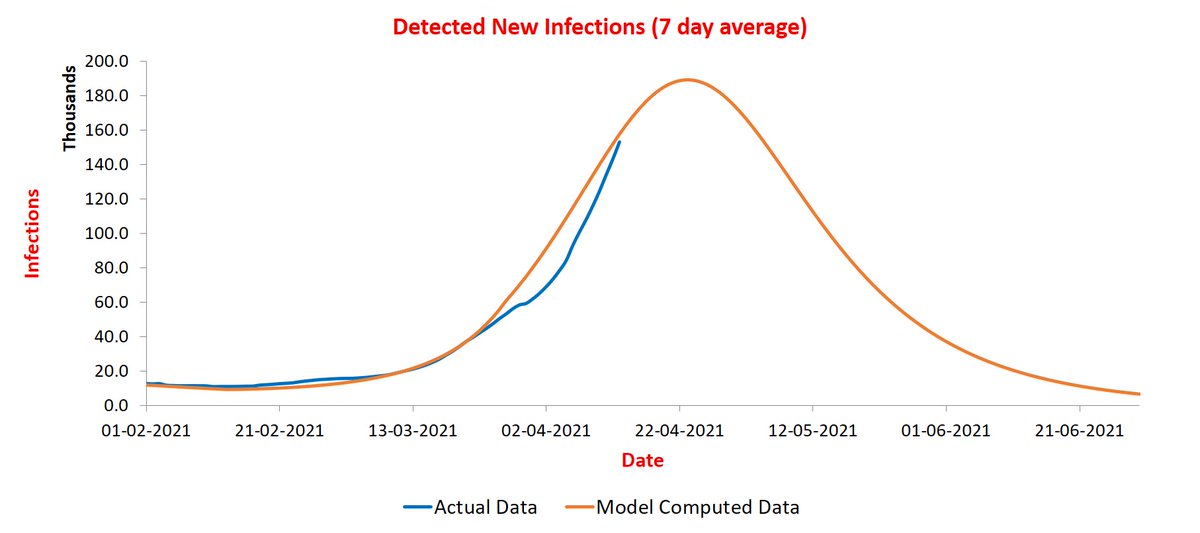
<Update on 14/4> India peak is now at 190K, still located in Apr 20-25 period. The blue curve has a higher slope than orange one at present and it is expected to turn at some point. The date of turning will decide the value of peak.
Punjab continues hovering at the peak and in fact, has gone up slightly. Such behavior is typically due to rapid controls deployed to contain the pandemic.
Maharashtra curve has turned to almost merge with the orange one. A clear indication of peak being round the corner. This is further supported by plots of Mumbai and Pune (see cities thread). And this is before the lockdown comes into effect!
Chhattisgarh is another fast rising state that should peak soon at ~20K infections/day.

UP is also seeing sharp rise in infections. The blue curve has come close to orange one with almost same slope. Slated to peak during Apr 20-25 at ~20K infections/day (at present 7-day average is ~12K).
Finally Delhi. Here also blue curve is close to merging with orange one. Its peak should arrive during Apr 20-25 at ~18K infections/day (7-day average at present is ~9K).

<Update on 16/4> A few words on states not yet captured well. These include Punjab, Himachal, Haryana. MP, and Gujarat. In all of them, a new "phase" has started recently and will take some time to stabilize. Punjab looked like peaking ten days ago, but is rising. @stellensatz
Now the states that are tracking well. First Maharashtra. It has almost reached peak. Keep in mind that values plotted are average of past seven days.
Chhattisgarh is coming close to peak, likely during April 20-25.
UP tracking very well! Also peaking during April 20-25.
Bihar peak also during April 20-25.
Telangana curve is up-and-down a bit. Broadly following orange so far, which peaks during April 20-25.
For Delhi, blue curve now appears to be merging with orange. If that holds, peak will come during April 20-25.
Jharkhand likely to peak during April 25-30. The two curves are in sync.

Same story with Rajasthan. Peaking during April 25-30.

Finally, West Bengal. It is rising now rapidly and is in early stages. Slated to peak during May 1-5.
<Update on 18/4> @stellensatz Maharashtra is hitting the peak about now. Expect it to come down in a few days.
Chhattisgarh is now flattening. Will it peak lower than predicted? Next few days will show.

UP continues to track well. Peak stays in April 20-25.
Bihar trajectory is also as predicted.

Delhi peak has shifted to April 25-30. Although the orange curve is tracking blue better, there is still some uncertainty about trajectory of blue curve.

Two curves for Rajasthan are in sync.
Also for West Bengal.
Tamil Nadu is not so clear. Need to wait for a few days.

States like Gujarat, MP, Karnataka are still not captured well due to continuous drift in parameter values.
• • •
Missing some Tweet in this thread? You can try to
force a refresh


