Manindra Agrawal Profile picture
Professor, IIT Kanpur
bubblesmoney Profile picture 1 subscribed
Apr 23, 2023 7 tweets 2 min read
@stellensatz I am back with Covid-19 predictions, when it already seems to be peaking! Reason for being so late is that the model was unable to capture the trajectory due the numbers being very small (5-6K per new for India is nothing). Once the numbers crossed 10K per day, the model did capture the trajectory somewhat. By 15th April, this is what it predicted: Image
Dec 21, 2022 18 tweets 4 min read
@stellensatz @GyanCMehta The rapid spread of Omicron in China over the past one month has raised several questions:
1) Why is it happening in China now after such a long time despite vaccination? [1/18] 2) Numbers in some countries are also rising. Is it likely to spread to other countries too?
3) Should we be concerned in India?

I recently did a simulation of spread in China and a few other countries using SUTRA. Here are the conclusions. [2/18]
Jan 5, 2022 42 tweets 10 min read
@stellensatz The assumption I made - India will behave similarly to SA - turns out to be wrong.
Indian trajectory is rising faster than projected earlier. We now have enough data to start doing preliminary predictions (as opposed to projections). Maximum data is from Mumbai. Phase plot still showing a drift indicating that parameter values are likely to change. Image
Dec 22, 2021 20 tweets 5 min read
@stellensatz South Africa peaked on 17th December. Slightly before our prediction . With data up to 16th Dec, SUTRA prediction of trajectory matches well so far. Image There seems to be broad agreement that Omicron arrived in October in SA. If true, our earlier assumption that Omicron arrived in August causing a jump in contact rate is incorrect. So how did Omicron change parameter values?
Dec 3, 2021 15 tweets 4 min read
@stellensatz More information on omicron variant. First, a more careful SUTRA simulation shows that contact rate (beta) jumped to 1 by Aug-end. It strongly suggests presence of a new mutant that was active by Aug. Note that the initially numbers would be very small and so genome sequencing may not throw up any case, especially if (as has been reported) most of the cases are mild and thus may go unreported. So it is not a surprise that first case was reported in November.
Oct 29, 2021 25 tweets 5 min read
@MenonBioPhysics gave an good critique of SUTRA model a few days ago (see ). It makes many important points regarding epidemiological modeling. In this thread, I am going to develop his analysis further and show what is the purpose of SUTRA model. A key point made is that epidemiological models stratify population on age basis since interactions vary widely with age. Further stratification is done between mild and seriously ill cases. Former is useful to make policy decisions about controlling the spread.
Oct 12, 2021 32 tweets 7 min read
This thread summarizes key findings of our report iitk.ac.in/dord/up_covid1….

What is the UP Model? At its heart is the decision not to shut down the economy during the second wave. This helps weaker sections of society as they are the worst sufferers of a lockdown. An additional benefit is that the returning migrant workers can find employment more easily. The downside is also substantial. The pandemic may get totally out of control since people are moving about and interacting. This would lead to a collapse of health infrastructure.
Aug 27, 2021 15 tweets 4 min read
@stellensatz A thread on testing strategies. They can be classified in three broad types: 1) random testing, 2) targeted testing, and 3) infection chasing. Targeted testing is biased towards those more likely to be infected. For example, testing only symptomatic people. Infection chasing is biased towards those less likely to be infected. For example, testing everyone in a locality if one positive case is found. This is the strategy recommended by WHO. So how does one find out which strategy is a state following?
Jul 11, 2021 27 tweets 6 min read
@stellensatz Starting a new thread on states where infections are not coming down as expected, leading to apprehensions about a third wave. Let us see Kerala first. As one can see, the numbers were coming down nicely until mid-June, but then plateaued and now are rising. Image Current phase plot for Kerala shows continuous drifting. The points are turning, which indicates that stability is still far off. What is causing this? Parameter estimates, admittedly imprecise due to drift, show that contact rate is not high, but reach has increased by 25%. Image
Jul 2, 2021 9 tweets 3 min read
<SUTRA's analysis of third wave> @stellensatz @Ashutos61 @Sandeep_1966 @shekhar_mande It took us a while to do the analysis for three reasons. First, loss of immunity in recovered population. Second, vaccination induced immunity. Each of these two need to be estimated for future. And third, how to incorporate the two in the model. Fortunately, it turned out that both can be incorporated by suitably changing contact rate and reach parameters. So that takes care of third one. First two required detailed analysis.
May 17, 2021 13 tweets 3 min read
Starting a new thread on analysis of lockdown in various states. First, let us examine UP. The plot for UP and SUTRA projections for it from 1st March are below. 
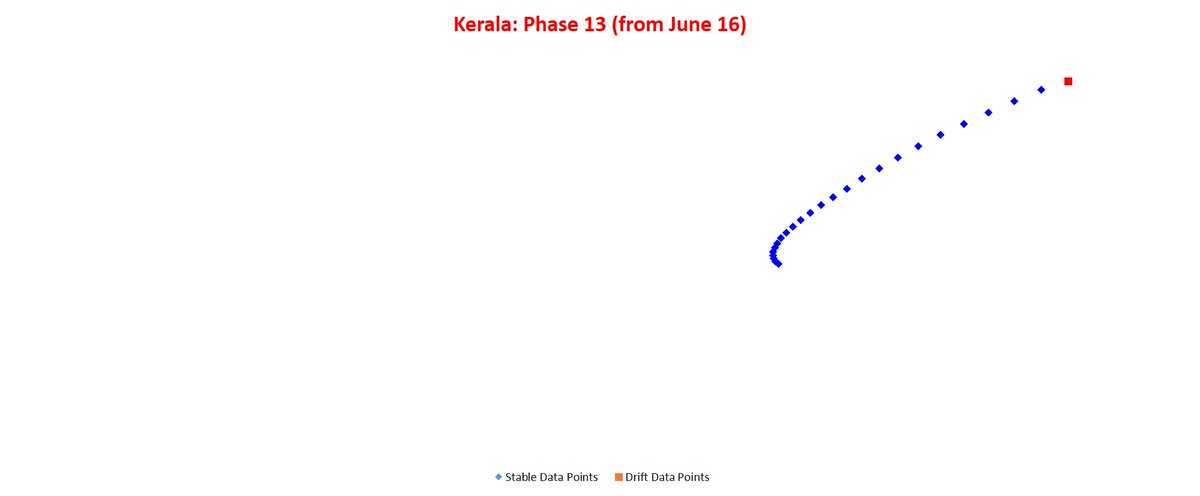
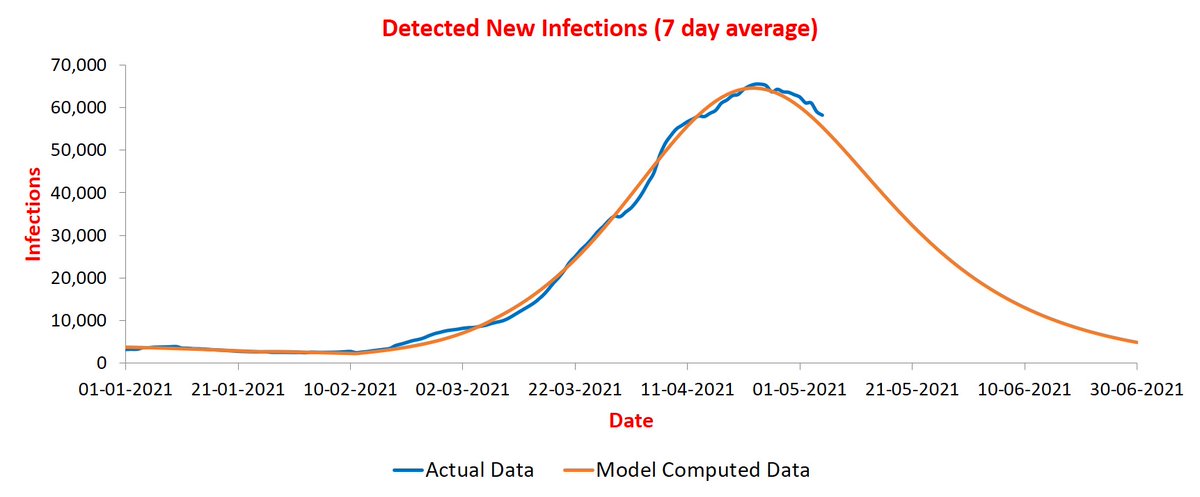
UP went through two phase changes in this period. First started on 15th March with 10 days of drift. In this phase, the contact rate went up to 0.53 (95% CI: +- 0.03) from 0.4. And reach roughly doubled. This double whammy caused sharp rise in infections as is evident.
May 6, 2021 22 tweets 6 min read
<Update on 6/5> @stellensatz I am finding it increasingly difficult to post updates. Hence, getting a website prepared that will do the job. Hope it will be ready by tomorrow. That will allow me to focus more on discussions. Many posters have pointed out erroneous predictions done for second wave in early April. I already explained the reasons in India thread. If they do not sound convincing, please pay no attention to our predictions. I am sure there are better things to do!😊
May 1, 2021 6 tweets 2 min read
@thattai I am glad to see decent language now unlike your earlier posts. I hope you can make this a habit. Your argument, as I understand it, is not that the model went wrong in March, rather that policy makers were misled by it. If yes, your argument is based on flawed premise. Policy makers do not make decisions based on one input. They collect them from multiple sources. While we did give our feedback to them last month, and it was received graciously, they were skeptical about our predictions. Seemingly they had better inputs. 😊
Apr 23, 2021 4 tweets 2 min read
I have been asked by many people about details of the SUTRA model. We have a preprint uploaded at arxiv.org/abs/2101.09158. It describes how we compute parameter values and phase changes. India projections can be found in this thread:
Apr 18, 2021 29 tweets 10 min read
@stellensatz @Ashutos61 @Sandeep_1966 @shekhar_mande Starting a new thread for India. I updated India curve last on 14th with suggested peak at ~190K. Past few days have breached this value massively. This led to a discussion amongst us (me, Prof Sagar, and Gen Kanitkar). The problem is that parameters of our model for current phase are continuously drifting, and so it is hard to get their value right. We decided to switch to predicting "active" instead of "new" infections. Former is about 10x of latter and hence less prone to fluctuations.
Apr 8, 2021 159 tweets 43 min read
@stellensatz @Sandeep_1966 @Ashutos61 @shekhar_mande Starting a separate thread on district level predictions. The predicted trajectories do not match as well as for states because of smaller population. Let us start with Pune -- it was earlier posted on thread on states. It remains on track to peak during April 12-15 at around 11.5K infections/day. Image
Mar 25, 2021 143 tweets 39 min read
@stellensatz @Ashutos61 @Sandeep_1966 @shekhar_mande This pandemic has a way of embarrassing those making predictions😀. We are indeed in the midst of second wave now. Of course, this wave is being driven primarily by Maharashtra. 1/n We had to wait for a couple of weeks for the new trajectory to stabilize. Here is what we found: the spike observed in many states is primarily due to a significant increase in contact rate (parameter beta). This parameter determines how fast the pandemic is spreading. 2/n
Mar 8, 2021 9 tweets 3 min read
@stellensatz @shekhar_mande @Ashutos61 @Sandeep_1966 Covid infections are picking up in India again. Interestingly, only a few states are contributing to this spike. Why is this happening? Our model SUTRA provides some clues. 1/n First, let us look at Maharashtra. In the picture, blue curve is recorded daily new infections (averaged over a window of seven days) and orange curve is prediction of the model. According to the model, the latest spike is due to significant increase in contact rate. 2/n Image
Dec 16, 2020 9 tweets 2 min read
This article appeared today in Print: theprint.in/health/india-i…. The reporter had called me in the afternoon and asked some questions about our model. I explained to her the conclusions including the fact that a large number of infected people in India showed few symptoms. 1/n To highlight this point, I mentioned that, according to our model, only one in 90 cases have been reported. And the unreported ones are primarily due to being asymptomatic. However, this ratio is not uniform across regions. 2/n