PHE latest COVID surveillance report now out, as is ONS.
Covers 22nd-28th March 🧵
tl,dr:
-cases down all ages except 10-19yrs.
-Significant geographical variation.
-Vax still motoring.
Covers 22nd-28th March 🧵
tl,dr:
-cases down all ages except 10-19yrs.
-Significant geographical variation.
-Vax still motoring.


Fall in case rates in all age gps (incl 5-9y/o) *except* for 10-19y/o where they've increased by 7% to 110 cases/100,000.
Lowest cases rates are among 70-79y/o at just 11/100,000, and generally there's a step decrease in case rates for ages 60yrs+ compared to those <60yrs.
Lowest cases rates are among 70-79y/o at just 11/100,000, and generally there's a step decrease in case rates for ages 60yrs+ compared to those <60yrs.

And among 10-19y/o, case rates seem to be rising mainly among 10-16y/os.

This is reflected in today's ONS data release (ending 27th March) where case rates look to be possibly rising in secondary school age, but less evidence of this in other ages.
ons.gov.uk/peoplepopulati…
ons.gov.uk/peoplepopulati…

When looking at test data.
Overall, people tested with LFDs has ⬇️ 700k this week to 4.3m.
And the total number of tests conducted has also⬇️by 550k (note, that's T&T data for wk ending 24th March, 4d earlier than PHE data)
Overall, people tested with LFDs has ⬇️ 700k this week to 4.3m.
And the total number of tests conducted has also⬇️by 550k (note, that's T&T data for wk ending 24th March, 4d earlier than PHE data)


Of 550k⬇️LFDs done in wk ending 24th, around 800k⬇️LFDs were registered from secondary schools/colleges - those aged 10-19yrs.
This is alongside 100k⬆️ LFD tests in primary schools/nurseries, and minimal change in care homes.
Therefore approx. 150k⬆️elsewhere (businesses etc)
This is alongside 100k⬆️ LFD tests in primary schools/nurseries, and minimal change in care homes.
Therefore approx. 150k⬆️elsewhere (businesses etc)


% of LFD tests coming back positive for secondary schools nearly doubled on the previous week from 0.056% to 0.106%, with 4,502 positive results - 1,669 more than the week before.
(note all counted as cases, as PCR confirmation in 2ndy schools was reintroduced on 29th March).
(note all counted as cases, as PCR confirmation in 2ndy schools was reintroduced on 29th March).
And PHE data show % of tests coming back positive for pillar 2 overall among 10-19y/o up by 50-70%
(this covers community based PCR tests as well as LFD tests, up from 0.24% to 0.40% (female), and 0.24% to 0.37% (male)).
(this covers community based PCR tests as well as LFD tests, up from 0.24% to 0.40% (female), and 0.24% to 0.37% (male)).

And finally on this, and increase in the numbers of outbreaks/incidents being reported to PHE from secondary schools.

And just to be clear here:
Test data for school and colleges cover 18-24th March.
PHE data is for 10-19y/os and covers 22-28th March.
There unfortunately isn't any reporting of number of cases for both PCR and LFD separately by age, or by setting.
Test data for school and colleges cover 18-24th March.
PHE data is for 10-19y/os and covers 22-28th March.
There unfortunately isn't any reporting of number of cases for both PCR and LFD separately by age, or by setting.
So, summary among secondary school age:
testing⬇️
case rates⬆️(a little)
positivity rates⬆️(quite a bit)
ONS shows likely upward trend in case rates
This suggests some transmission in schools - some of which would be expected, and not yet clear evidence of moving up age groups.
testing⬇️
case rates⬆️(a little)
positivity rates⬆️(quite a bit)
ONS shows likely upward trend in case rates
This suggests some transmission in schools - some of which would be expected, and not yet clear evidence of moving up age groups.
But as @chrischirp says, although school age case rates not rocketing, this will still have implications for Long COVID, and really close ongoing attention needed of case rates among younger adults not yet vaccinated.
https://twitter.com/chrischirp/status/1377628851136827399?s=20
For primary school age, case rates and positivity rates all have fallen slightly on previous, and number of reported outbreaks are similar.
Also, ONS suggesting that although case rates relatively high, not currently rising. Therefore, possibly a rosier picture.
Also, ONS suggesting that although case rates relatively high, not currently rising. Therefore, possibly a rosier picture.
Back to the surveillance report, ongoing important changes by region - as we move to the next stage of the roadmap, case rates in Yorkshire and Humber really stand out, particularly among younger age groups.


This is also seen in today's ONS data release, with rates in parts of the N more than double that in parts of the S.

And again, really stark and worrying differences by local authority, with case rates as high as 172/100,000 in Rotherham compared with just 16 in Bath and NE Somerset.

As discussed last week, addressing the underlying structural drivers of transmission in areas with ongoing high case rates is critical, and in everyone's interests.
https://twitter.com/ADMBriggs/status/1375209644721905666?s=20
Differences in case rate by ethnicity continue to persist as well, these are particularly apparent in regions such as East of England.


And there's still very little change in the relative disproportionate case rates among those living in the most deprived areas.

Bit of a bump up in notified care home outbreaks

but no change in workplaces or hospitals.


Hospitalisations still falling, and falling faster than case rates.
The number in hospital is now similar to late June last yr.
The number in hospital is now similar to late June last yr.


For ICU admission rates it's not falling quite as fast (see 45-64yrs), but as vaccination roll-out starts to include younger adults, ICU Aadmission rates should hopefully continue to decline.


And as we know, deaths still really falling and excess mortality back to baseline.


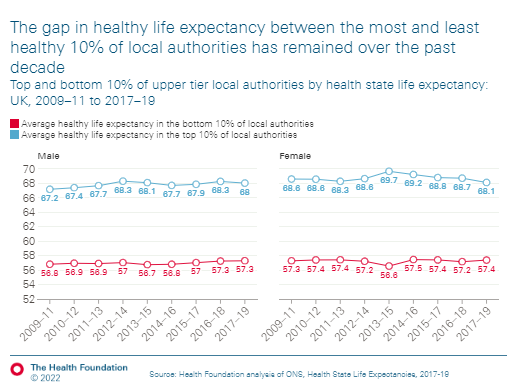
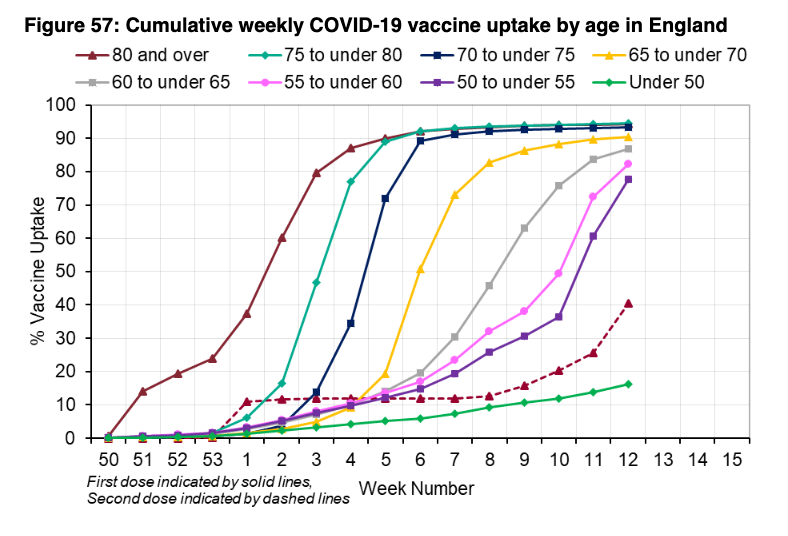
Finally, can't get enough of these two charts.
1st dose vax uptake now above 85% for all age gps over 60yrs!
1st dose vax uptake now above 85% for all age gps over 60yrs!

And here's another useful thread on the Long Covid data from @sunilbhop
https://twitter.com/sunilbhop/status/1377641612315127817?s=20
PHE surveil rpt☝️ @felly500 @deb_cohen @martinmckee @carolecadwalla @mgtmccartney @ADPHUK @Jeanelleuk @fascinatorfun @profchrisham @petermbenglish @HPIAndyCowper @Davewwest
@HSJEditor @KateAlvanley @IndependentSage
@nedwards_1 @SamanthaJonesUK @ewanbirney
@FurberA @Dr_D_Robertson
@HSJEditor @KateAlvanley @IndependentSage
@nedwards_1 @SamanthaJonesUK @ewanbirney
@FurberA @Dr_D_Robertson
• • •
Missing some Tweet in this thread? You can try to
force a refresh