
$SKLZ Updated Investor Presentation Posted
s26.q4cdn.com/331039098/file…
In this thread, I will quickly discuss updates between the SPAC presentation and this one.
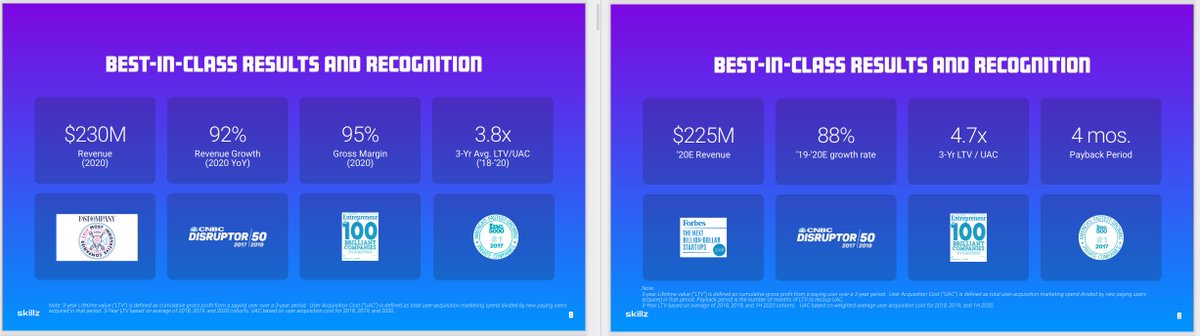
For the following images: New presentation on the left, old presentation from the SPAC on the right.
1/
s26.q4cdn.com/331039098/file…
In this thread, I will quickly discuss updates between the SPAC presentation and this one.
For the following images: New presentation on the left, old presentation from the SPAC on the right.
1/
2/
Minutes per day from 62 to 60 mins - estimated by 4 minutes per tournament. I.e. Average games per day went from 15.5 to 15.
Makes sense as they have doubled the # of paying users in 2020 but not going to try and dissect 0.5 games per day as these are all rounded anyway.
Minutes per day from 62 to 60 mins - estimated by 4 minutes per tournament. I.e. Average games per day went from 15.5 to 15.
Makes sense as they have doubled the # of paying users in 2020 but not going to try and dissect 0.5 games per day as these are all rounded anyway.

3/
Updated with revenue beat $225M -> $230M as well as updated growth rate.
LTV/CAC reduced from 4.7x to 3.8x as they have unloaded on S&M. This is the most logical short-term bearish argument in my opinion. Watching closely.
Updated with revenue beat $225M -> $230M as well as updated growth rate.
LTV/CAC reduced from 4.7x to 3.8x as they have unloaded on S&M. This is the most logical short-term bearish argument in my opinion. Watching closely.
4/
Rephrased:
Rephrased:

5/
Interesting market-size updates from `14-`19 CAGR to `15-`20 CAGR.
Movies and music were hit hard (obviously) in 2020. OTT and gaming outperformed. Books and Television overall were flat.
Mobile gaming now $86B vs $68B in 2019.
Interesting market-size updates from `14-`19 CAGR to `15-`20 CAGR.
Movies and music were hit hard (obviously) in 2020. OTT and gaming outperformed. Books and Television overall were flat.
Mobile gaming now $86B vs $68B in 2019.

6/
Take-rate has improved from 14% to 14.6%. On the path to 15% as hoped.
These figures for operating expenses include user incentives. In my opinion, the unit economics are compelling if they can get S&M down long-term. Partnered deals are important as marketing is lower.
Take-rate has improved from 14% to 14.6%. On the path to 15% as hoped.
These figures for operating expenses include user incentives. In my opinion, the unit economics are compelling if they can get S&M down long-term. Partnered deals are important as marketing is lower.

7/
New slide highlighting partnerships.
NFL
Bowlero - They own the Professional Bowlers Association (PBA)
Ganassi Racing - They own two NASCAR teams as well as others in Indycar
New slide highlighting partnerships.
NFL
Bowlero - They own the Professional Bowlers Association (PBA)
Ganassi Racing - They own two NASCAR teams as well as others in Indycar

8/
Crazy slide. Average cost per install increased from $4.85 in 2019 to $6.61 in 2020.
Crazy slide. Average cost per install increased from $4.85 in 2019 to $6.61 in 2020.

9/
ARPU updated from $6.30 in 2019 to $7.49 in 2020 as expected.
ARPU updated from $6.30 in 2019 to $7.49 in 2020 as expected.

10/
Blackout Bingo has become the #1 game as of Q42020.
Number of games over $1M in annual revenue up to 36 from 23 in 2019.
Blackout Bingo has become the #1 game as of Q42020.
Number of games over $1M in annual revenue up to 36 from 23 in 2019.

11/
New slide shows user cohort spending by year.
Spending continues to grow past the 3Y which means real LTV is higher than stated.
Also noticed newer cohorts are spending more, faster.
New slide shows user cohort spending by year.
Spending continues to grow past the 3Y which means real LTV is higher than stated.
Also noticed newer cohorts are spending more, faster.

12/
Updated slide to represent actuals instead of projections now that they are post-merger and can't project past 1 year.
Updated slide to represent actuals instead of projections now that they are post-merger and can't project past 1 year.

13/
Expected TAM has increased slightly among New Genres and iOS markets. TAM estimates are fairly unnecessary to me.
Expected TAM has increased slightly among New Genres and iOS markets. TAM estimates are fairly unnecessary to me.

14/
Added slides representing latest financials.
Removed slides on the SPAC transaction details now they are post-merger.
/END
Added slides representing latest financials.
Removed slides on the SPAC transaction details now they are post-merger.
/END


• • •
Missing some Tweet in this thread? You can try to
force a refresh


