Kevin Wilson Profile picture
Apr 4, 2021 7 tweets 3 min read Read on X
Weekly COVID-19 US and Canada Summary

Cases are taking off in parts of Canada and the US. Deaths haven't started ticking up yet.
This animation shows cases per capita for each US region and Canada.

The shaded interval is the regional minimum and maximum rates for each region, the line is the regional rate.

Obvious increases in Canada, US north-east and mid-west. Some top rate increase in south and west.
And here's the equivalent for deaths per capita.

Death rate is up a bit in the US north-east and the top-rate has increased in Canada, by a smidge (scientific term).
1st map shows the current case levels per capita in each state, 2nd shows cumulative deaths per capita.
You can see the entire pandemic timeline for the two countries in this animation. Notice the uptick in the last couple of weeks.
Updated vaccine data.

The first is my usual ribbon graph showing doses distributed and administered.

The 2nd is new (and I botched the Y axis label) and shows percent receiving at least one dose in each state and province.

Going to fix these up a little nice at some point.
That's it for this week's update.

• • •

Missing some Tweet in this thread? You can try to force a refresh
 

Keep Current with Kevin Wilson

Kevin Wilson Profile picture

Stay in touch and get notified when new unrolls are available from this author!

Read all threads

This Thread may be Removed Anytime!

PDF

Twitter may remove this content at anytime! Save it as PDF for later use!

Try unrolling a thread yourself!

how to unroll video
  1. Follow @ThreadReaderApp to mention us!

  2. From a Twitter thread mention us with a keyword "unroll"
@threadreaderapp unroll

Practice here first or read more on our help page!

More from @WilsonKM2

Aug 15, 2021
The Great Big Canadian Pandemic Summary Thread (5th edition)

First a summary of the pandemic in Canada.

Bonus analysis on pandemic outcomes in Canadian health regions and US counties
For all the graphs, I have the national range in the background in grey: the bottom is the lowest per capita rate by any health region and the top is the highest per capita rate.

So everything will be visible on the same scale.

Examples:
Read 32 tweets
Aug 14, 2021
Today in the #AtlanticBubble

No one updated their numbers, so I'll just do the full weekend report on yesterday's numbers.

There are currently 126 known, active cases in the region.
The test positivity rate in the region was 0.3%
There are currently 9 known, active cases in PEI, but no known outbreaks/community transmission, and no one is in hospital.
Read 17 tweets
Aug 14, 2021
Quick thread on vaccines, outbreaks, and why *who* is vaccinated as much as how many (although both are very important)
There's a pre-print out that gives estimates (based on sero-prevalence) of the probability of needing to go to the hospital or dying if infected with SARS-CoV-2 for a series of age brackets: medrxiv.org/content/10.110…
If you know a population's age structure, you can somewhat estimate what an outbreak of a given number of infections will look like in terms of number of hospitalizations and deaths.

And if you know vaccine coverage, you can update those estimates for those effects, too.
Read 14 tweets
Aug 13, 2021
Today in the #AtlanticBubble

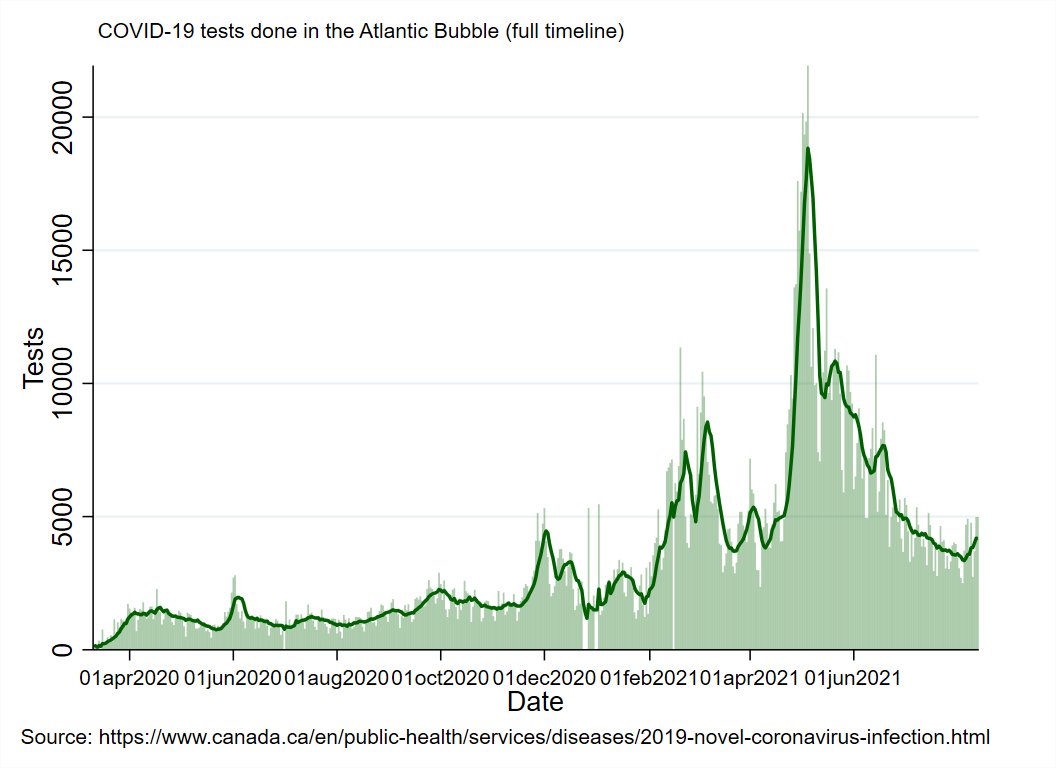
27 new cases were reported:

2 in PEI (travel-related)

4 in Newfoundland and Labrador: 1 in Labrador-Grenfell, 3 in the Eastern Health region (all travel)

2 in Nova Scotia: 1 each in the Northern (travel) and Eastern (under investigation) zones ImageImageImageImage
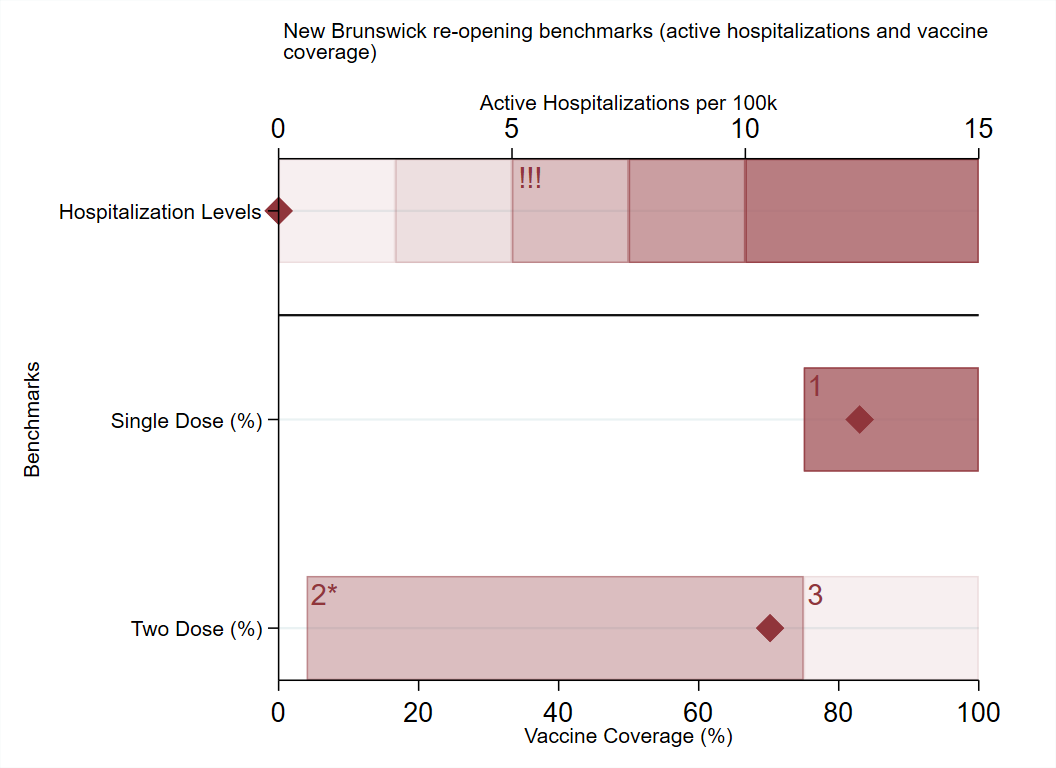
New Brunswick reported 19 new cases:

2 each in Fredericton (under investigation), Campbellton (under investigation), and Bathurst (close contacts).

3 in Saint John (2 travel-related, 1 under investigation)

10 in Moncton (5 contacts, 5 under investigation).
There are now 126 known, active cases in the Atlantic region, of which 84 are in NB (and62 are in the Moncton area).
Read 12 tweets
Aug 12, 2021
Today in the #AtlanticBubble

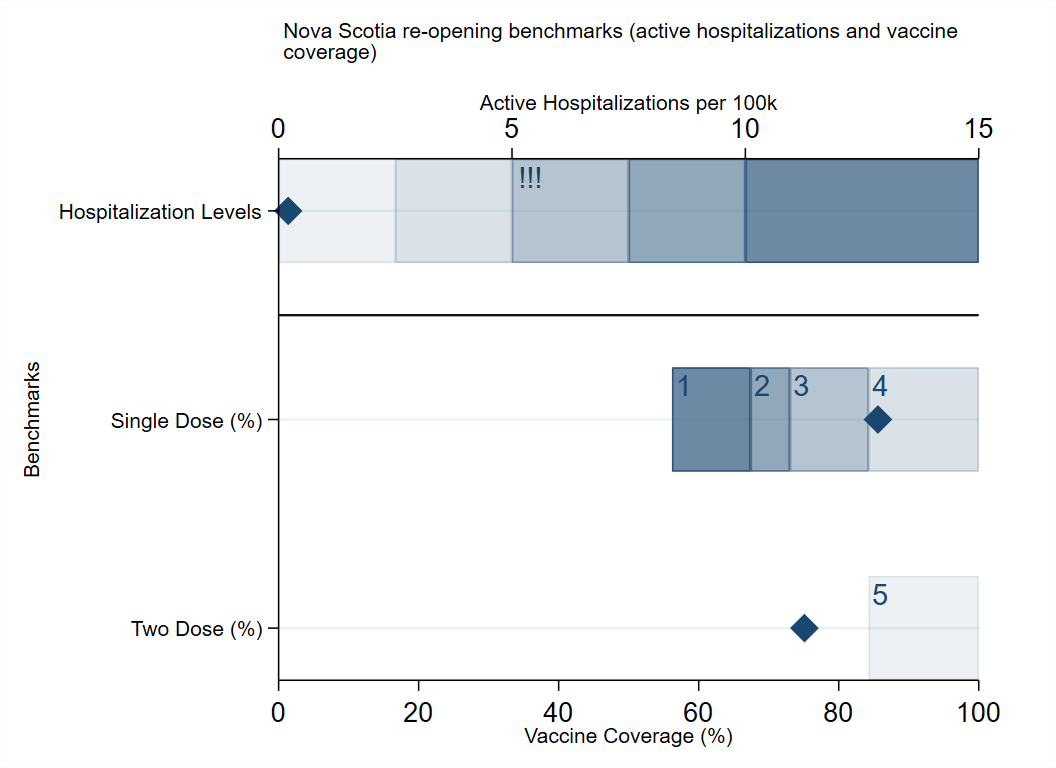
18* new cases were reported

11 in New Brunswick: 2 in Saint John (travel), 9 in Moncton (3 close contacts, 6 under investigation)

7* in Nova Scotia: 1 each in Western (travel) and Eastern (contact), and 5 in Halifax (all travel, 3 old/unreported) ImageImageImageImage
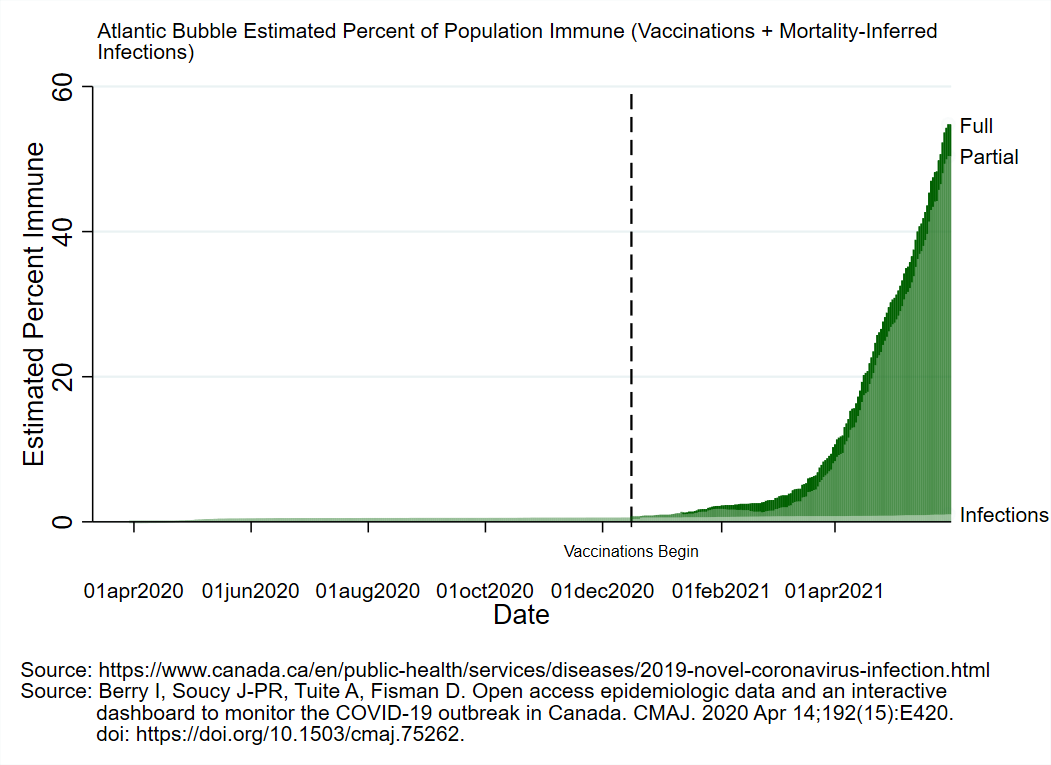
Regional Summary

Remains quiet save for the outbreak in the Moncton area.

Things still getting worse in Maine. Image
Zoom in on NB:

1st graph is case timeline for NB

2nd is cases per capita for all health regions with Moncton emphasized.

3rd is hospitalizations

4th is deaths ImageImageImageImage
Read 5 tweets
May 31, 2021
Today in the #AtlanticBubble

33 new cases were reported: 2 each in PEI, and Newfoundland and Labrador, 12 in New Brunswick, and 17 in Nova Scotia.

There are now 709 known, active cases in the region.
PEI reported 2 new cases today, both related to travel outside the region and both detected during routine testing in isolation.

There are now 14 known, active cases in PEI.
NL also reported 2 new cases today:

1 each in the Central (close contact) and Western (travel-related) health regions.

Neither new cases is connected to each region's respective clusters, both of which remain under investigation.

There are now 101 known, active cases in NL.
Read 23 tweets

Did Thread Reader help you today?

Support us! We are indie developers!


This site is made by just two indie developers on a laptop doing marketing, support and development! Read more about the story.

Become a Premium Member ($3/month or $30/year) and get exclusive features!

Become Premium

Don't want to be a Premium member but still want to support us?

Make a small donation by buying us coffee ($5) or help with server cost ($10)

Donate via Paypal

Or Donate anonymously using crypto!

Ethereum

0xfe58350B80634f60Fa6Dc149a72b4DFbc17D341E copy

Bitcoin

3ATGMxNzCUFzxpMCHL5sWSt4DVtS8UqXpi copy

Thank you for your support!

Follow Us!

:(