Epidemiologist. Housing maximalist. Local reviewer of bike routes in Halifax (HFX By Bike):
https://t.co/uTYUsk1cVG
Find me at https://t.co/hSiOP0zT3n


 The test positivity rate in the region was 0.3%
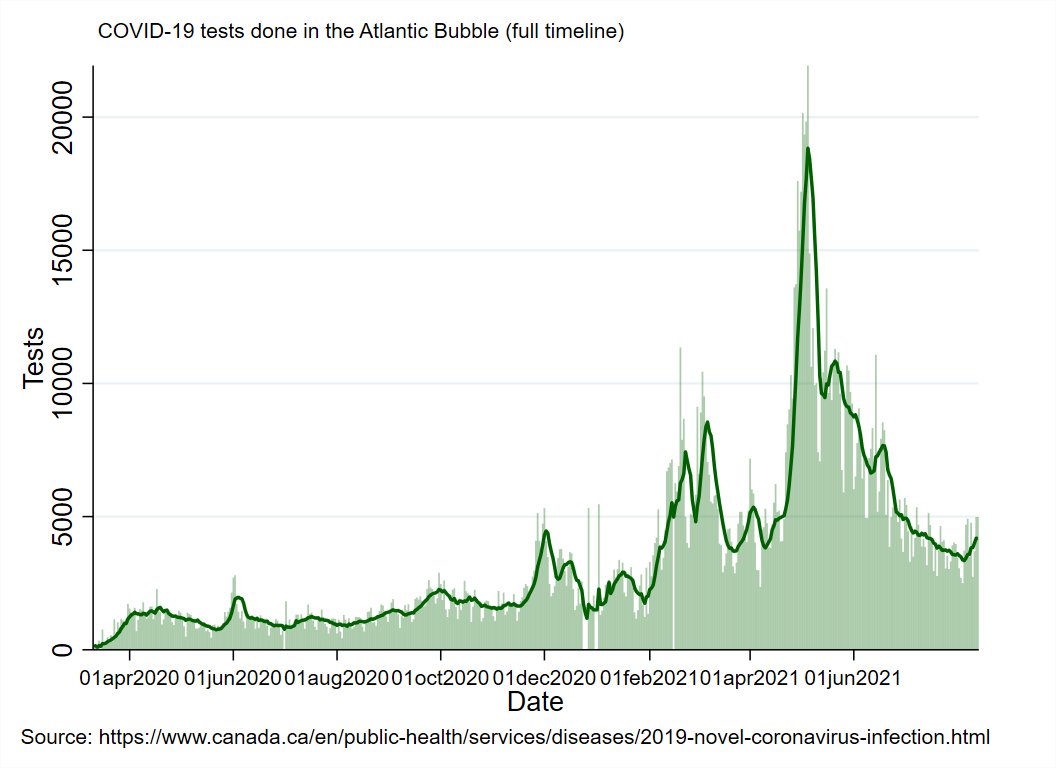


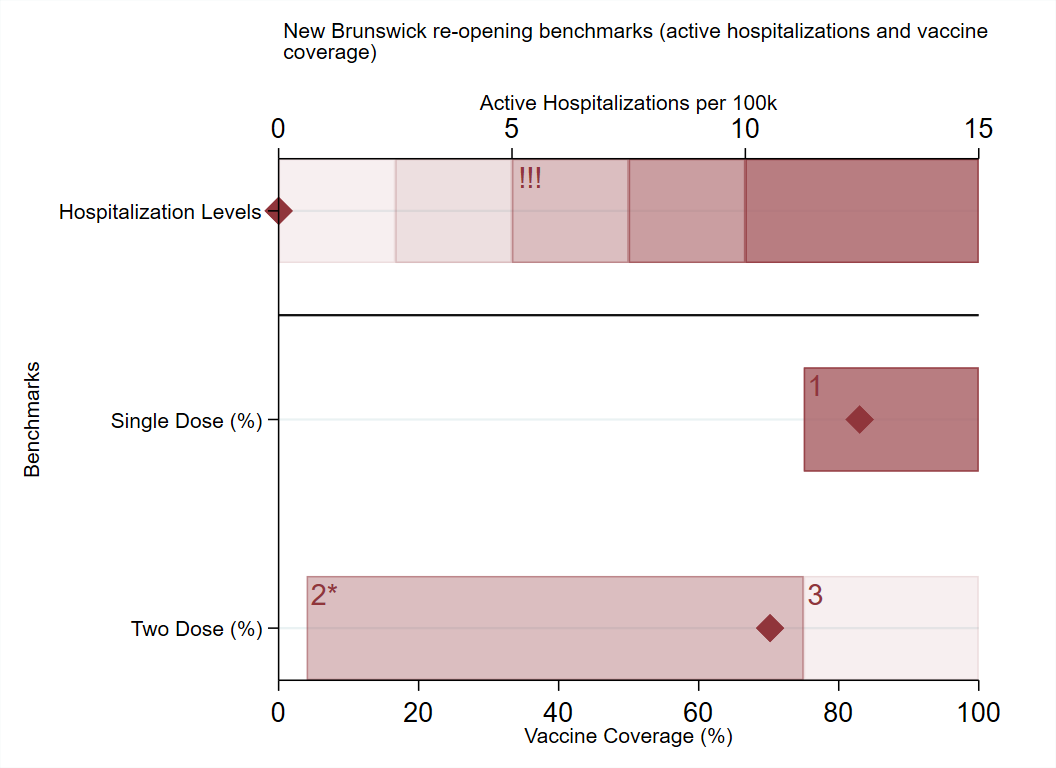
 New Brunswick reported 19 new cases:

 Regional Summary


 PEI reported 2 new cases today, both related to travel outside the region and both detected during routine testing in isolation.


 PEI didn't update their numbers today, leaving them with 12 known, active cases.


 It's the weekend, so I'm reporting test numbers.
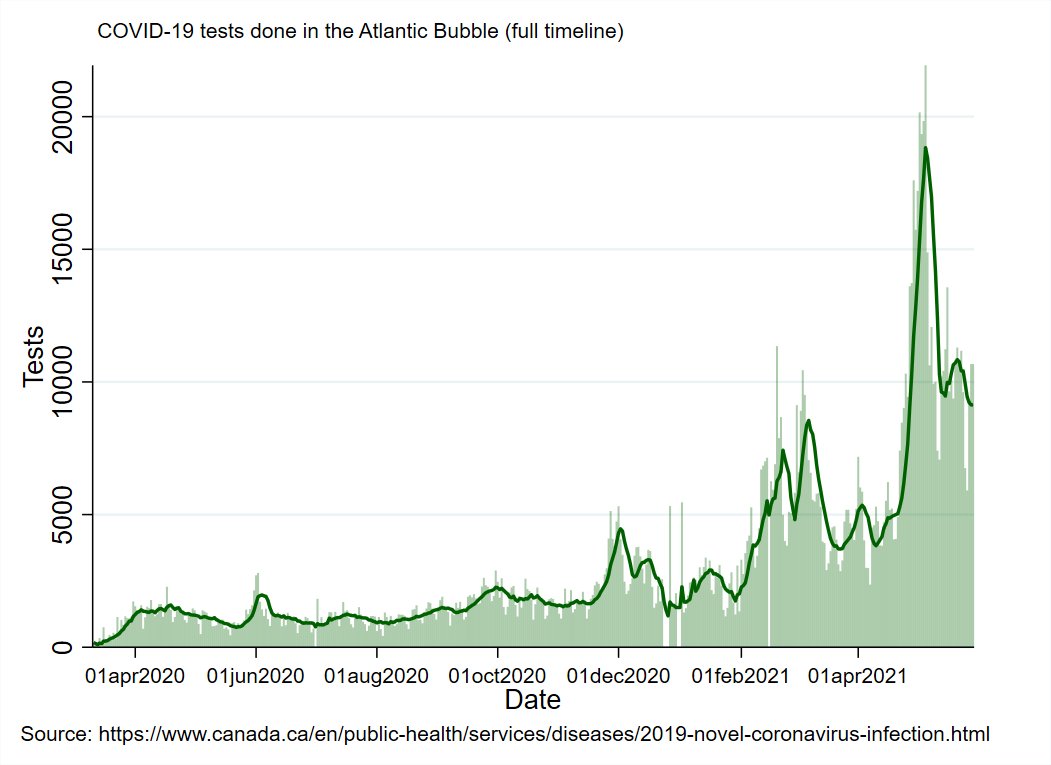

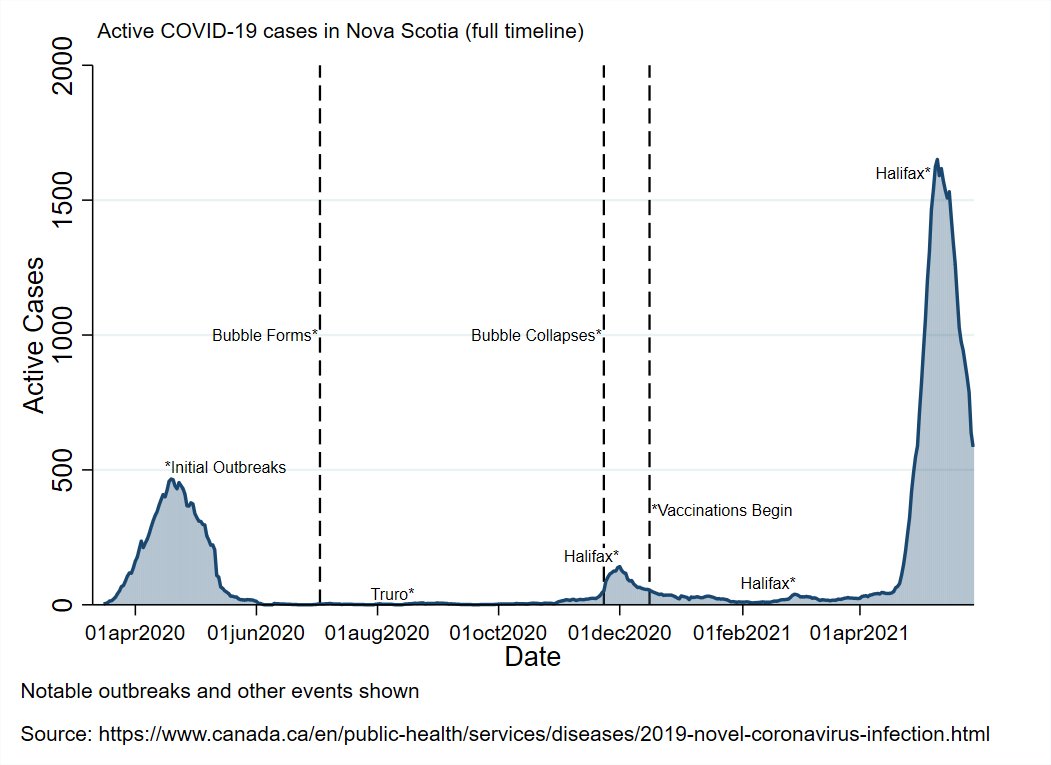


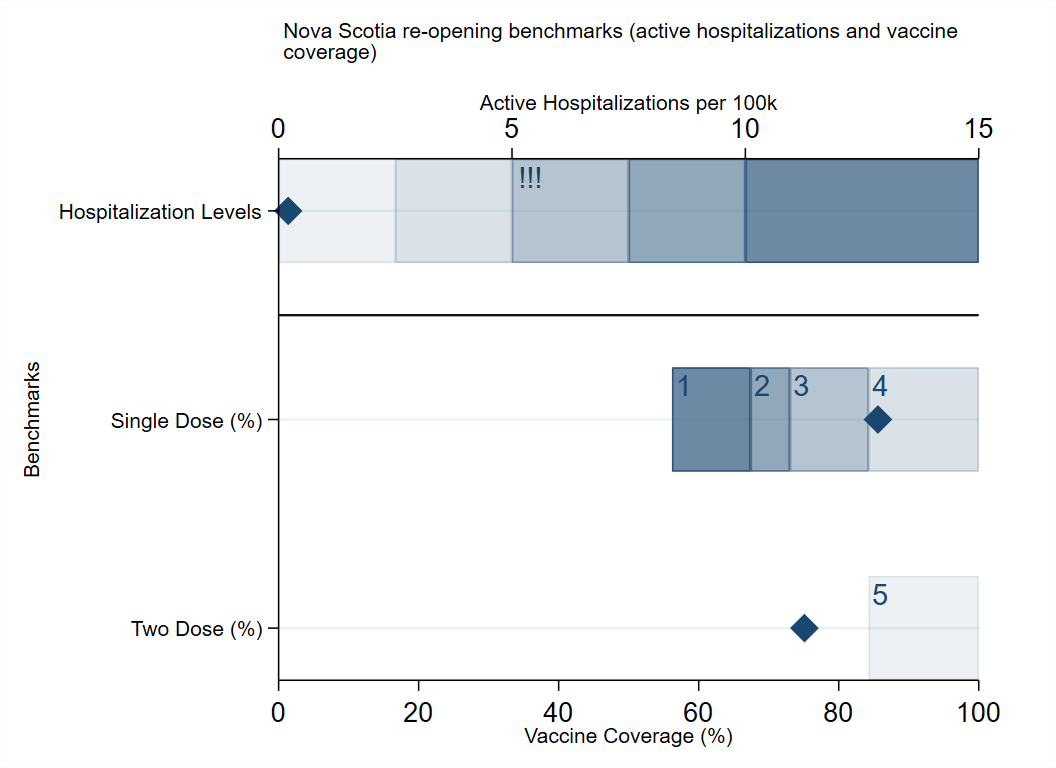
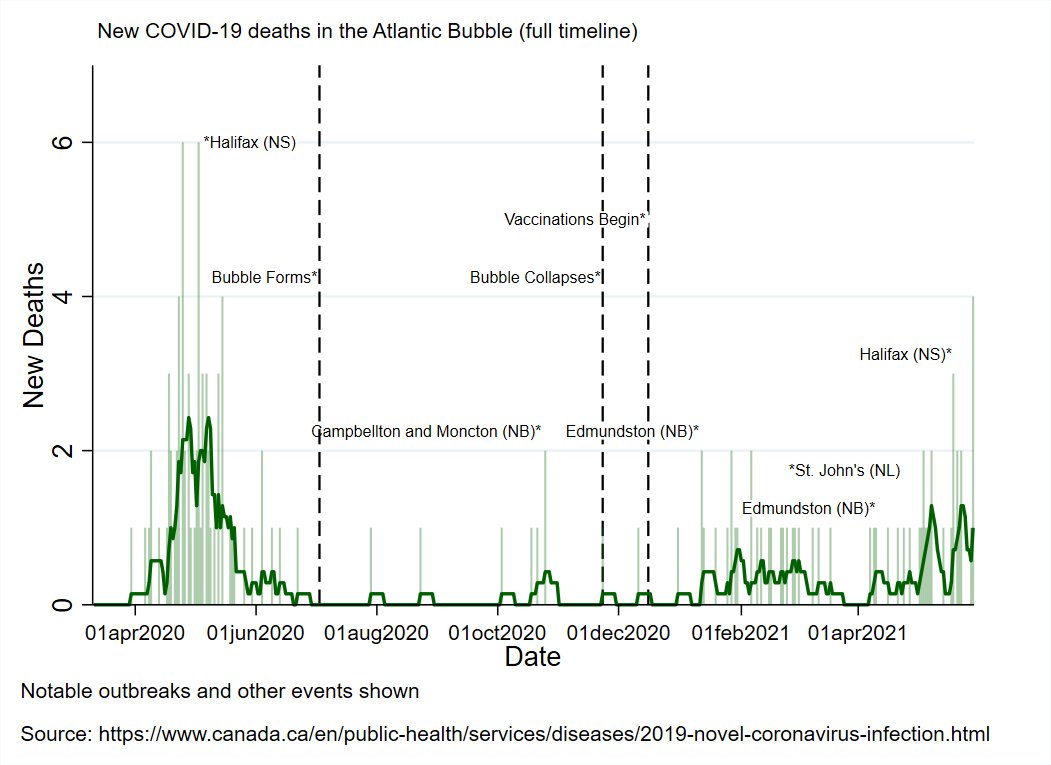
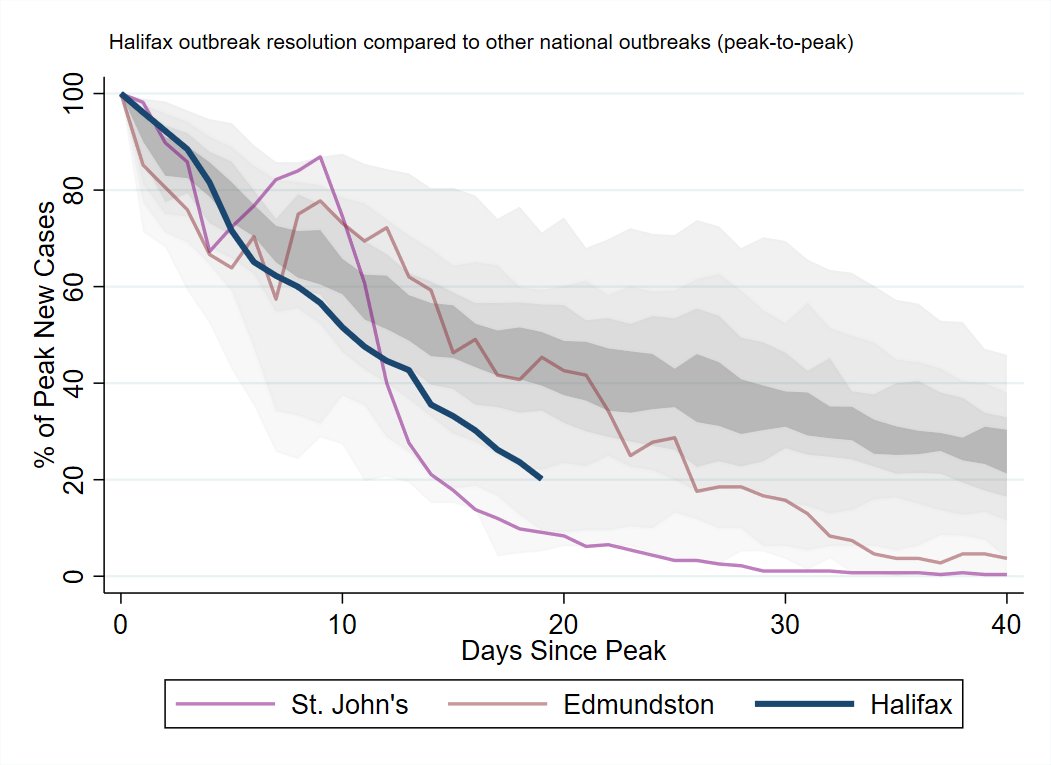
 NS Outbreak Detailed:


 PEI reported 2 new cases today:


 PEI reported now new cases today, but did announce their plan to wind-down their pandemic related restrictions in the coming weeks and months (more on that later).


 PEI reported 3 new cases today, all related to travel.


 PEI reported 3 new cases today, all related to travel.


 PEI didn't update their numbers today, leaving them with 7 known, active cases.


 You can see the geographic distribution (by US Census region) of cases across the entire pandemic timeline in this animation.


 It's the weekend, so I'm reporting on testing.
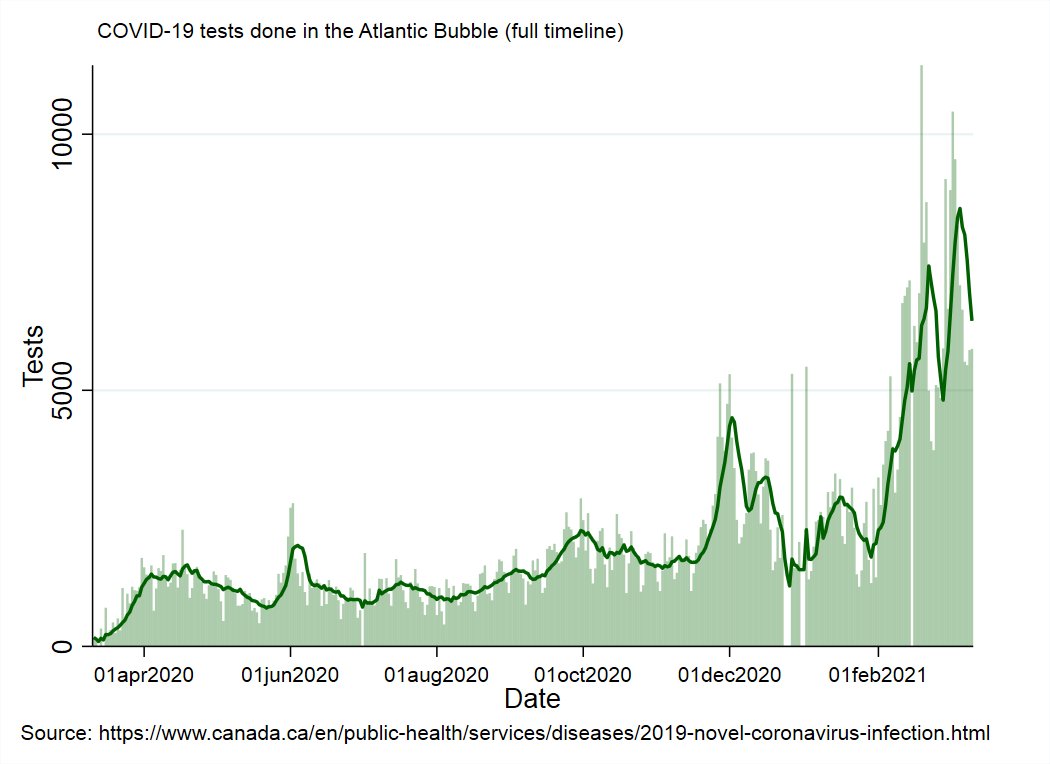


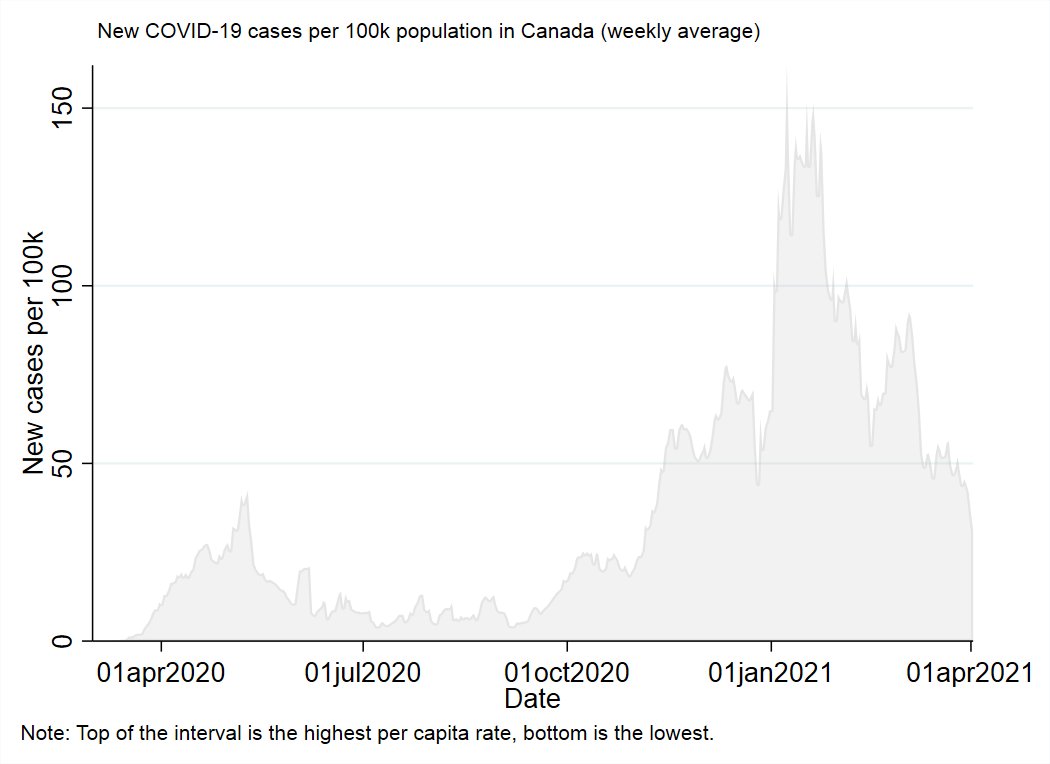
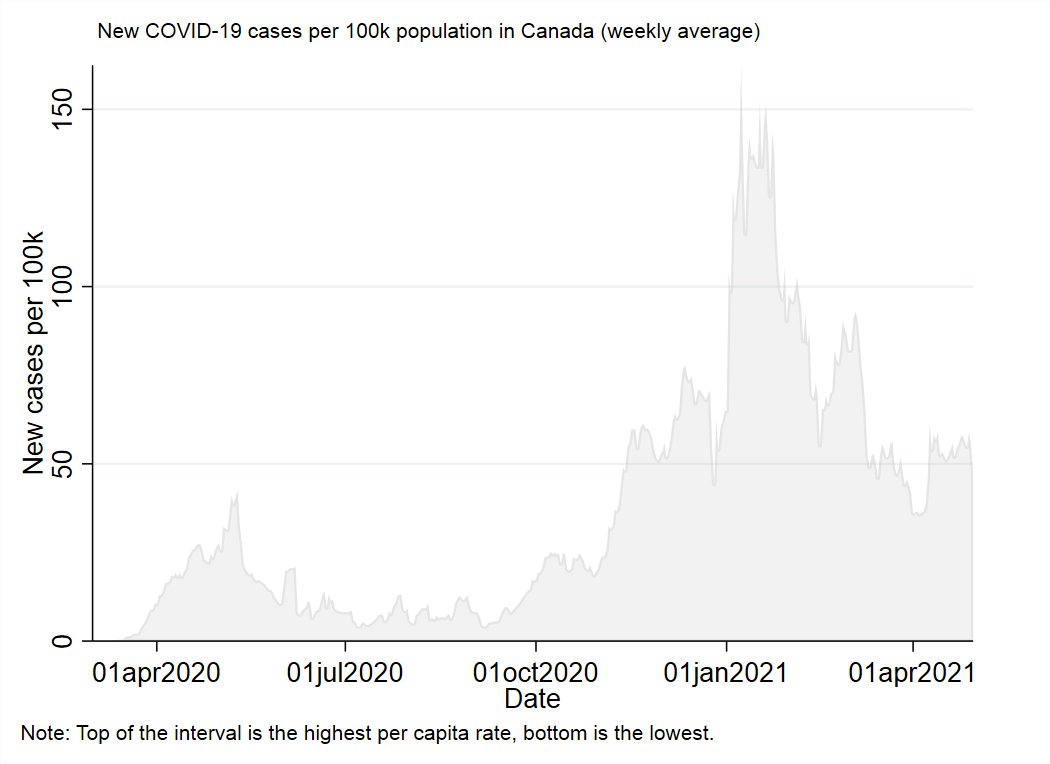
 This animation shows cases per capita for each US region and Canada.