Ian Johnson 🔬🤖 Profile picture
Apr 6, 2021 8 tweets 3 min read Read on X
I have shunned MATLAB for Python, I have sipped vintage FORTRAN 77 and published Java Applets at the turn of the millennium. I want to offer a grounded perspective on the benefits of doing science online.
As a Master's student in a newly formed Department of Scientific Computing I learned from applied mathematicians, physicists, materials scientists, biologists, geologists, statisticians and engineers. My program was a survey of computational methods and how to apply them.
I was quickly drawn to the discipline of scientific communication, entranced by the papers, talks and posters that were able to convey new and fascinating concepts to me as well as frustrated by those that... didn't.
I also learned that scientists use many different environments, often incompatible with and even incomprehensible to each other. Demonstrating a result was one thing, getting someone else to repeat that result on their machine was entirely another.
The reasons for any given scientist using any given environment were often great, it was where the existing toolset for the discipline was, it was where the compute was. But if you wanted to use an idea that came from somewhere else, well, good luck.
As computing infra has improved and standardized, the various scientific communities have come closer together. the state of the art in large scale computation has become much more cosmopolitan.

The state of scientific communication is still firmly in the grips of the PDF.
The web was born of the desire to share scientific knowledge, yet has remained a frontier for scientific communication for decades. It is often seen as the lowest common denominator of programming environments, and for this very reason it is also the most accessible.
stay tuned for the full talk with links to a bunch of examples #d3js 🔬💻

• • •

Missing some Tweet in this thread? You can try to force a refresh
 

Keep Current with Ian Johnson 🔬🤖

Ian Johnson 🔬🤖 Profile picture

Stay in touch and get notified when new unrolls are available from this author!

Read all threads

This Thread may be Removed Anytime!

PDF

Twitter may remove this content at anytime! Save it as PDF for later use!

Try unrolling a thread yourself!

how to unroll video
  1. Follow @ThreadReaderApp to mention us!

  2. From a Twitter thread mention us with a keyword "unroll"
@threadreaderapp unroll

Practice here first or read more on our help page!

More from @enjalot

Nov 22
I am obsessed with Sparse Autoencoders!

SAEs unpack so much existing value and unlock exciting new capabilities. It's happening in text, images and even proteins.

This is a long thread with lots of links and quote tweets of the projects, articles and code that made me 🤯
First of all, what is a Sparse Autoencoder (SAE)?

I really liked @a_karvonen's intuitive explanation here:


It's at a nice level of abstraction that gives a sense for how they work and what is exciting about them without going deep into training / math adamkarvonen.github.io/machine_learni…Image
One way to think about SAEs is that they are like a prism, they separate out concepts learned in a model into components that can be studied and manipulated.

@thesephist wrote a very accessible report on his experiments with SAEs at Notion

Read 18 tweets
Nov 1, 2022
recently download your twitter archive? want to explore your tweets with SQL? get visualizations of who your besties are over time?

then check out this notebook:
observablehq.com/@enjalot/twitt…

locally processes your tweets.js file (no uploading!) Image
with a little bit of processing we can easily load 10k+ tweets into a SQL database (DuckDB) for super fast queries Image
also easy to quickly make a searchable interface on top of some SQL results to visualize who you've been mentioning over time (and whether its tweets, retweets or replies) Image
Read 8 tweets
Jul 20, 2020
woah! today was my first day at @observablehq and I am so excited 😆

if you've followed me at all, you know this is a dream job: making it easier to use / play / think with #d3js will be a big part of my focus...

i mean, just look at this stuff! observablehq.com/@d3/gallery
I don't yet know exactly how this will manifest.

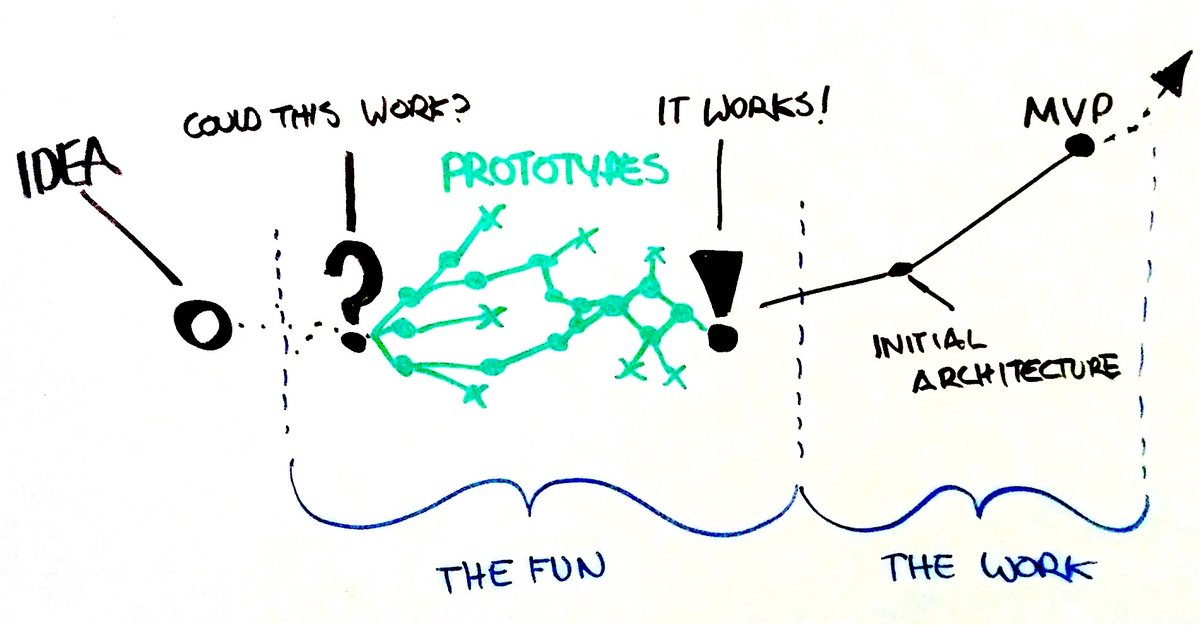
I drew this diagram 5 years ago about where I like to focus my energy in the product development process.

@observablehq notebooks basically let me stay in "the fun" all the time...

but the definition of fun is relative!
when I first started learning #d3js I banged my head against the wall for 2 reasons:
1) I didn't understand the browser (DOM, JS, CSS etc.)
2) I didn't know how to think with d3: declaratively and data-driven.

Once I got a handle on these 2, the power (and the fun) came out...
Read 5 tweets
Apr 28, 2020
I remember when AJAX was the new hotness in 2005 (it had been in IE for 6 years at that point). IE6 still mattered. git was just invented. there were magazines about code.

Your struggle is real, here is a thread on why I think it's all gonna be ok.
This thread is not a personal response to the OP but an attempt to share my perspective with the community.

Anyway, the reality certainly is that there are a ton of ways to build things, and constantly adding more. It can be hard to see where the fundamentals are underneath.
I did nothing but #reactjs for a solid year in 2015. I didn't really touch it again until a month ago.

It felt like nothing changed in 5 years, because fundamentally nothing did.
Read 19 tweets
Dec 16, 2019
24. when I do datavis I iterate a lot and explore the space of both the data as well as the space of possible representations. mostly that means drawing a lot of small rectangles and seeing if anything pops out
25. t-sne, UMAP and dimensionality reduction will make that process much more fun and interesting
26. navigating, collecting and annotating representation spaces is a key challenge to tackle right now, as it's already a nexus for ML & vis
Read 80 tweets
Dec 16, 2019
love reading the threads, want to challenge myself:

Machine Learning <-> Data visualization

1 like = 1 opinion
1. all data is subjective.

data are measurements of systems taken by particular people from a particular perspective
2. the future of data visualization is machine learning.
Read 23 tweets

Did Thread Reader help you today?

Support us! We are indie developers!


This site is made by just two indie developers on a laptop doing marketing, support and development! Read more about the story.

Become a Premium Member ($3/month or $30/year) and get exclusive features!

Become Premium

Don't want to be a Premium member but still want to support us?

Make a small donation by buying us coffee ($5) or help with server cost ($10)

Donate via Paypal

Or Donate anonymously using crypto!

Ethereum

0xfe58350B80634f60Fa6Dc149a72b4DFbc17D341E copy

Bitcoin

3ATGMxNzCUFzxpMCHL5sWSt4DVtS8UqXpi copy

Thank you for your support!

Follow Us!

:(