Ian Johnson πŸ’»πŸ”₯ Profile picture
πŸ“ŠπŸ“ˆ @observablehq πŸŽ₯πŸŽ‡ https://t.co/wnTOSnVApZ πŸ’»πŸ”₯ https://t.co/CZTmOpdDBQ πŸ’½πŸ’Ύ @google, @lever
Nov 1, 2022 β€’ 8 tweets β€’ 4 min read
recently download your twitter archive? want to explore your tweets with SQL? get visualizations of who your besties are over time?

then check out this notebook:
observablehq.com/@enjalot/twitt…

locally processes your tweets.js file (no uploading!) Image with a little bit of processing we can easily load 10k+ tweets into a SQL database (DuckDB) for super fast queries Image
Apr 6, 2021 β€’ 8 tweets β€’ 3 min read
I have shunned MATLAB for Python, I have sipped vintage FORTRAN 77 and published Java Applets at the turn of the millennium. I want to offer a grounded perspective on the benefits of doing science online. As a Master's student in a newly formed Department of Scientific Computing I learned from applied mathematicians, physicists, materials scientists, biologists, geologists, statisticians and engineers. My program was a survey of computational methods and how to apply them.
Jul 20, 2020 β€’ 5 tweets β€’ 4 min read
woah! today was my first day at @observablehq and I am so excited πŸ˜†

if you've followed me at all, you know this is a dream job: making it easier to use / play / think with #d3js will be a big part of my focus...

i mean, just look at this stuff! observablehq.com/@d3/gallery I don't yet know exactly how this will manifest.

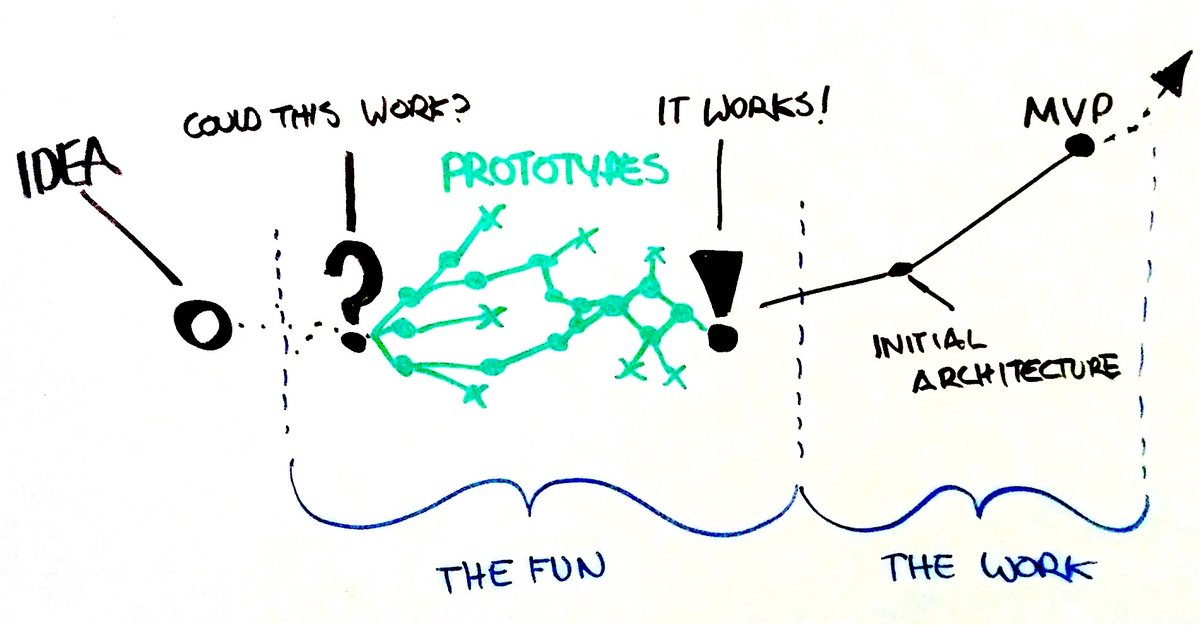
I drew this diagram 5 years ago about where I like to focus my energy in the product development process.

@observablehq notebooks basically let me stay in "the fun" all the time...

but the definition of fun is relative!
Apr 28, 2020 β€’ 19 tweets β€’ 4 min read
I remember when AJAX was the new hotness in 2005 (it had been in IE for 6 years at that point). IE6 still mattered. git was just invented. there were magazines about code.

Your struggle is real, here is a thread on why I think it's all gonna be ok. This thread is not a personal response to the OP but an attempt to share my perspective with the community.

Anyway, the reality certainly is that there are a ton of ways to build things, and constantly adding more. It can be hard to see where the fundamentals are underneath.
Dec 16, 2019 β€’ 80 tweets β€’ 16 min read
24. when I do datavis I iterate a lot and explore the space of both the data as well as the space of possible representations. mostly that means drawing a lot of small rectangles and seeing if anything pops out 25. t-sne, UMAP and dimensionality reduction will make that process much more fun and interesting
Dec 16, 2019 β€’ 23 tweets β€’ 3 min read
love reading the threads, want to challenge myself:

Machine Learning <-> Data visualization

1 like = 1 opinion 1. all data is subjective.

data are measurements of systems taken by particular people from a particular perspective
Mar 6, 2018 β€’ 7 tweets β€’ 5 min read
Beyond excited to share the latest @distillpub article: Building Blocks of Interpretability
distill.pub/2018/building-…
An epic collaboration with @ch402 @arvindsatya1 @shancarter @ludwigschubert @hypotext and @zzznah introducing exciting techniques for looking deeper into ML models The amazing @TwoMinutePapers released a great summary video of the article:


You can also get a high level overview of the concepts from the @nytimes
nytimes.com/2018/03/06/tec…