MASTER-CLASS on Finding Alt-coin Entries.
Research, Enter, HODL and trade the break-out.
A thread.
Please share if you find this useful. 💯💯
Research, Enter, HODL and trade the break-out.
A thread.
Please share if you find this useful. 💯💯

My Criteria of Choosing a coin.
1. MUST have a product/ service ready.
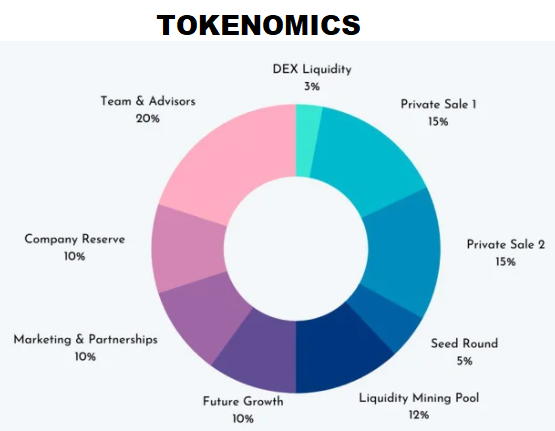
2. Fair distribution and Tokenomics.
3. Pre-sale/early investors must be vesting.
4. Founders must be either public OR have a big community if anonymous.
5. Working website with history.
6. No volume bots.
1. MUST have a product/ service ready.
2. Fair distribution and Tokenomics.
3. Pre-sale/early investors must be vesting.
4. Founders must be either public OR have a big community if anonymous.
5. Working website with history.
6. No volume bots.
To trade or to HOLD?
If you're going to trade, I have made a lot of strategies already, available at
(Look at the bottom. Open mobile if it doesn't open)
If you're looking to hold, We will discuss
1. When to enter for holding.
2. When to enter.t.me/EmperorbtcTA/2…
If you're going to trade, I have made a lot of strategies already, available at
(Look at the bottom. Open mobile if it doesn't open)
If you're looking to hold, We will discuss
1. When to enter for holding.
2. When to enter.t.me/EmperorbtcTA/2…
After FA as mentioned in the above, We begin to find the entry.
I USE ONLY CHARTS to find the entry.
Jack D. Schwager has mentioned many times how he only uses TA to find entry for his investments.
We discussed in detail in 'Introduction to TA' how chart is all you need.
I USE ONLY CHARTS to find the entry.
Jack D. Schwager has mentioned many times how he only uses TA to find entry for his investments.
We discussed in detail in 'Introduction to TA' how chart is all you need.

Strategy for HODL entry.
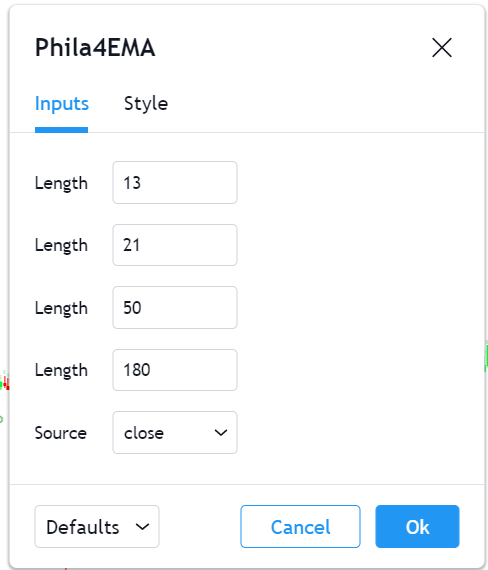
1. 13,21,50,180 EMA Cross.
2. Volume around the Cross.
3. EMA squeeze before the Cross.
4. Enter on Breakout candle crossing the high of previous candle.
5. Volume must increase after EMA Cross breakout.
6. Better if Breakout candle is an engulfing.
1. 13,21,50,180 EMA Cross.
2. Volume around the Cross.
3. EMA squeeze before the Cross.
4. Enter on Breakout candle crossing the high of previous candle.
5. Volume must increase after EMA Cross breakout.
6. Better if Breakout candle is an engulfing.
I am sharing the settings for the EMA here.
Time Frame- Daily Chart.
Time Frame- Daily Chart.

The Cross.
We are looking for a bullish cross of the
13,21,50 and the 180 EMA. These are my personal settings and can be tweaked by anyone. But this is what I use.
The 13 (RED) has to be above 21(Green), and so forth with 50 (Blue) and 180 (Black)
*Candles hidden for clarity.
We are looking for a bullish cross of the
13,21,50 and the 180 EMA. These are my personal settings and can be tweaked by anyone. But this is what I use.
The 13 (RED) has to be above 21(Green), and so forth with 50 (Blue) and 180 (Black)
*Candles hidden for clarity.

VOLUME.
This doesn't always occur because very few people use this technique, but while the whales accumulate, you can see a little increase in volume.
If a clear volume change occurs, it means the break-out has a higher probability.
Illustrated below.
This doesn't always occur because very few people use this technique, but while the whales accumulate, you can see a little increase in volume.
If a clear volume change occurs, it means the break-out has a higher probability.
Illustrated below.

The Squeeze.
It means the MAs coming closer, illustrating an accumulation. This can suggest a change in trend in either direction.
If the volume is increasing during squeeze, it is most likes bullish.
The Volume also must carry through after the break-out.
It means the MAs coming closer, illustrating an accumulation. This can suggest a change in trend in either direction.
If the volume is increasing during squeeze, it is most likes bullish.
The Volume also must carry through after the break-out.
The Entry.
This is where true edge comes in play.
The entry edge can only be gained with experience, failure and a lot of trying.
Here are two entry options below.
The risky entry is when the candle next to the engulfing cross the engulfing candle's high.
This is where true edge comes in play.
The entry edge can only be gained with experience, failure and a lot of trying.
Here are two entry options below.
The risky entry is when the candle next to the engulfing cross the engulfing candle's high.

Here is an example of how it works.
PLEASE note.
1. Use volume for entry.
2. Use PA for confirmation.
3. This is not fool proof but gets better with experience.
The exit has been done as one of the EMAs turns bearish.
PLEASE note.
1. Use volume for entry.
2. Use PA for confirmation.
3. This is not fool proof but gets better with experience.
The exit has been done as one of the EMAs turns bearish.

Conclusion.
1. Wait for EMA squeeze.
2. Look for volume on Accumulation.
3. Find Cup and handle or rounding bottoms.
4. Use PA for Confirmation.
5. Exit on bearish cross-over.
1. Wait for EMA squeeze.
2. Look for volume on Accumulation.
3. Find Cup and handle or rounding bottoms.
4. Use PA for Confirmation.
5. Exit on bearish cross-over.
This is my strategy of Buying Alts for the short terms.
It's simple and it works. I am in MANY alt positions right now with this tool.
This is for HODL, I will share Alt swing trading tutorial soon.
It's simple and it works. I am in MANY alt positions right now with this tool.
This is for HODL, I will share Alt swing trading tutorial soon.
A request-
PLEASE try it on as many charts as possible and share below if you find the above set-up in play on any coin.
Kindly share it if you liked the thread, it might help someone.
ALL THE BEST.
Follow this link for more strategies.
t.me/EmperorbtcTA/2…
PLEASE try it on as many charts as possible and share below if you find the above set-up in play on any coin.
Kindly share it if you liked the thread, it might help someone.
ALL THE BEST.
Follow this link for more strategies.
t.me/EmperorbtcTA/2…
• • •
Missing some Tweet in this thread? You can try to
force a refresh