
@stellensatz @Sandeep_1966 @Ashutos61 @shekhar_mande Starting a separate thread on district level predictions. The predicted trajectories do not match as well as for states because of smaller population.
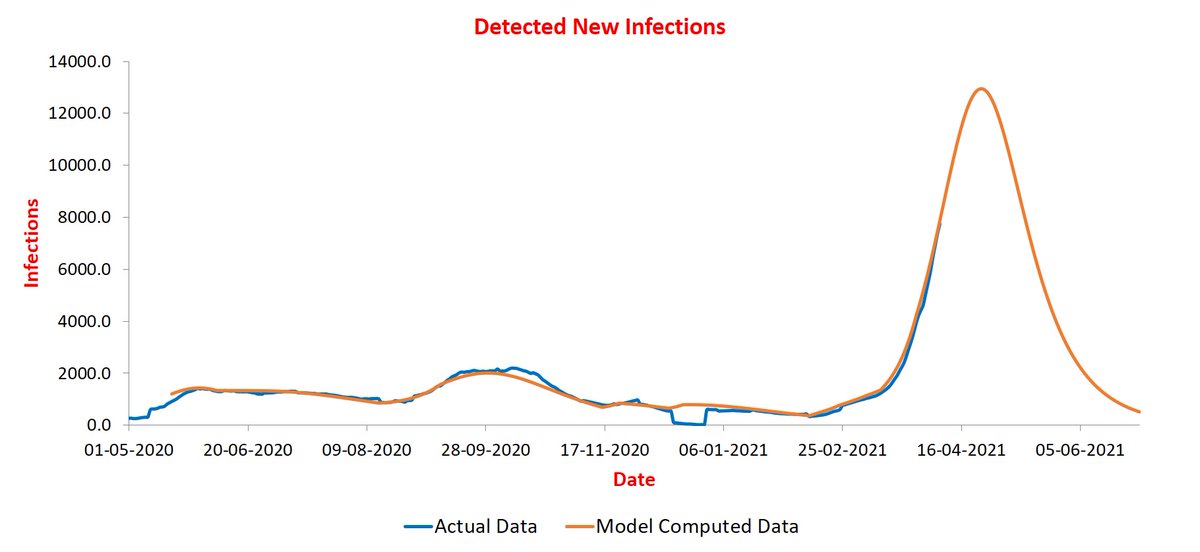
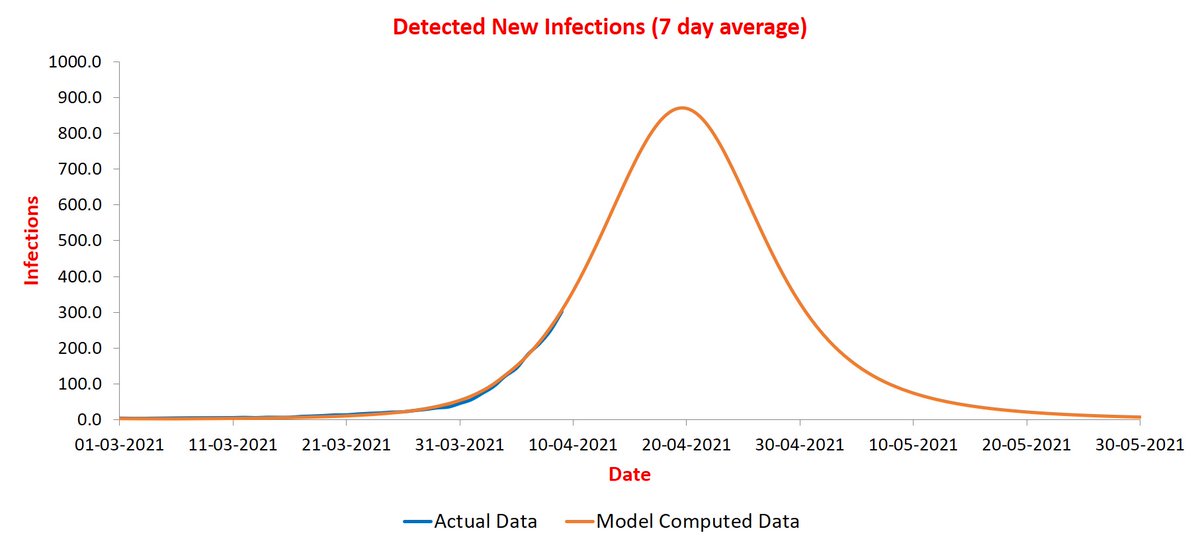
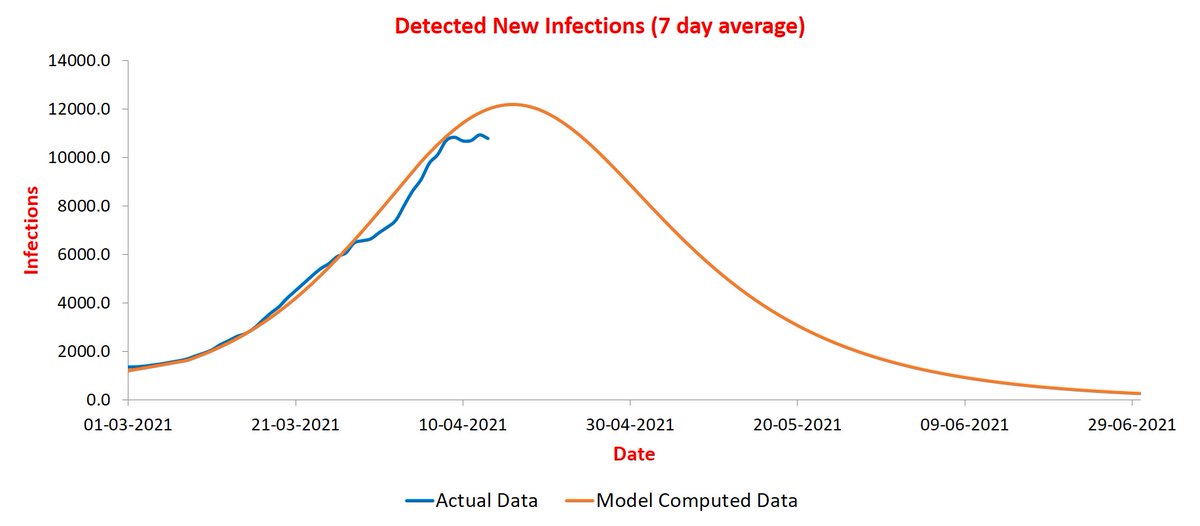
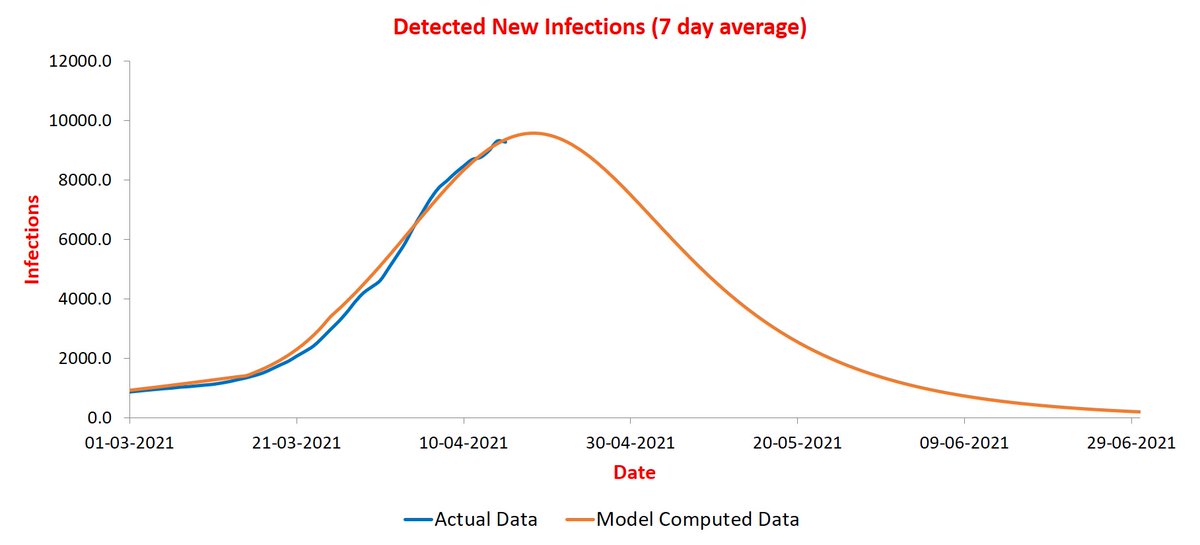
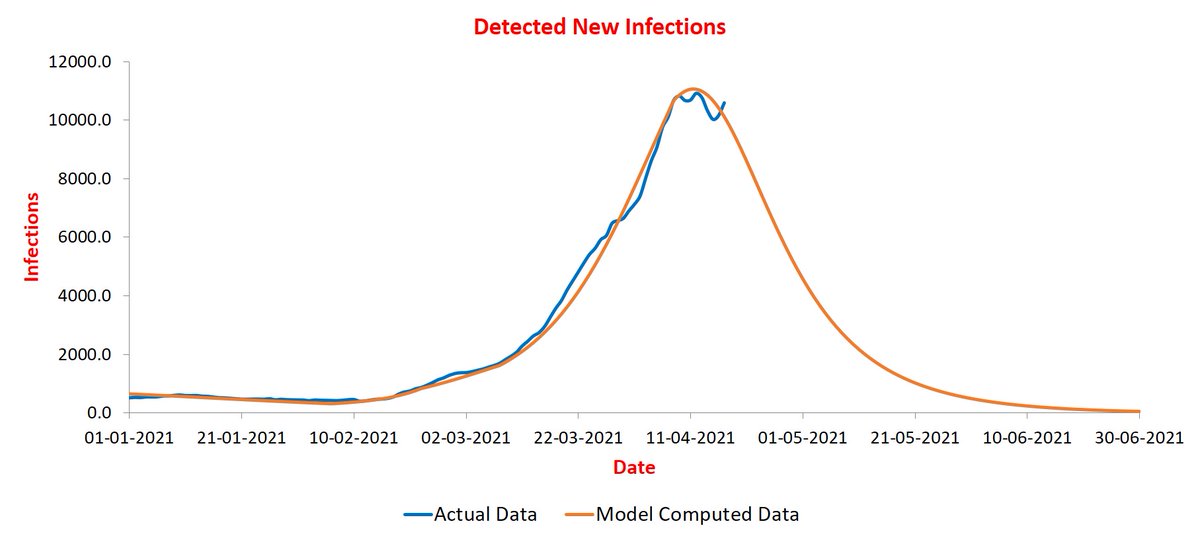
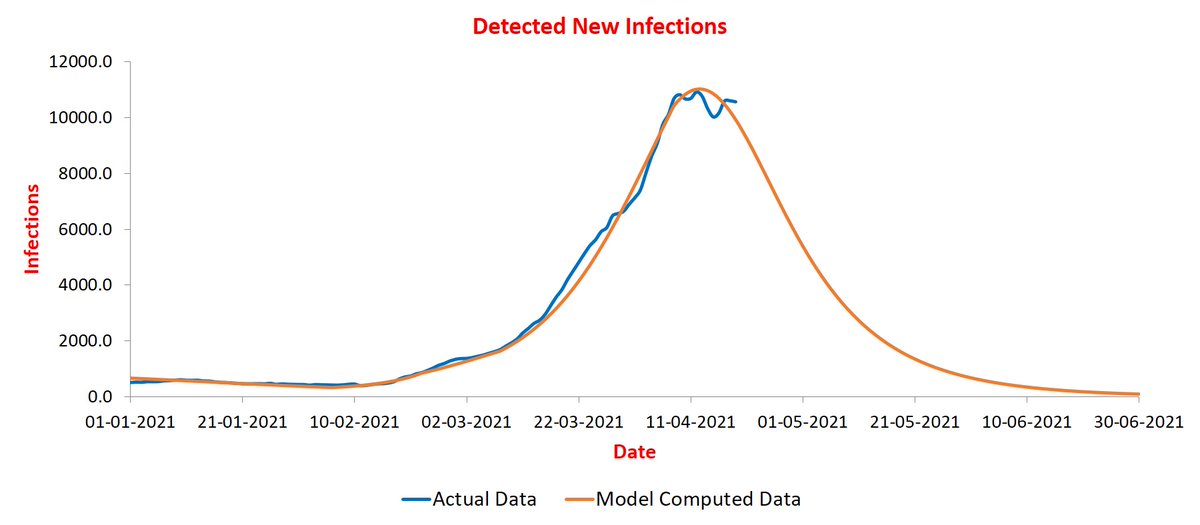
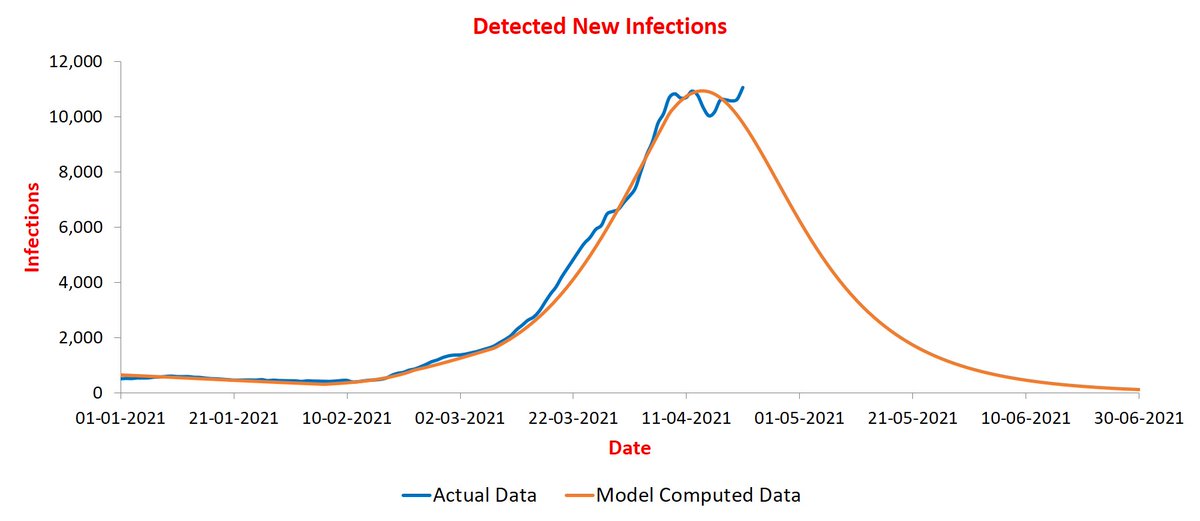
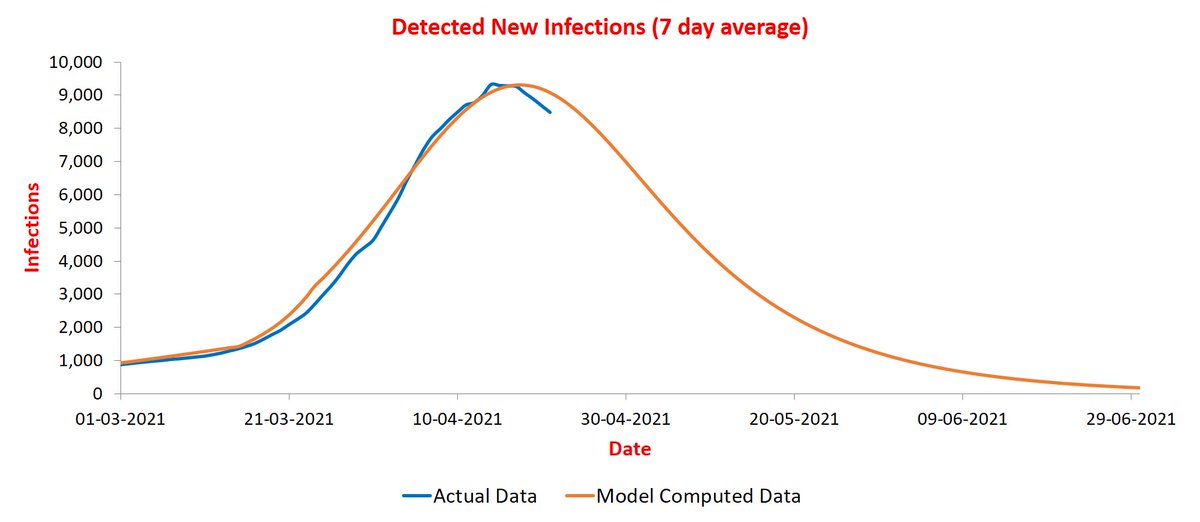
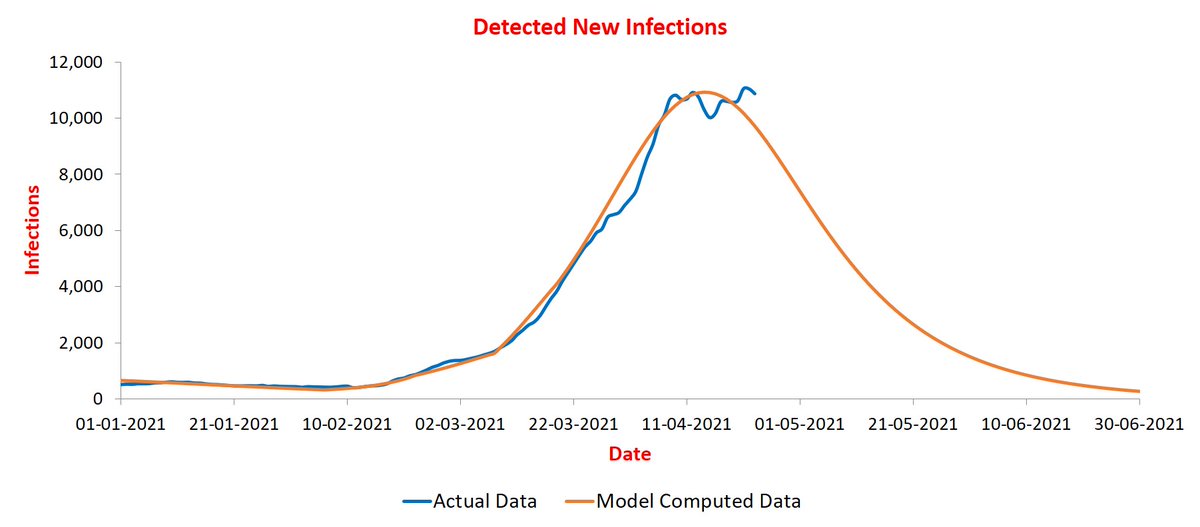
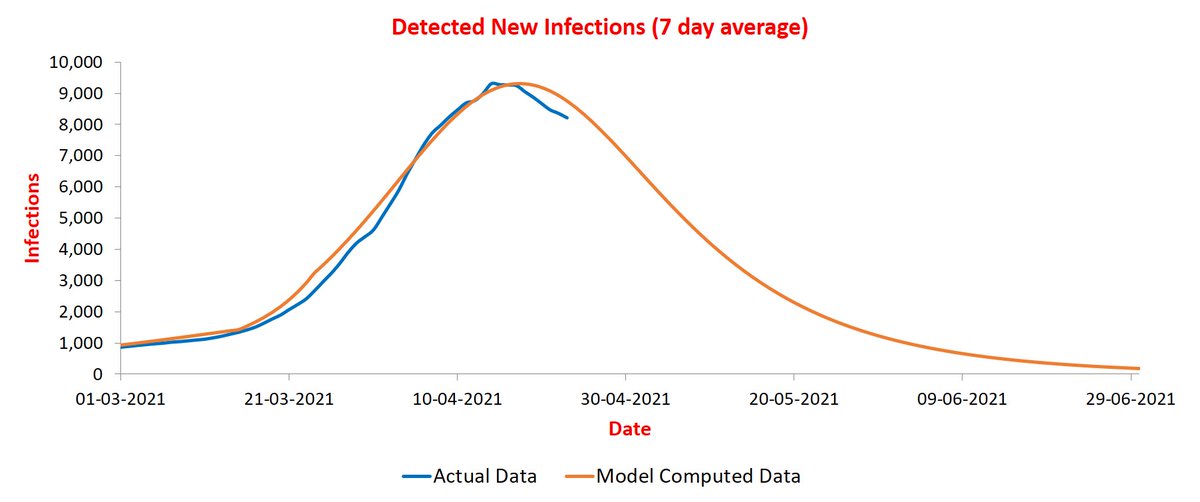
Let us start with Pune -- it was earlier posted on thread on states. It remains on track to peak during April 12-15 at around 11.5K infections/day. 

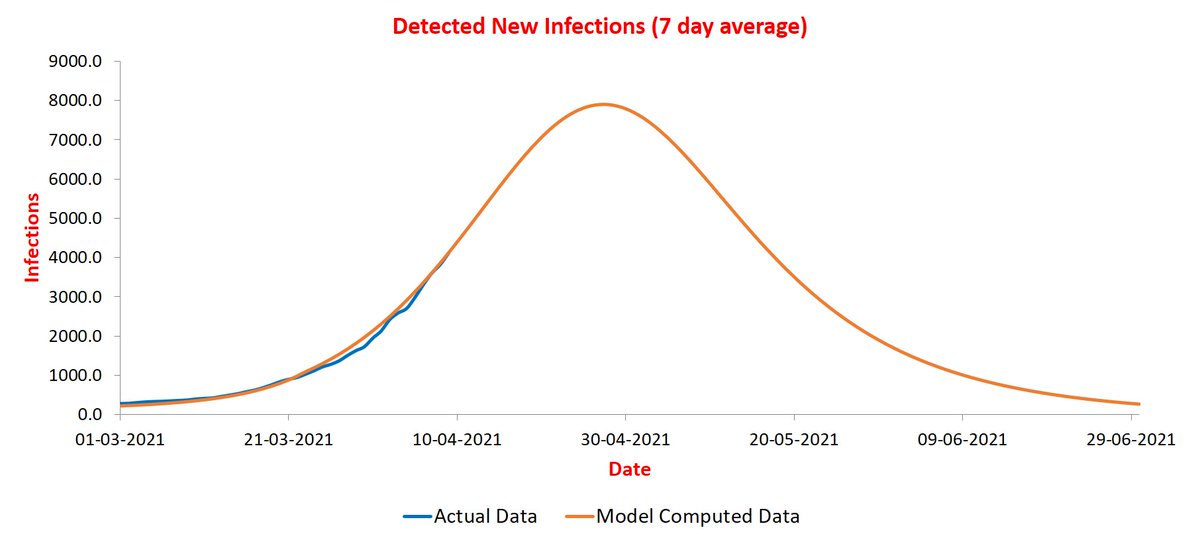
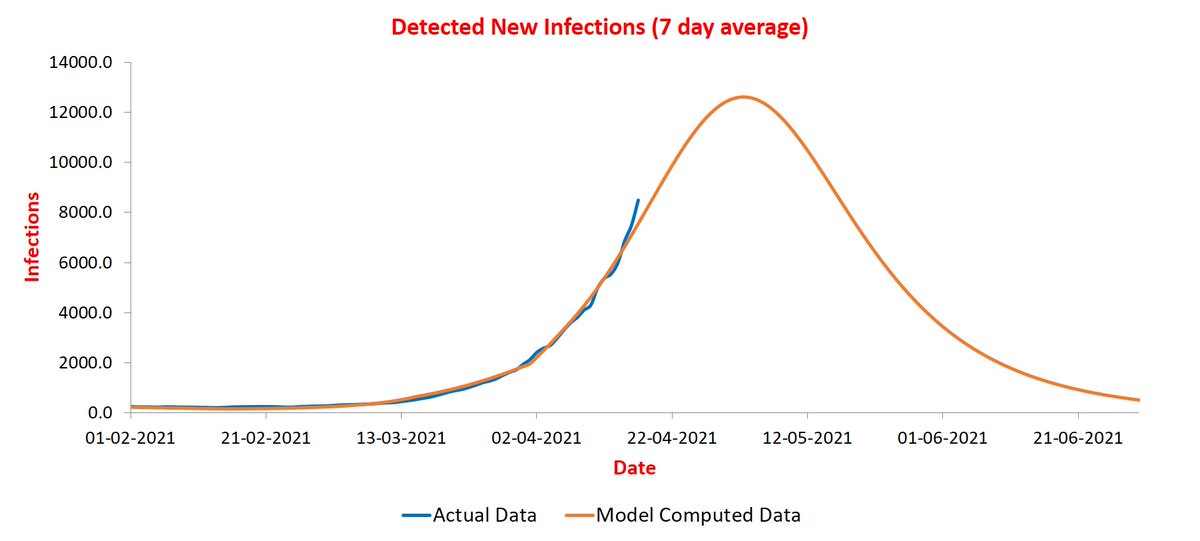
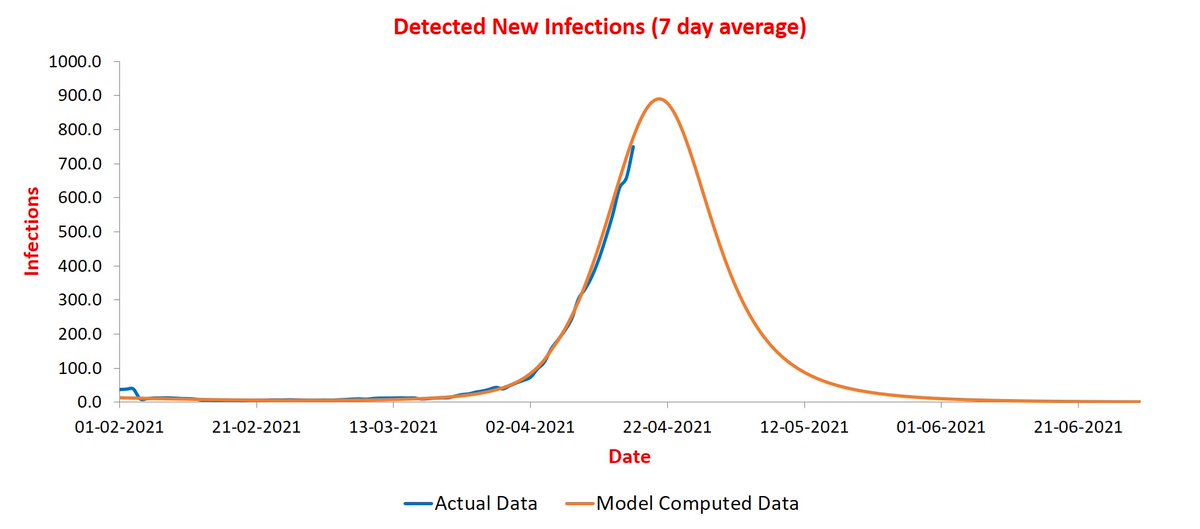
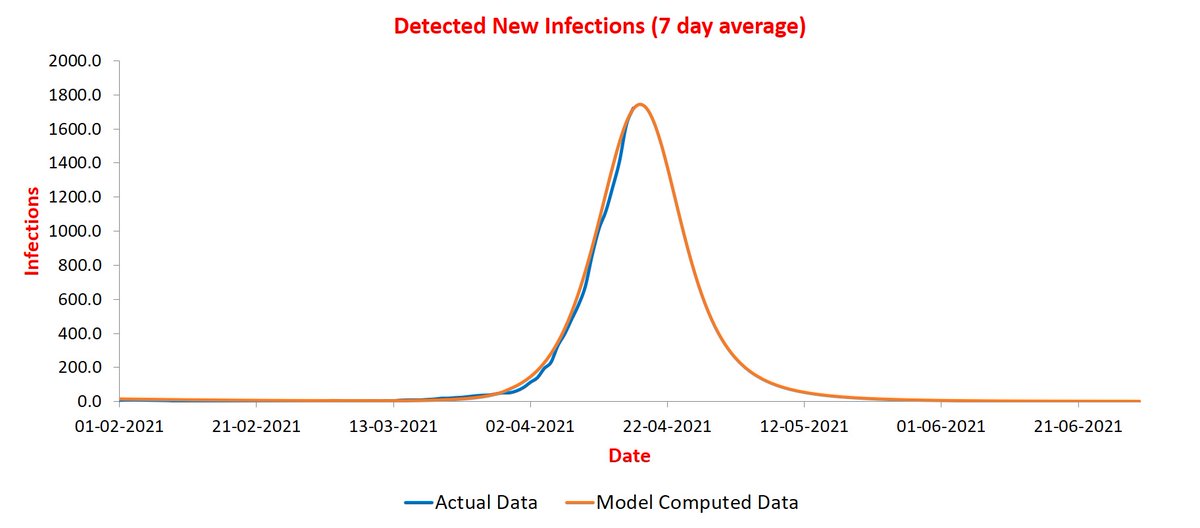
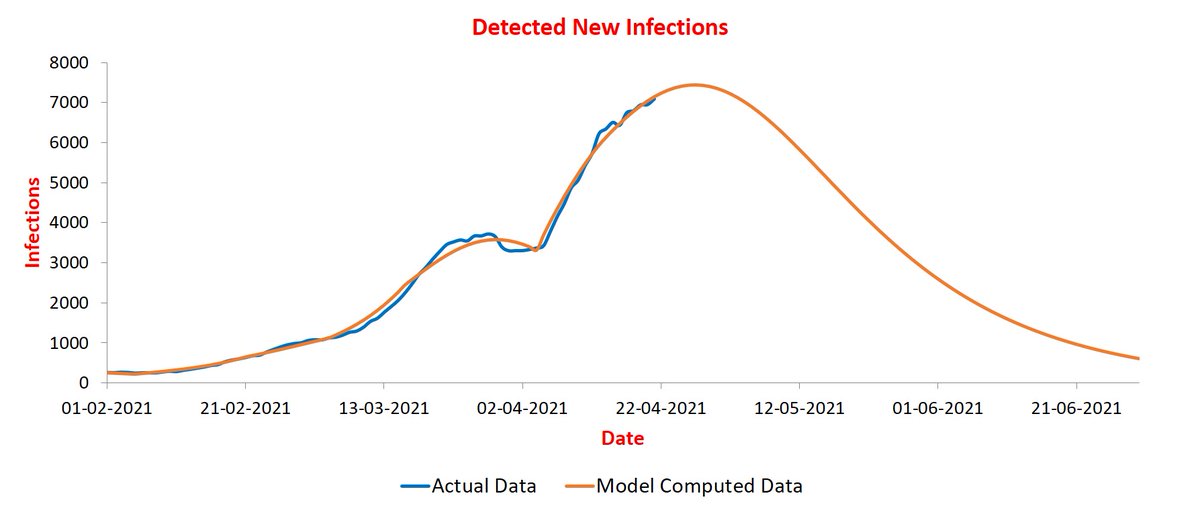
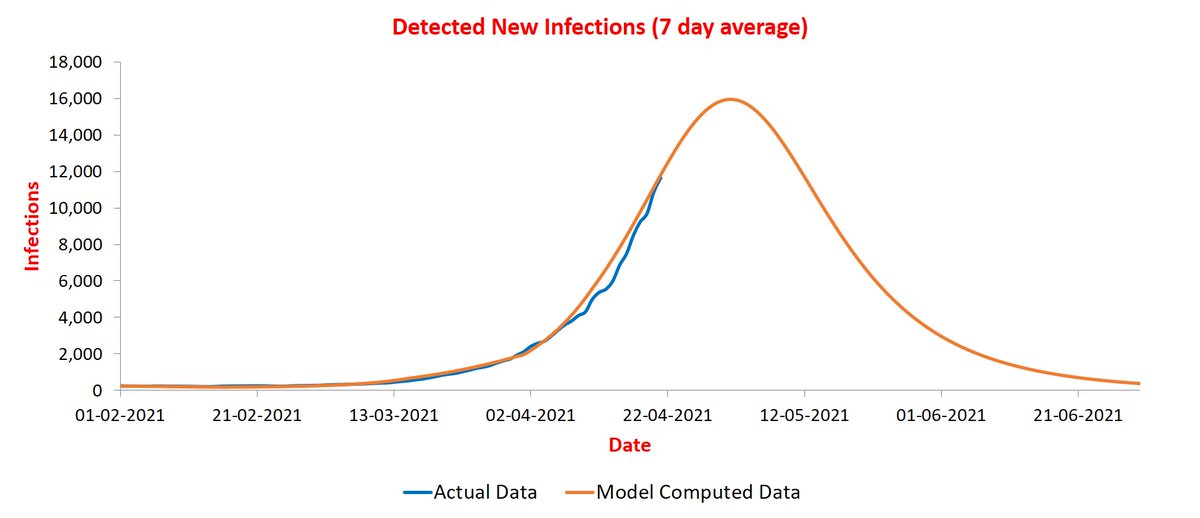
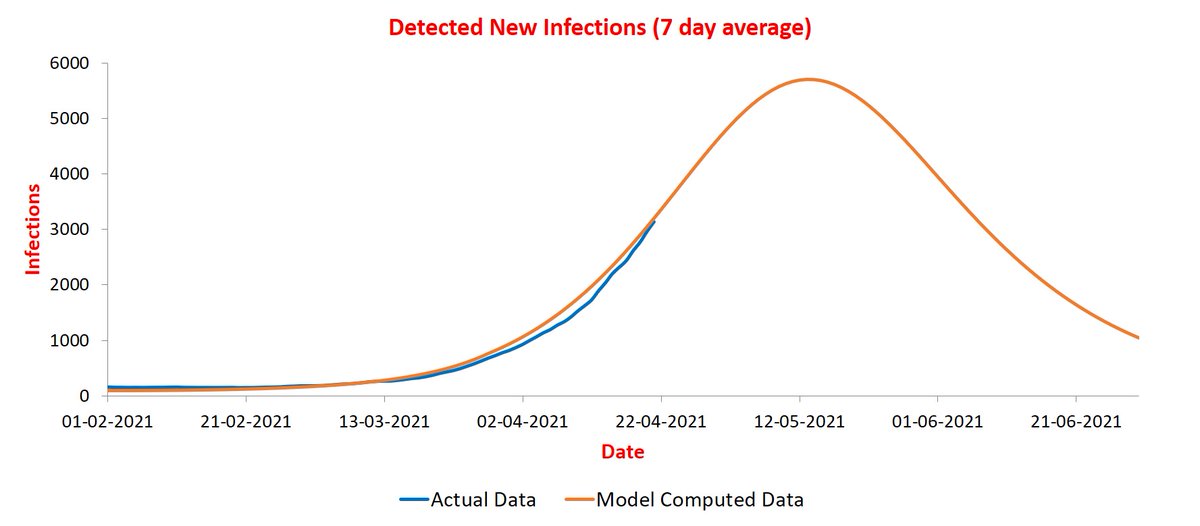
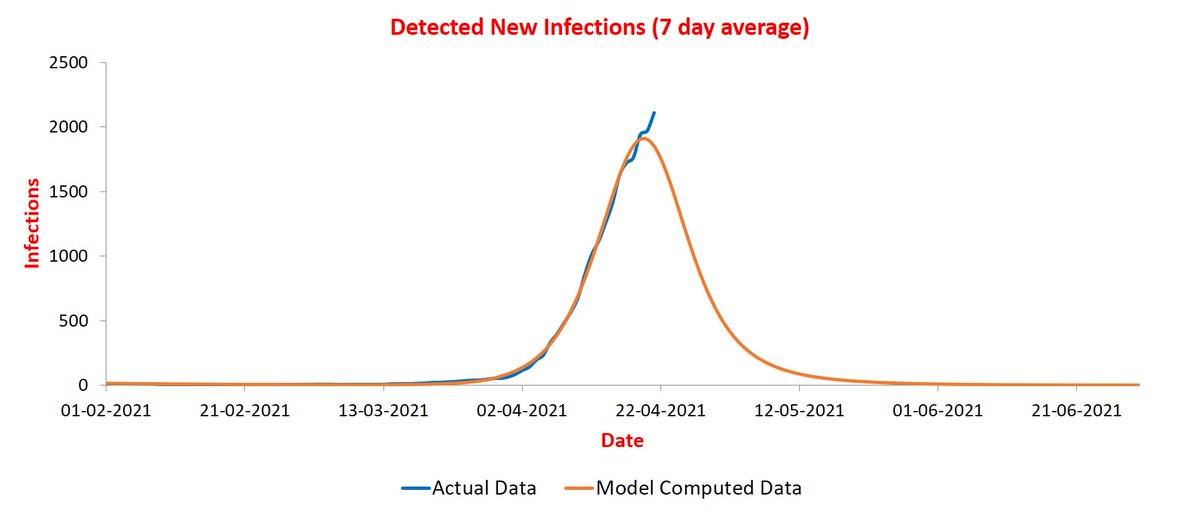
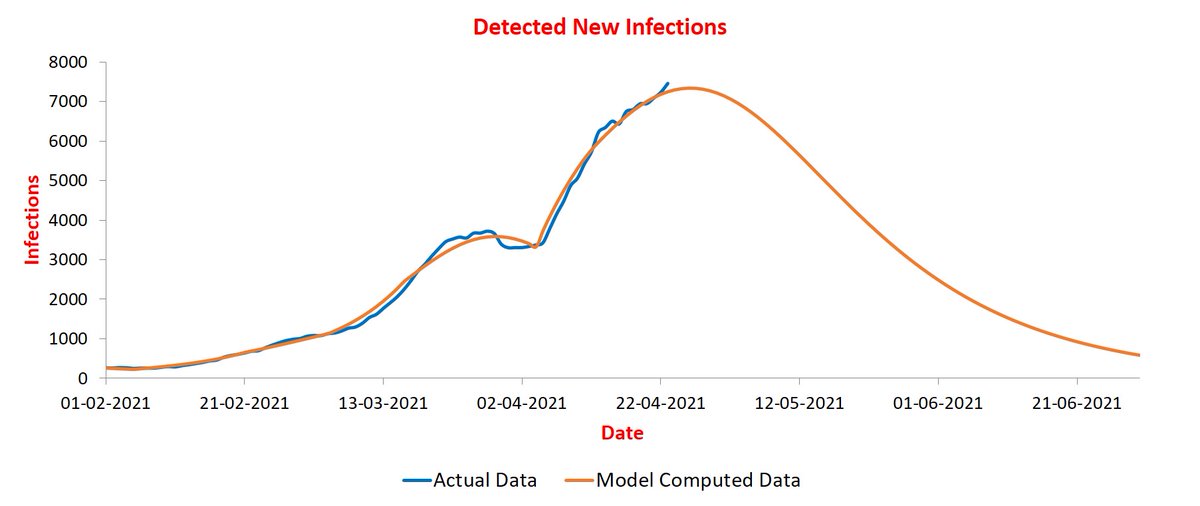
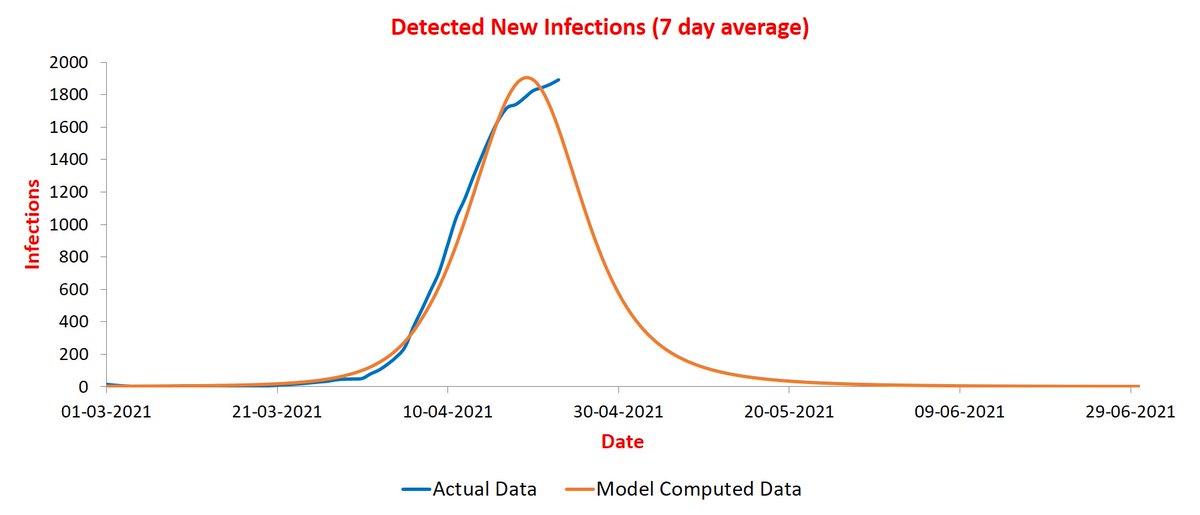
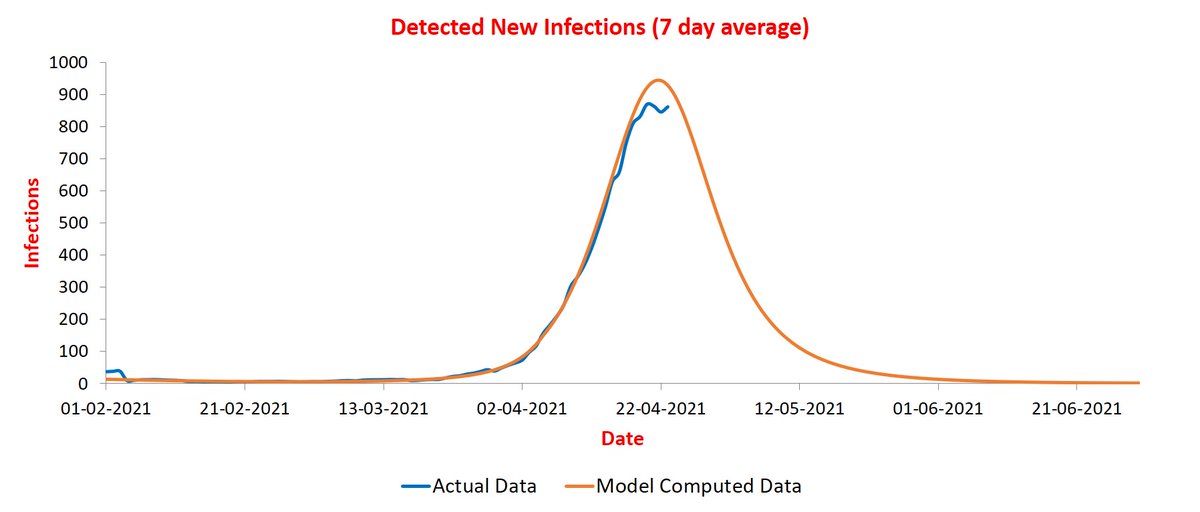
Next Mumbai where infections are increasing quite fast. The rise will continue for another couple of weeks and likely to peak during Apr 21-25 at around 13K infections/day.
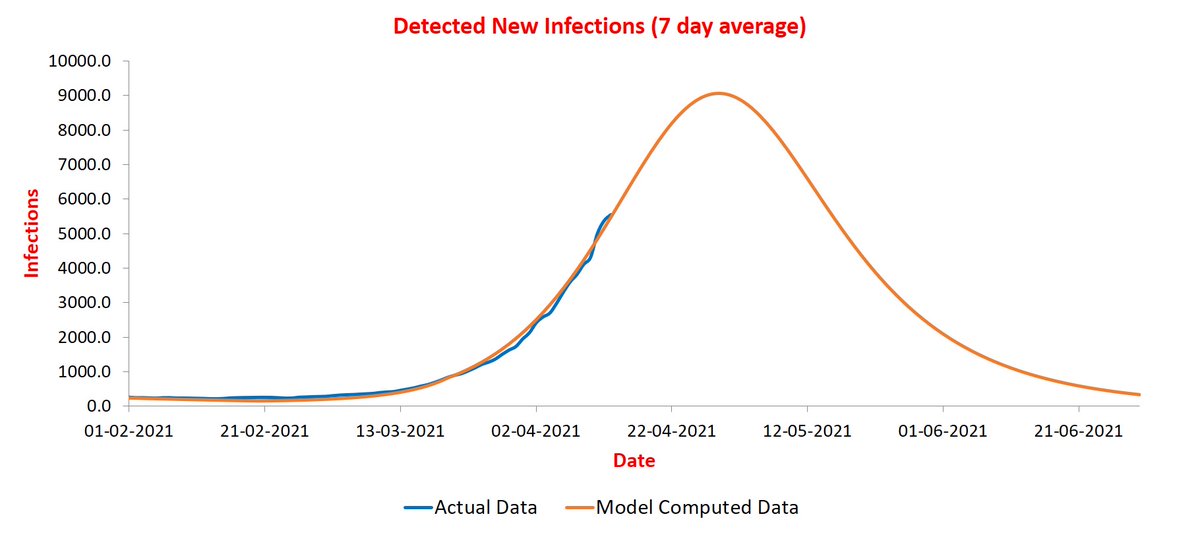
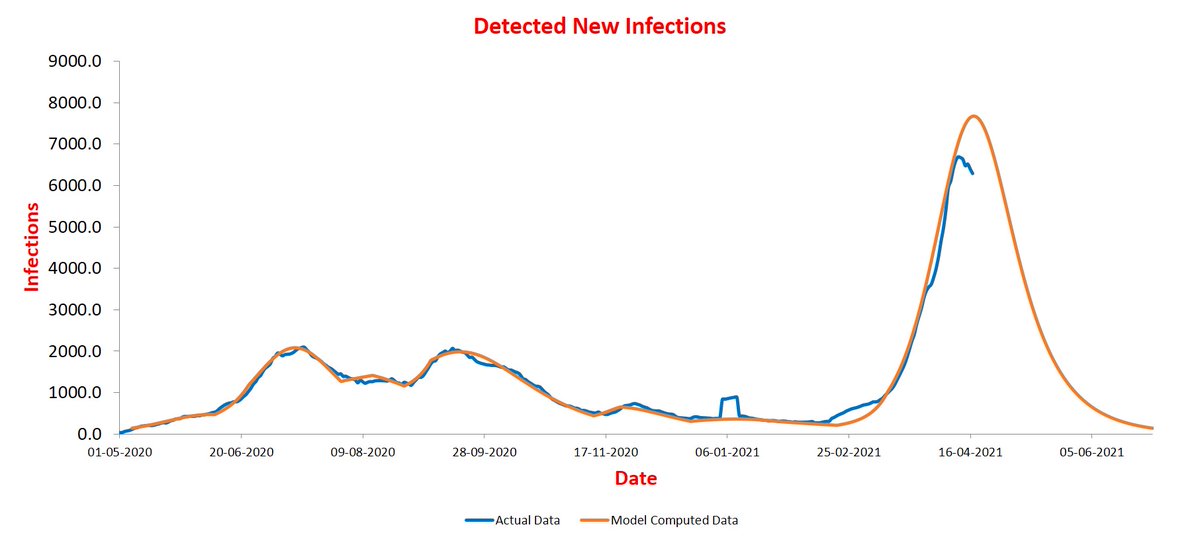
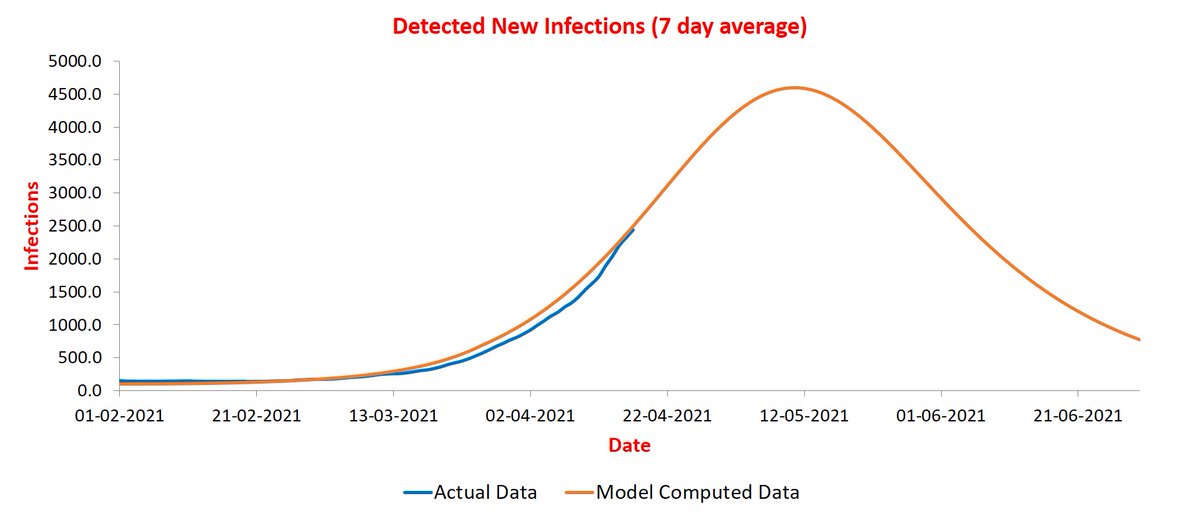
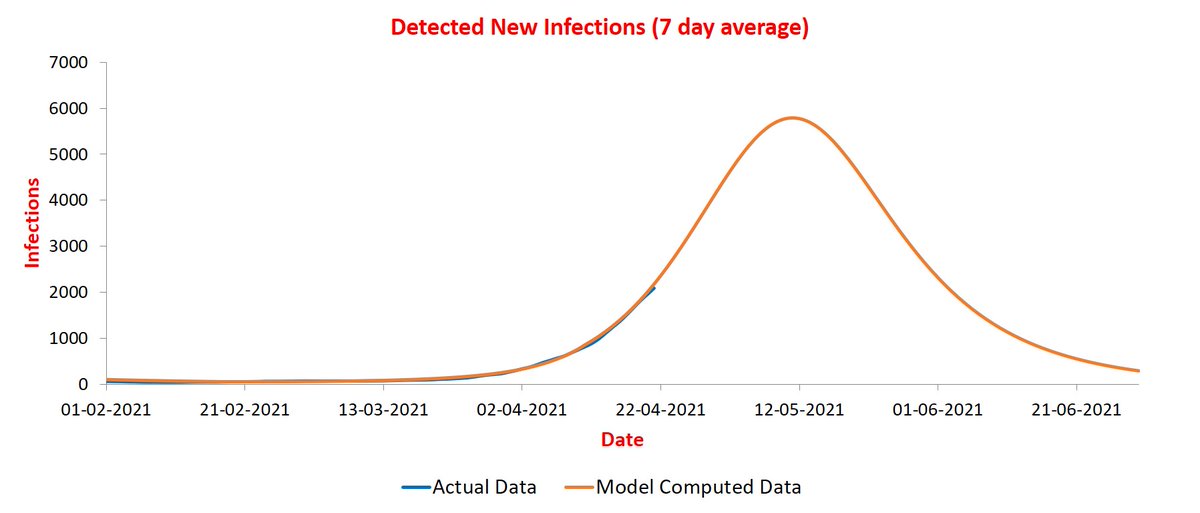
Bengaluru will peak even later: during Apr 26-30 at around 8K infections/day.

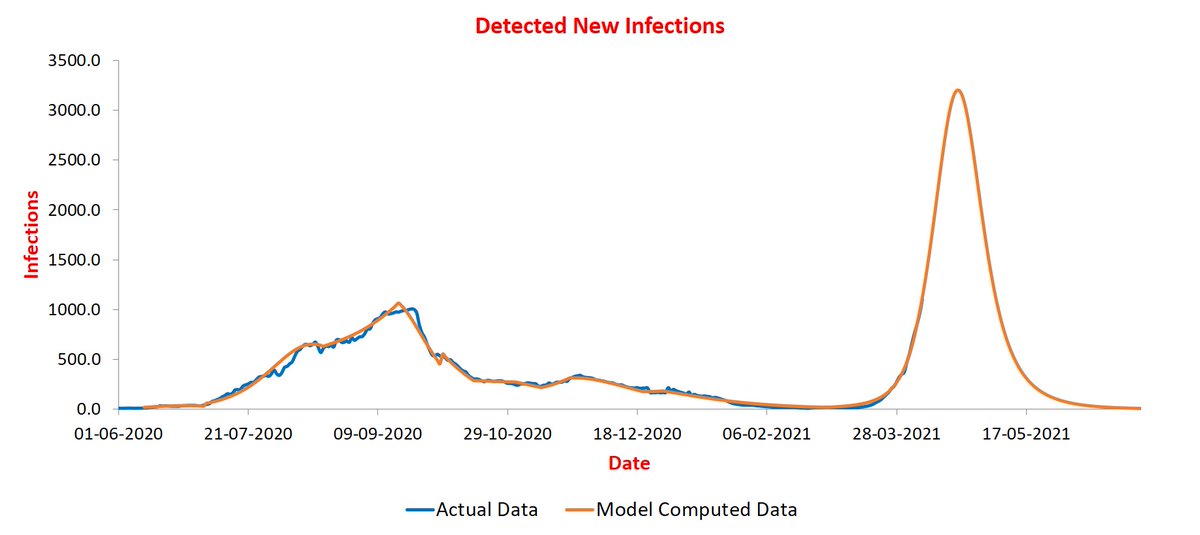
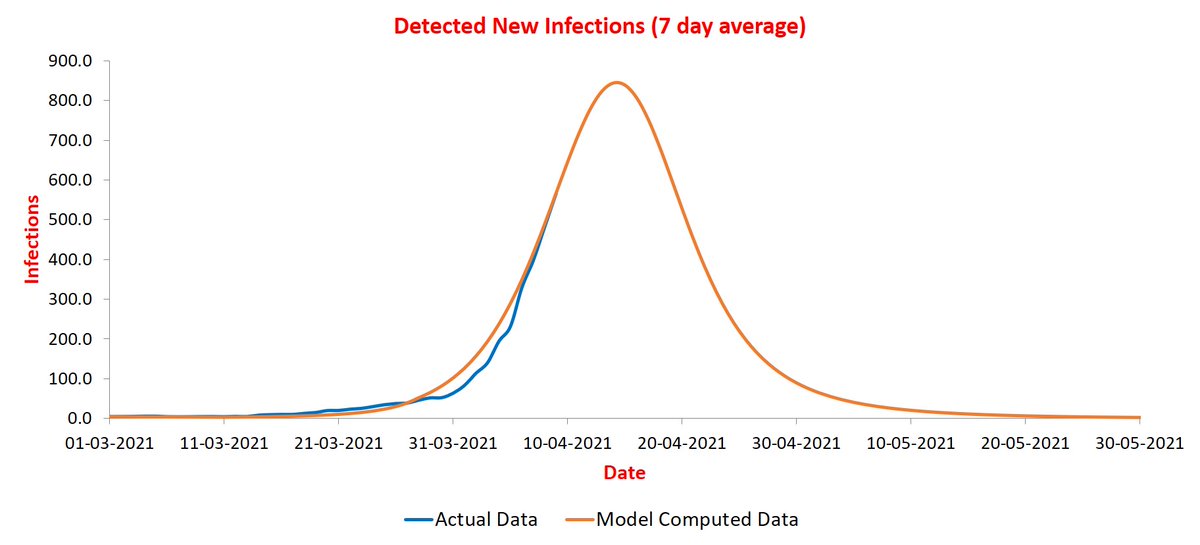
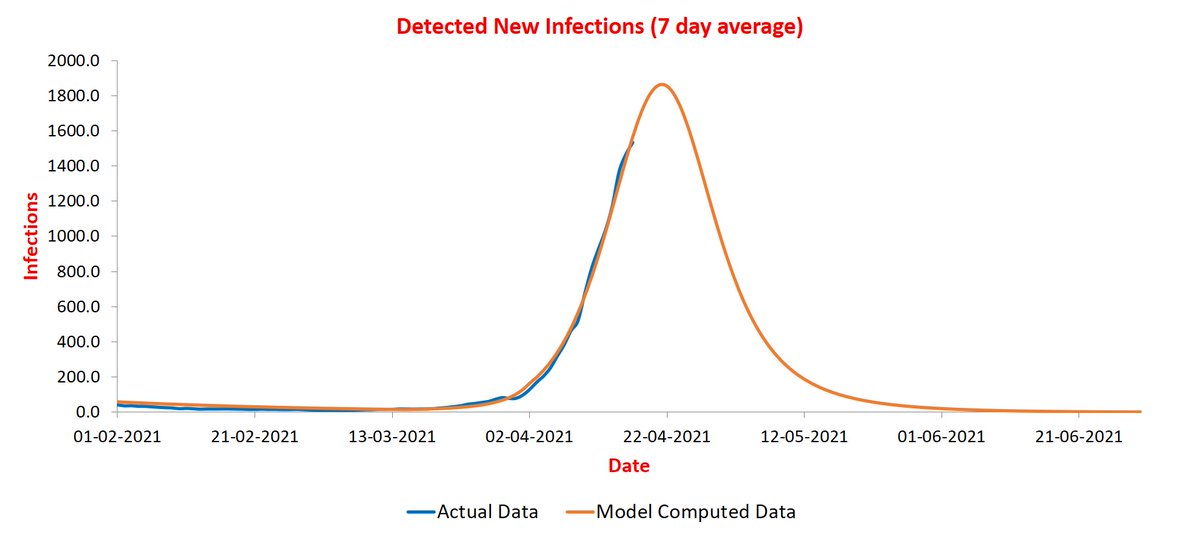
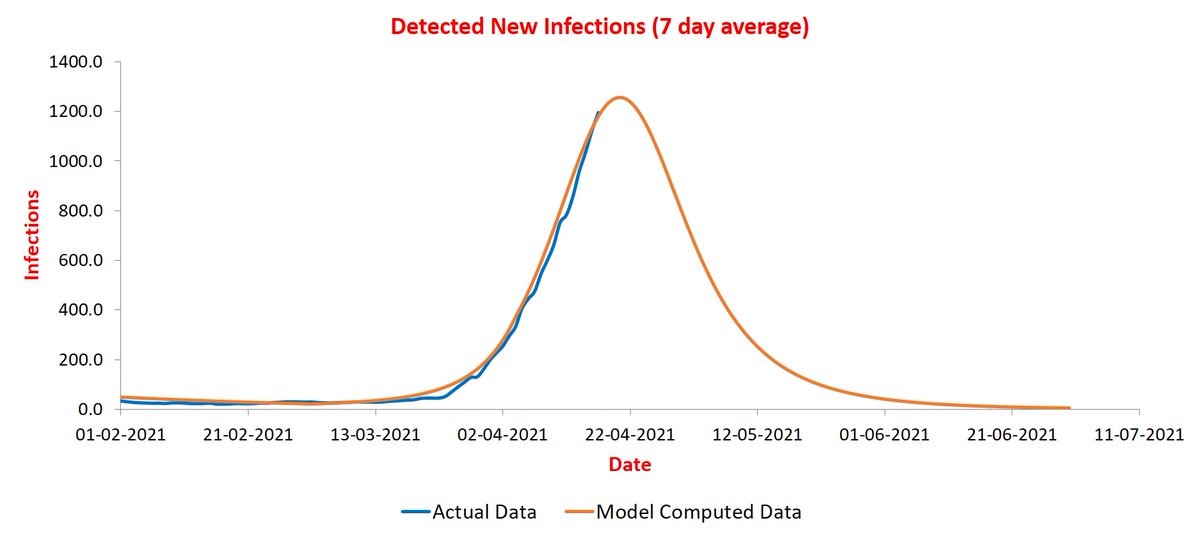
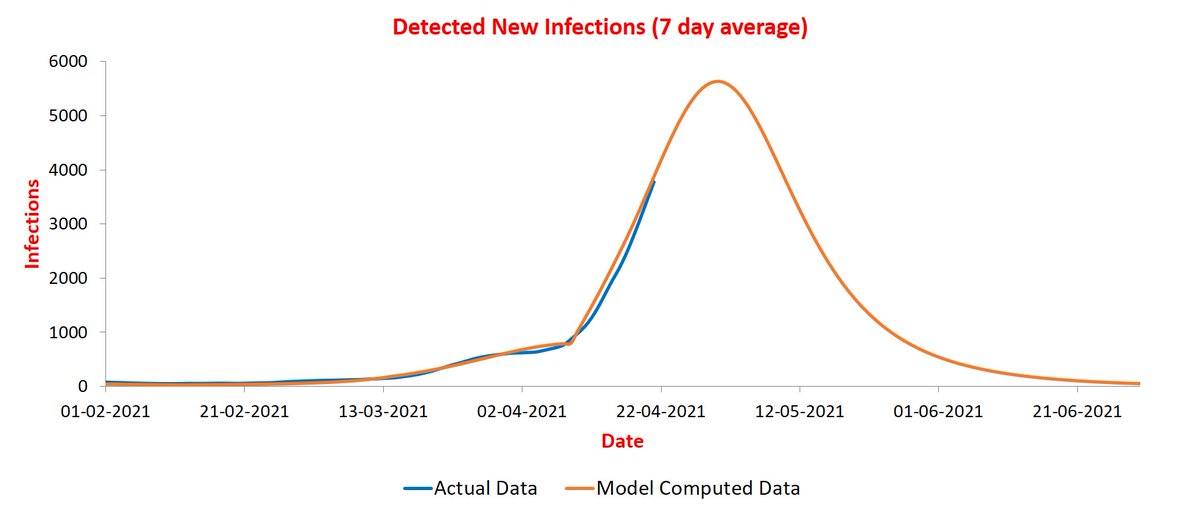
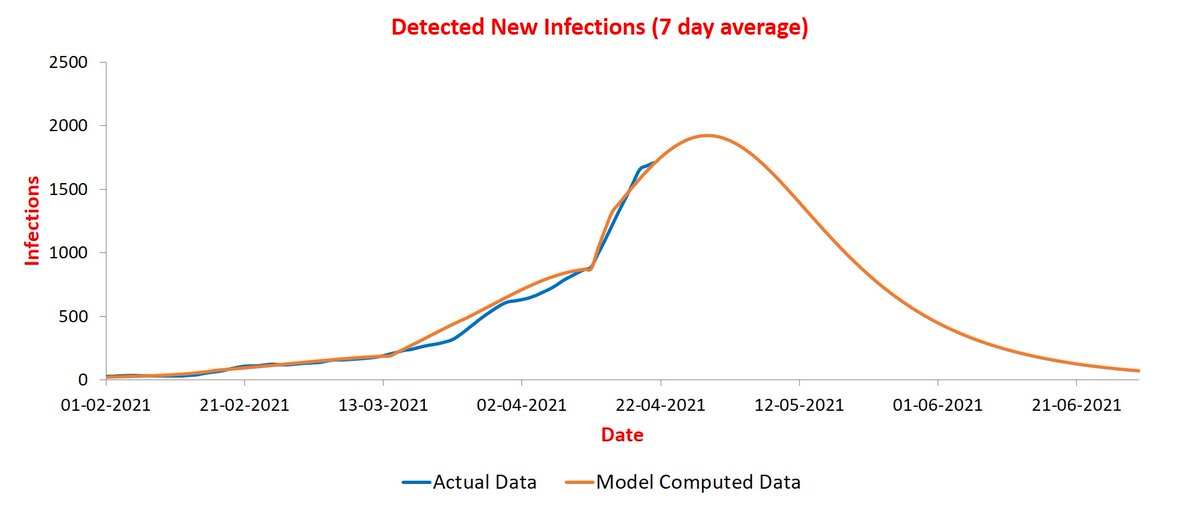
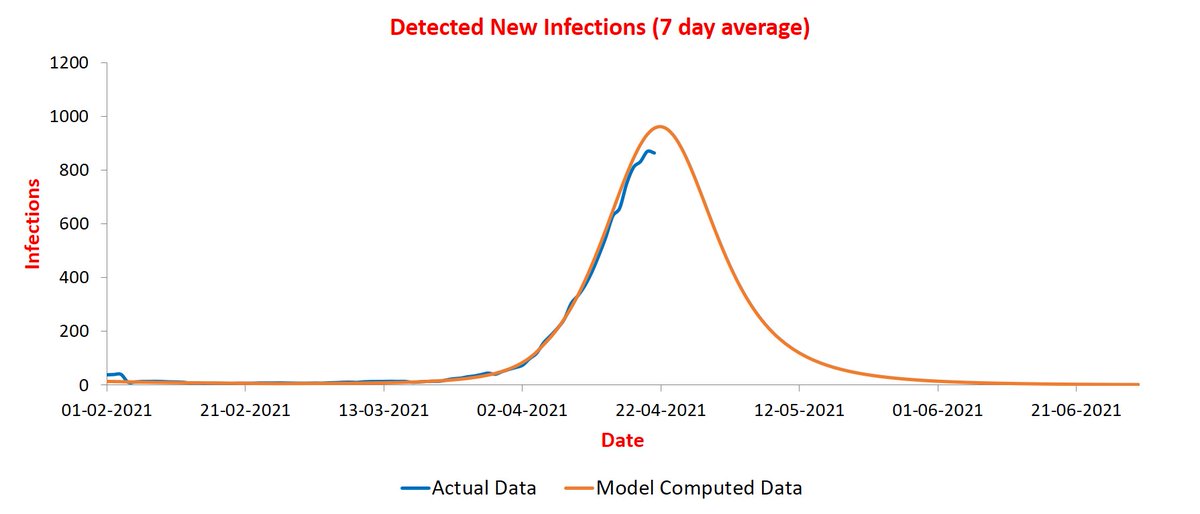
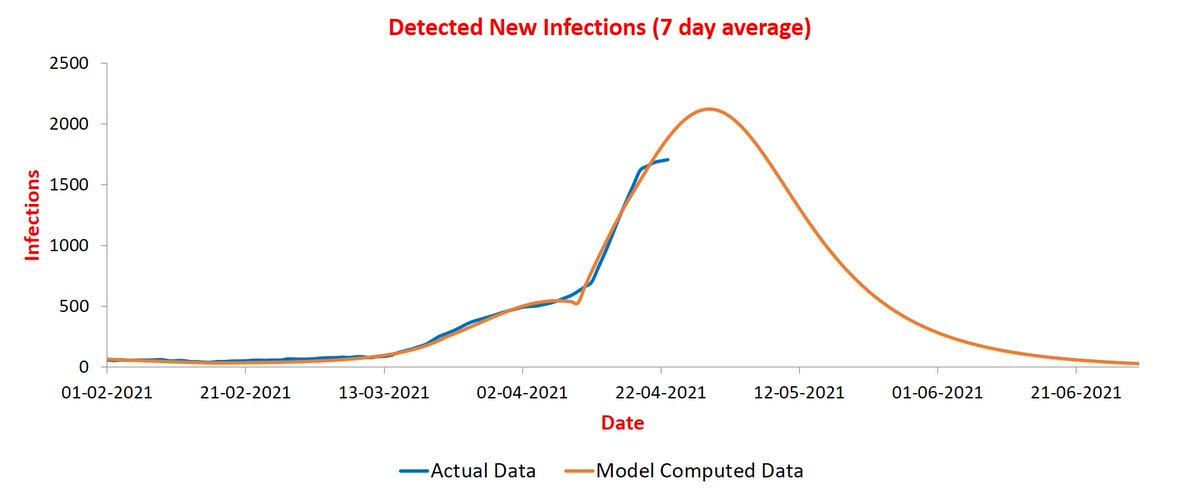
Finally Lucknow. It should peak during Apr 20-25 at ~3.3K infections/day. I am tracking a few more cities of UP like Kanpur and Prayagraj. Rise there is very recent and not yet captured by the model.
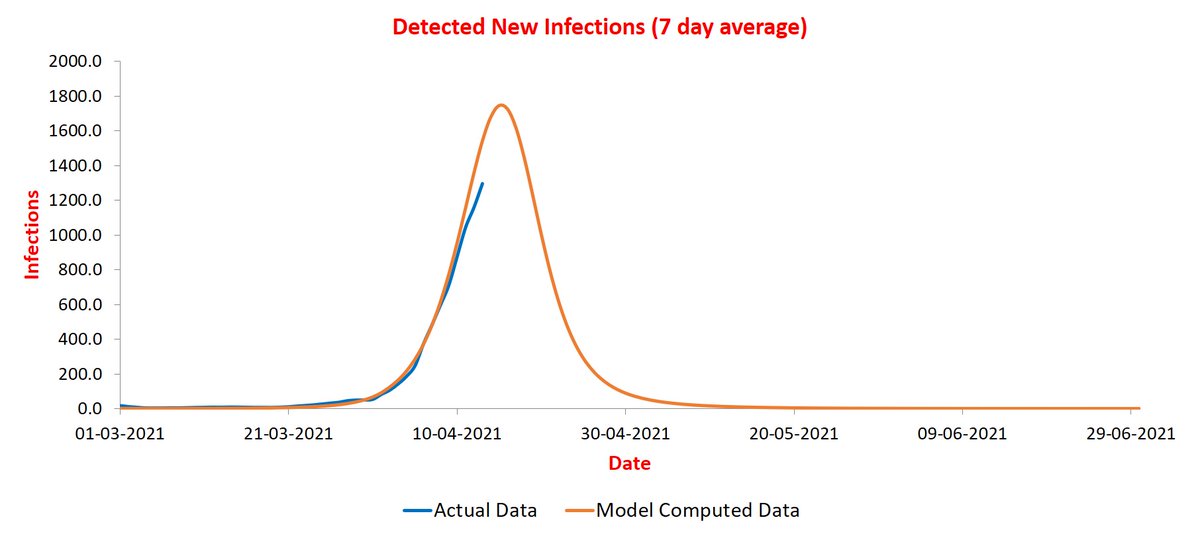
<Update on 10/4> Kanpur and Prayagraj are now captured by the model. But let us start with updates. First Pune. Earlier prediction stays. The blue curve has started flattening, an indication of peak.

Next Mumbai. Peak gone up slightly to 14K. To avoid any confusion, I have now explicitly noted in plot that new infections are 7-day average.

Bengaluru's blue curve continues staying on the orange curve without any change.
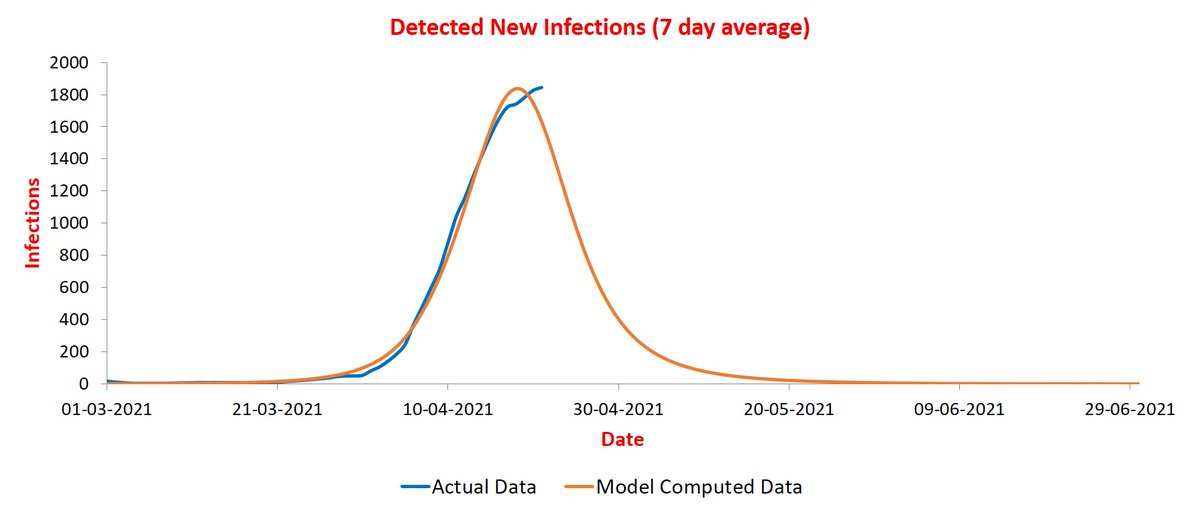
Lucknow peak has gone up slightly to ~3.5K infections/day and its timing remains the same. The blue curve appears closing in on the orange one.
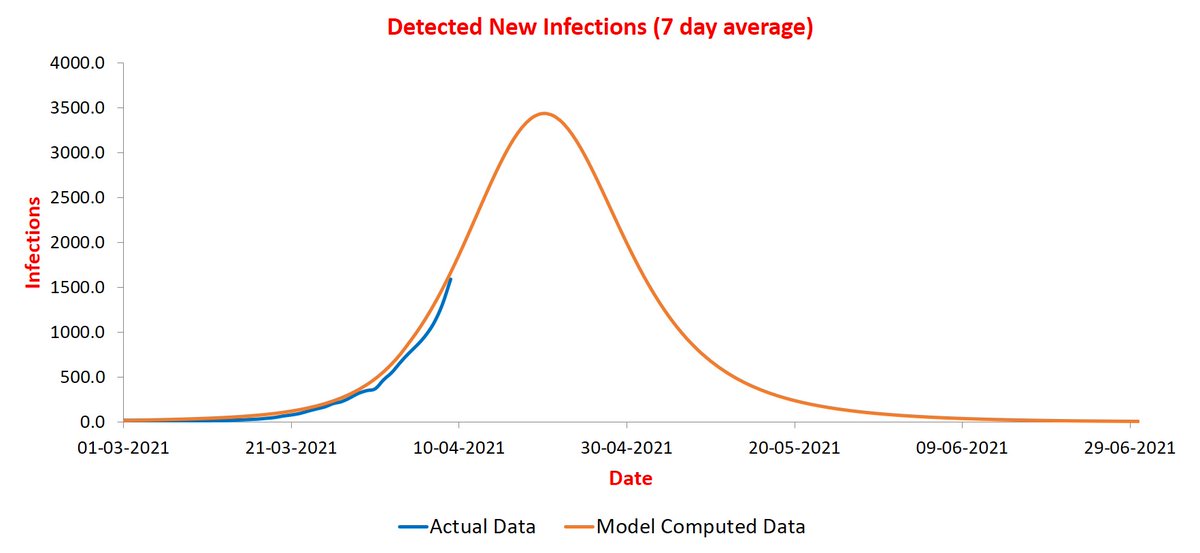
Prayagraj started rising very fast but has slowed down a bit now. It is expected to peak at around 3K infections/day during April 16-20. It is early days though and peak value is likely to change.

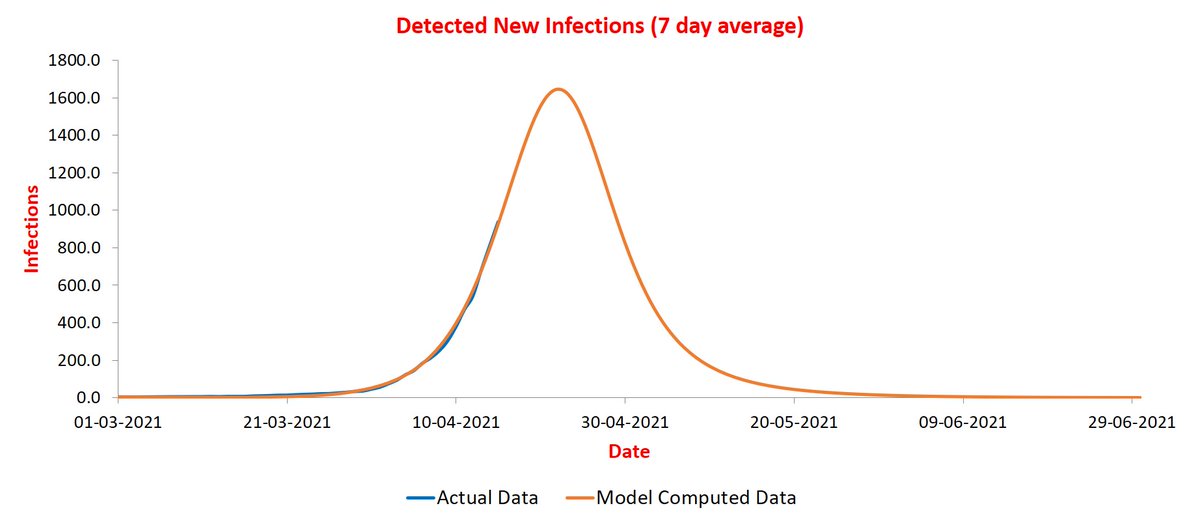
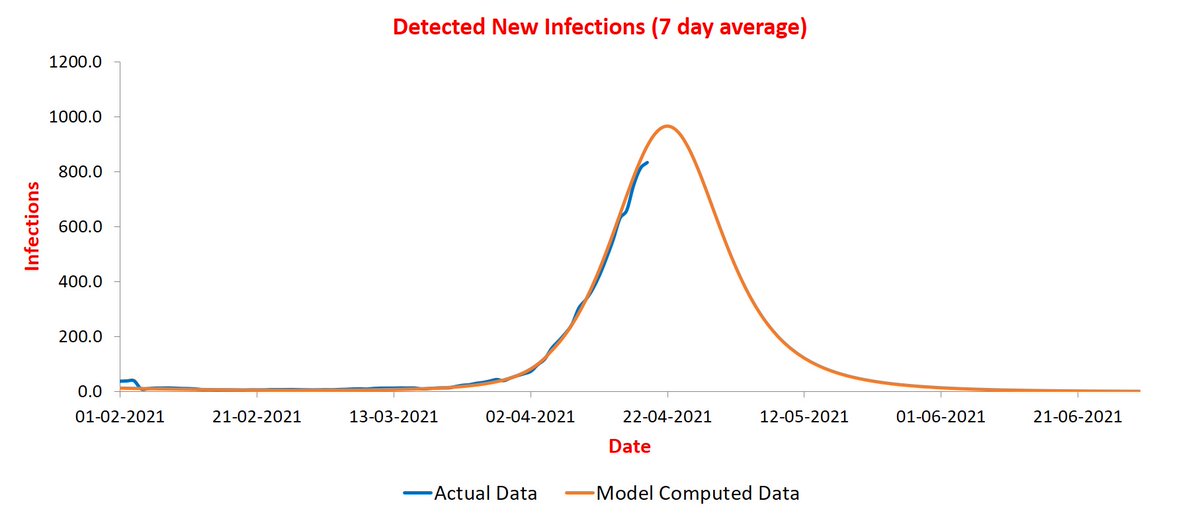
And finally Kanpur. Blue curve right on orange one! Clearly Corona is a considerate virus, making sure that it follows the trajectory in the city of SUTRA's origin 😊. Peaking at ~900 infections/day during April 16-20.
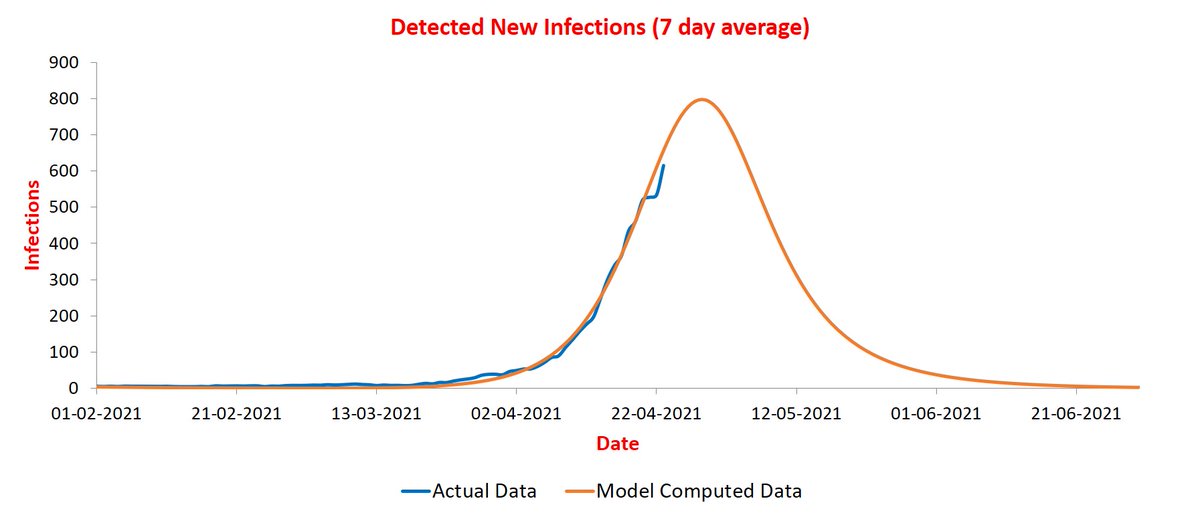
Forgot to include Varanasi. It is expected to peak at ~900 infections/day during next five days. The blue curve took a Holi break here as well😀.
<Update on 14/4> Pune has peaked and now hovering. Hopefully, it will start to come down in a few days unlike Punjab!😊
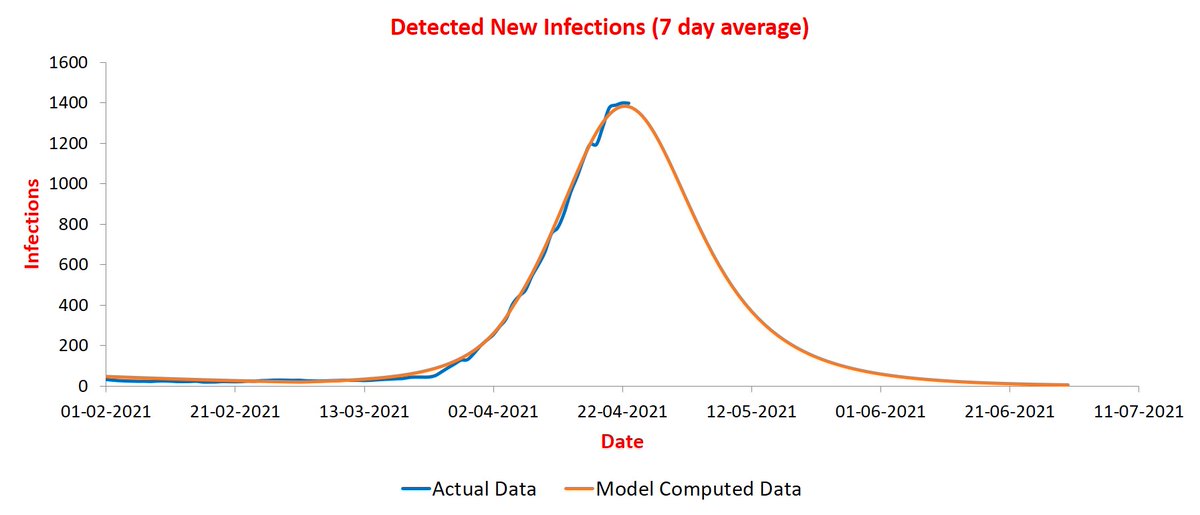
Mumbai is close to the peak. Both this and Pune curve support the prediction that Maharashtra is now peaking.

Bengaluru curves are moving in sync. Peaking during Apr 25-30.
Adding Chennai. It is at start of the rise, and blue curve may take a different direction. Let us see where it goes. As of now, peaking in May.

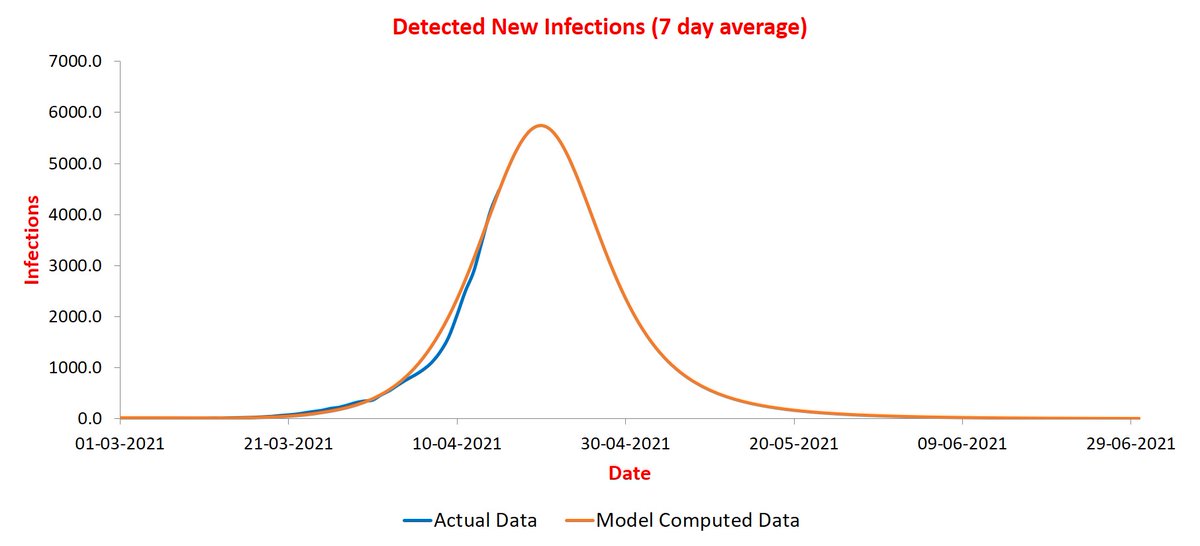
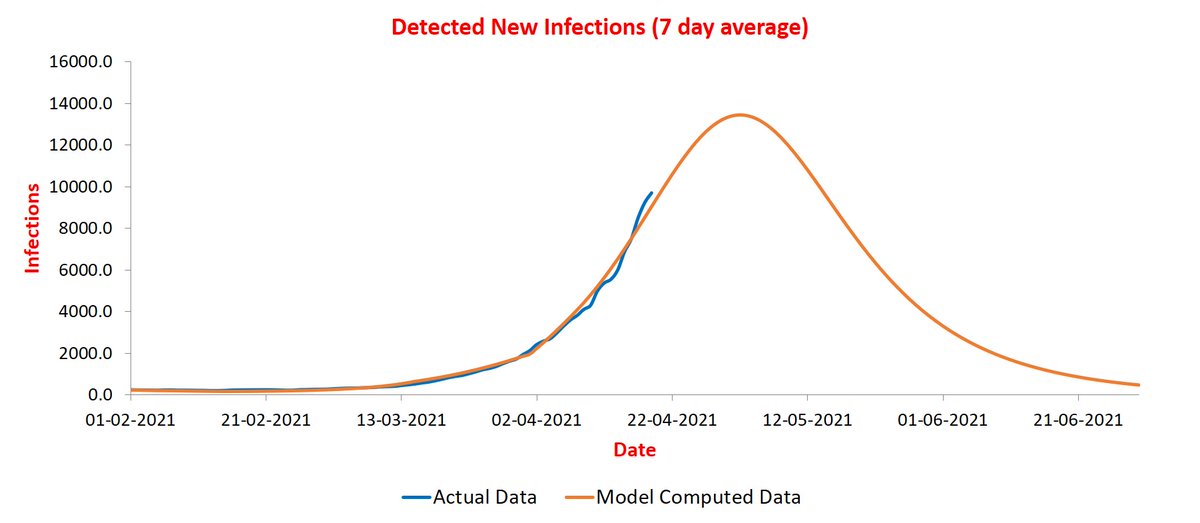
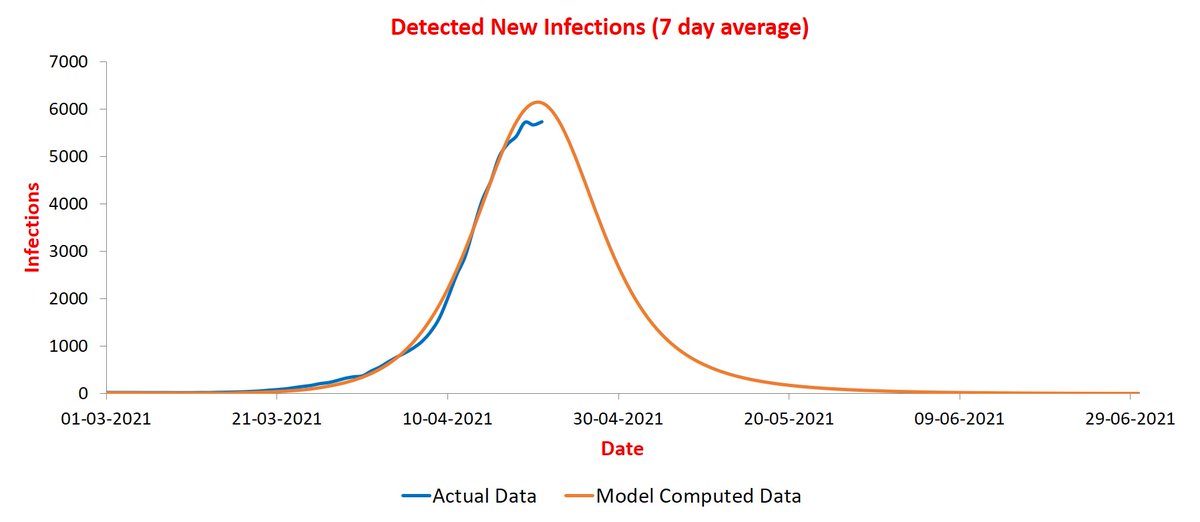
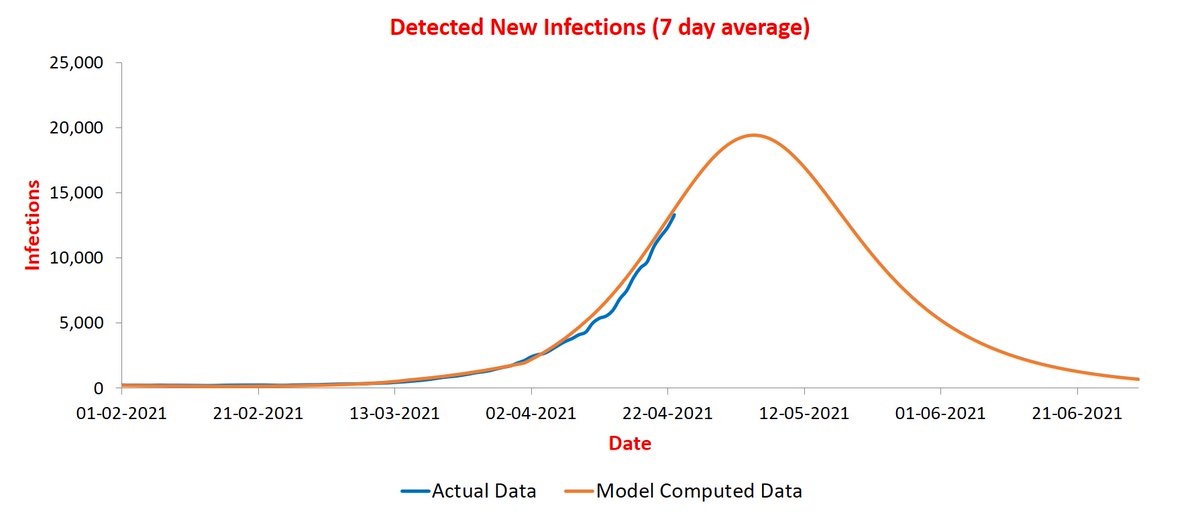
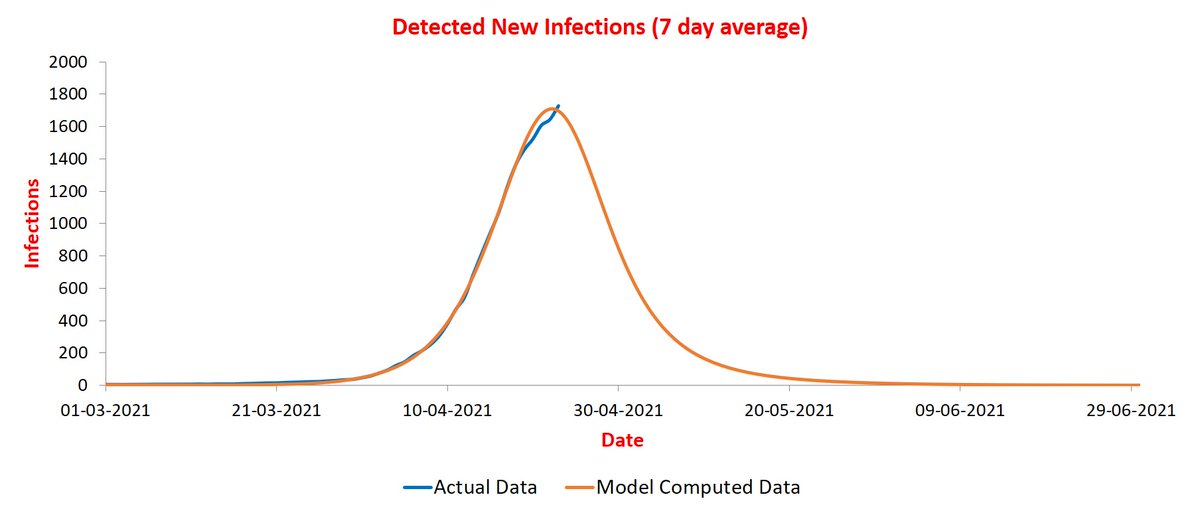
Now to cities of UP. Lucknow is seeing maximum number of cases. Blue curve has higher slope, but is it tapering off? Current peak value of ~5K cases during 15-20 will depend on this.

Prayagraj saw a very sharp rise but is now tapering off. Orange curve is still predicting a sharp rise with peak to come soon.
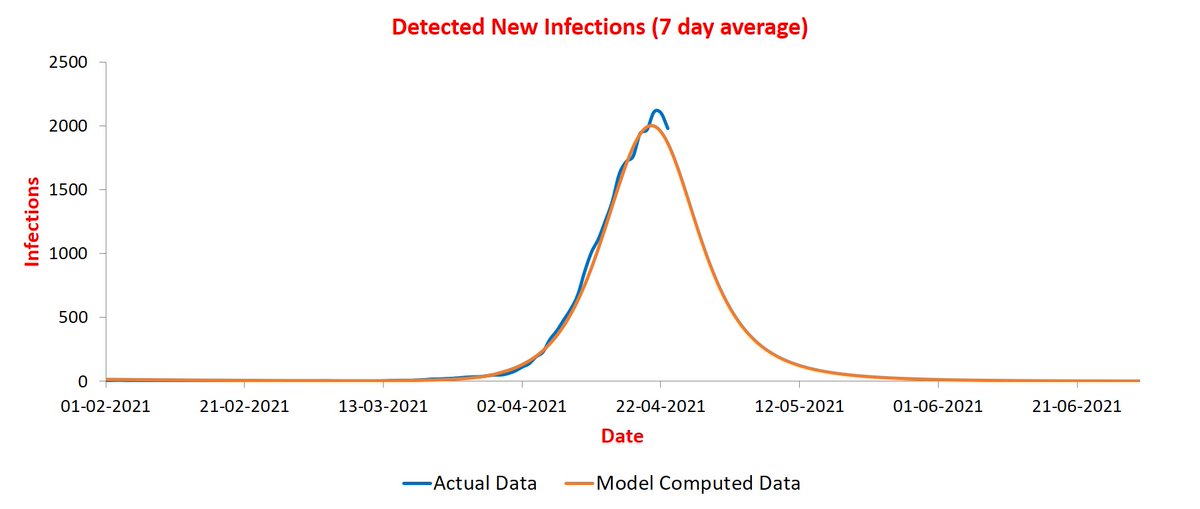
In Kanpur the two curves continue to move in sync. Peaking during Apr 20-25 around 1.5K.
Finally Varanasi. It also has both curves in sync. Peaking during April 15-20 at ~2K.
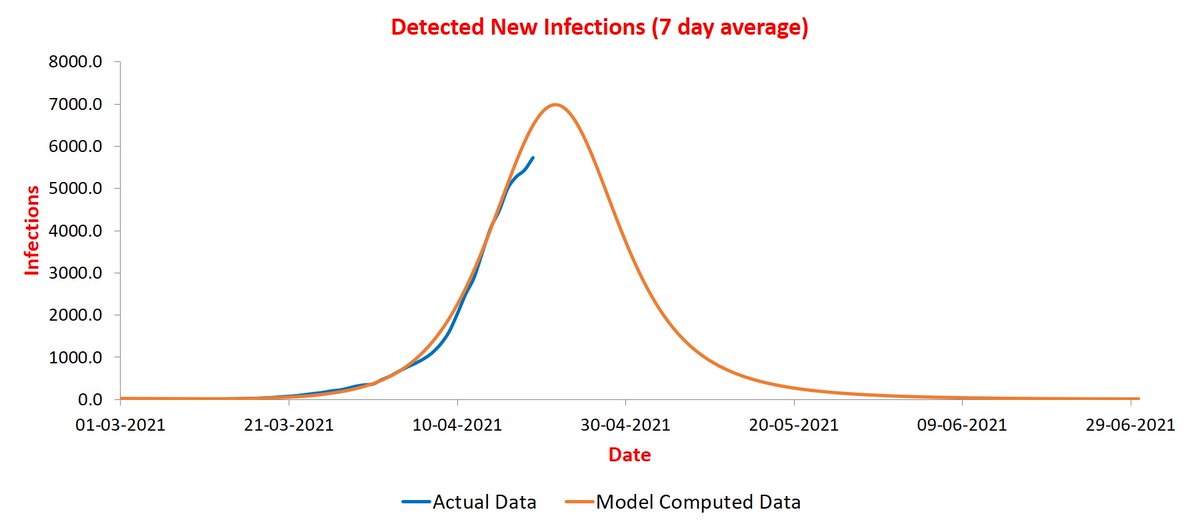
Adding Raipur, a city that is seeing very sharp rise. Orange curve has faithfully following blue one, so hope that blue will reciprocate in future 😀. Peak is round the corner, within a week.

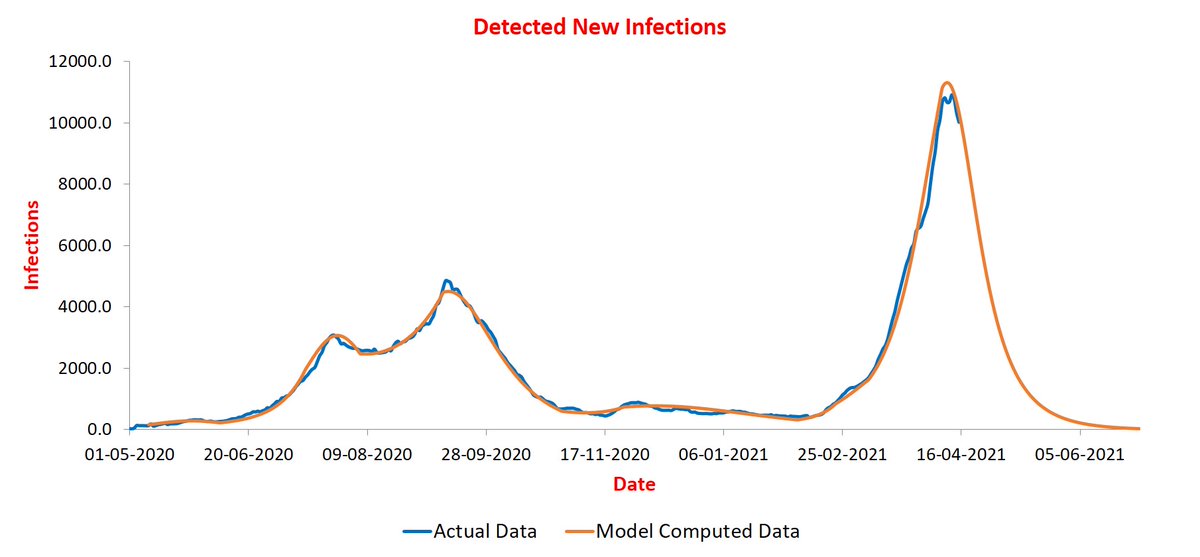
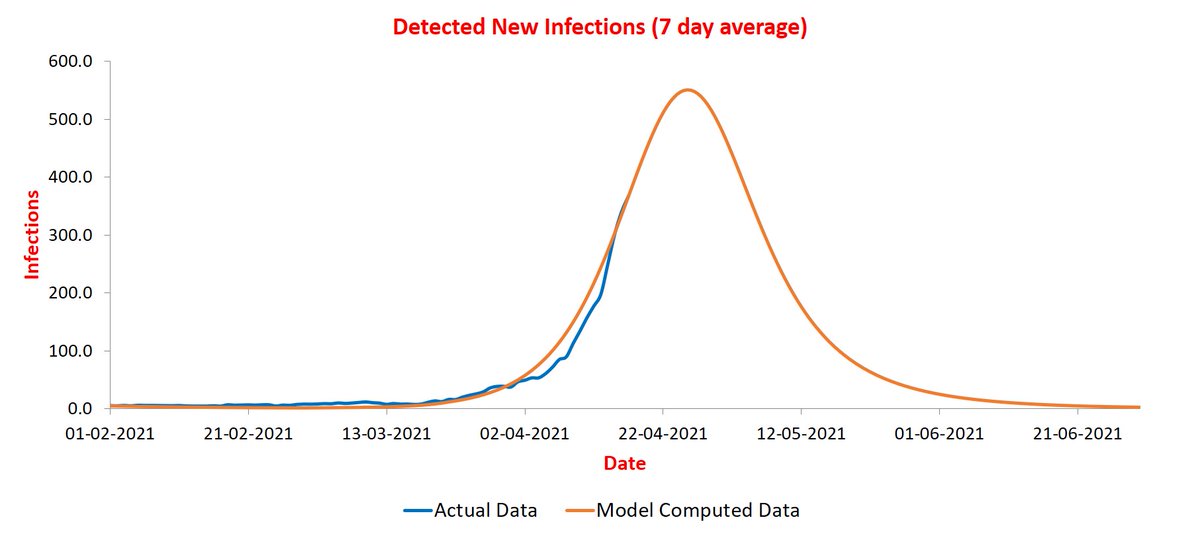
<Update on 16/4> Pune is past the peak and is now on way down. I am zooming out to show the entire timeline. @stellensatz
Mumbai continues to flatten and is following orange curve closely.
Bengaluru's blue curve has become jittery. Making up its mind whether to follow orange one?🤔If it decides to follow orange curve, then peak will arrive during April 25-30 at ~11K.

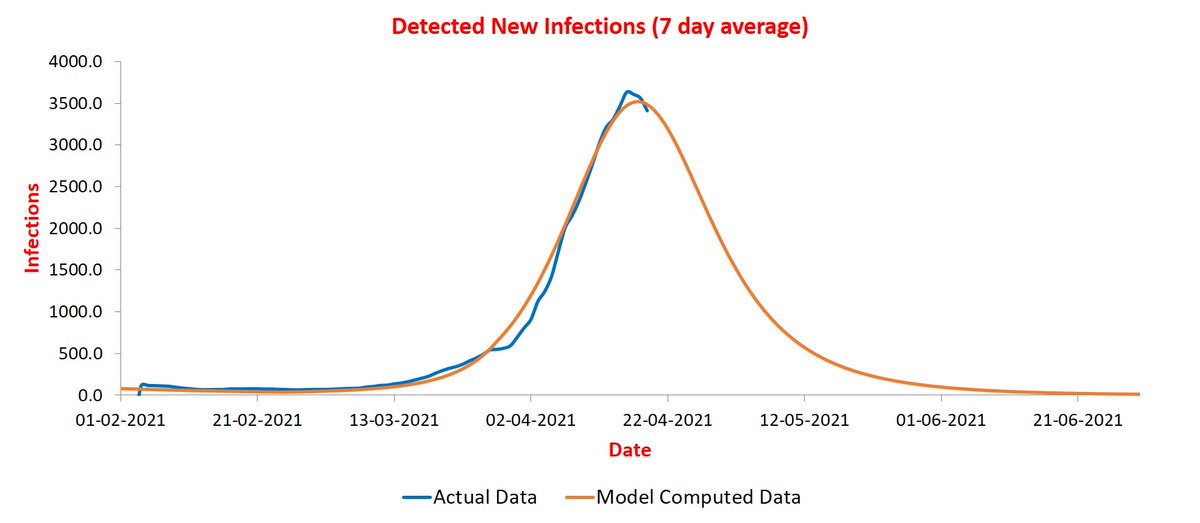
Lucknow curves are in sync now. Peak scheduled during April 20-25.
In Kanpur both curve continue in sync. Peaking during April 20-25.
Varanasi curves also in sync. Peaking in next few days!

Raipur is also very close to peak. Coming in next few days.

Adding Korba, another city in Jharkhand that saw sharp rise. Peaking during April 20-25.
Also adding Noida. Seems to be peaking during April 20-25. Blue curve is a bit erratic so estimates may change.

<Update on 18/4> @stellensatz Pune is a bit up-and-down. We will just have to wait and see where it goes. Hopefully, parameter values are not changing!
Mumbai has almost flattened.

Two days ago, Bengaluru curve was wondering whether to stay on orange or not. Looks like it decided against it.😐Revised trajectory will need some more data.
Adding Thane. It seems to have peaked before predicted time. Let us see how it goes.
Adding Patna. Both curves are in sync. Peaking in next few days.
Nagpur was drifting earlier, and seems to be stabilizing now. I would not place too much faith on predictions yet.

Raipur has hit the peak.

Korba is nearing peak. I mistakenly wrote last time that Korba is a town in Jharkhand -- it is in Chhattisgarh.
Adding capital of Jharkhand -- Ranchi. It appears very close to peak.
Chennai is moving up gradually compared to many other cities. Is blue merging with orange?
Now to cities of UP. First Lucknow. Is it peaking before projected?

The two curves continue to be in sync in Kanpur. Peaking within a week.
Curves for Noida are also in sync now. Also peaking within a week.
Has Prayagraj hit the peak?

Finally, Varanasi curve has bent, so seems to be at peak.
<Update on 20/4> @stellensatz Pune continues to hover. Making up its mind where to go?🤔
Mumbai curve is bending before predicted. We do not mind it😊

Thane continues its downward journey...

Bengaluru curve had decided to go another way two days ago, but seems to have changed it mind and is coming back to orange one😊
Chennai curves seem in sync now - will wait for a few more days to confirm.

Adding Kolkata. The two curves are in sync. Peaking during May 5-10.

Patna has overshot the peak. Let us wait for a few days to see how is it going.

Ranchi has come very close to peak...

Raipur is clearly turning...
Korba seems to be turning a little earlier. Let us see how it goes in the next few days.
Lucknow curve is going in a different direction. Will it continue to bend?🤔
Varanasi has also overshot the peak. Will it turn? Next few days will tell.

Kanpur curves still moving in sync with blue peeing out just a little.

Noida curves are in sync. Peak expected during April 26-30.

Prayagraj is at the peak and hovering a bit.

I am tracking some more cities: Ahmedabad, Surat, Bhopal, Indore, and Nagpur. However, their trajectories have not stabilized and a few more days are required to make prediction with some confidence.
<Update on 22/4> @stellensatz Starting with Pune as usual. Blue curve continues to hover. Note that the plot is for Pune district -- I understand Pune city is reducing.
Mumbai continues downward...
... and so does Thane.

Adding Nagpur that has now converged. It should peak within a week. It has gone through an unusual trajectory as can be seen below. Some other districts also show similar trajectory.
Bengaluru curves continue to play hide-and-seek. It hard to develop much confidence in projections until they move is sync for a few days continuously.
Kolkata curves are in sync. Peak shifted to May 10-15.
Chennai curves are close but have different slopes. Let us see when they converge.
Adding Ahmedabad that seems to be converging now. If they do, peak to arrive around 30th April.
Patna presents a special case. The two corves were moving in sync but blue has continued to go up while orange turned. This could due to either significant number of cases from outside or start of a new phase. We will know which soon.

Adding Bhopal. It also has a shape similar to Nagpur.

Another similar case is Indore. Both Bhopal and Indore are a little jittery and we need to observe for some days to see if the curves move in sync.
Now to some districts in UP. Lucknow first. The blue curve appears to be at peak. Hope it starts going down soon!
Prayagraj curve is also hanging around the peak. Will it turn downwards soon? Let us hope so!
Kanpur is almost at the peak now.

Varanasi, like Patna, has overshot the peak. Possible reasons are the same.
Noida tracking well. Peaking during April 25-30.

Moving east, Korba appears to have hit the peak.
Raipur is past the peak and on the downward journey.

Finally Ranchi. Blue curve is peeking out at the top but has turned. However, it turned like this a few days ago also. Will it continue to turn?🤔We will know in a few days.

I am working on plots for top 50 districts (large number of active infections or large increase in active infections) of India and plan to put them on a website soon. Watch this space.
<Update on 24/4> @stellensatz Pune still hovering...
Mumbai still going down...
Thane still going down...

Nagpur nearing peak...
Bengaluru still uncertain...
Kolkata on track...

First change is Chennai. The two curves appear to have converged. Peak during May 15-20.

Patna continues its upward journey! I understand there is a large influx of people from outside there. We have not modeled that, so predictions are off. Still, it is expected that in a few days the blue curve should turn downward.

Bhopal curve has flattened suddenly. Possibly a sign of reduced testing?
Same is the case with Indore.

Lucknow has turned downward. Hope it continues...

Prayagraj continues to confound. It seems on a different trajectory now. Is it a phase change? We need a few more days data to be certain.
Kanpur is hitting the peak now. Will it turn, or will go on a different trajectory like Prayagraj?
Varanasi has finally turned!
Noida curve, which had flattened yesterday, has resumed upward journey. Such intermittent flattening is likely due to delay in testing results.
Korba is now hovering at the peak.
Raipur is continuing its downward journey.

And finally Ranchi. It had shot up above the orange curve peak but over past two days has turned and seems to be at the peak now.
<Update on 26/4> @stellensatz Pune has started going down again. Is there another twist in the future?

Mumbai is well and truly on downward journey.

Thane curve is flattening a bit, however, it is likely to be temporary.

Nagpur is going off a bit near the peak.

Bengaluru continues of confuse. The parameters continue to drift and so it is hard to estimate their correct values.

For Kolkata, on the other hand, parameter values are very stable.

Chennai continues on the predicted trajectory.

Patna has turned! Is it for good? We will know soon.

Bhopal flattening continues. I am told it could also be because of lockdown imposed sometime ago.

Indore moving identically.

Lucknow is now hovering.

Prayagraj curve has turned downward! So the trajectory change around the peak may not be due to a new phase, but because of delayed testing results.

Kanpur is off on the similar trajectory as Prayagraj. Is it also due to delated testing results? We will know in a couple of days.

Varanasai has started hovering.

Noida trajectory is jerky. Testing delays?

Korba continues to hover.

Raipur is well and truly on downward trajectory. And it is coming down as rapidly as it went up.

Ranchi has turned up after flattening at the peak. Where does it want to go?🤔

Adding Ahmedabad. I now have some confidence in predicted trajectory but there is still uncertainty. Orange curve peaking during May 1-5.

<Update on 29/4> @stellensatz Delayed by a day due to some pressing engagements... Pune is well-and-truly on its way down now!

So is Mumbai.

And Thane.

Nagpur is at the peak.

Bengaluru parameters have stabilized now. Peaking during May 5-10.

Kolkata continues to follow projected trajectory.

Chennai is diverging a bit.

Patna appears to have turned for good!

Bhopal plot has been updated with more data points as it was a little unstable. It seems close to peaking.

Same for Indore. The two MP districts are moving almost identically!

Lucknow on its way down now!

Prayagraj well on its way down!

Kanpur may be turning now...

Varanasi, after hovering for some time, appears on its way down.

Noida shooting up! Hopefully it will turn soon like some other districts.

Korba is still hovering.

Raipur is reducing fast. Down by more than 40% from peak value.

Ranchi is still going up. Hope it turns soon.

Ahmedabad curve updated. It is stable now. Peaking time remains same: May 1-5.

Adding Surat. It is close to peaking.

<Update on 2/5> @stellensatz I bring mostly good news today! Pune continues downward journey with zig here and a zag there.

Mumbai, a city with little time to waste, is going straight down.

Thane, initially influenced by Pune, is now learning from Mumbai.

Nagpur is just past the peak.

Bengaluru stays on track to peak during May 5-10.

Kolkata back with orange curve. Peaking with Bengaluru.

Chennai is on a relaxed journey with no hurry to peak or rise.

Ahmedabad may have peaked.

Bhopal also may have peaked.

And Indore will not want to be behind Bhopal I suppose.

UP districts are taking a leisurely way down after peaking. Lucknow:

Prayagraj:

Kanpur:

Varanasi:

The only exception is Noida. It is is no mood to peak despite repeated invitations from orange curve. In a hurry to go somewhere?🤔
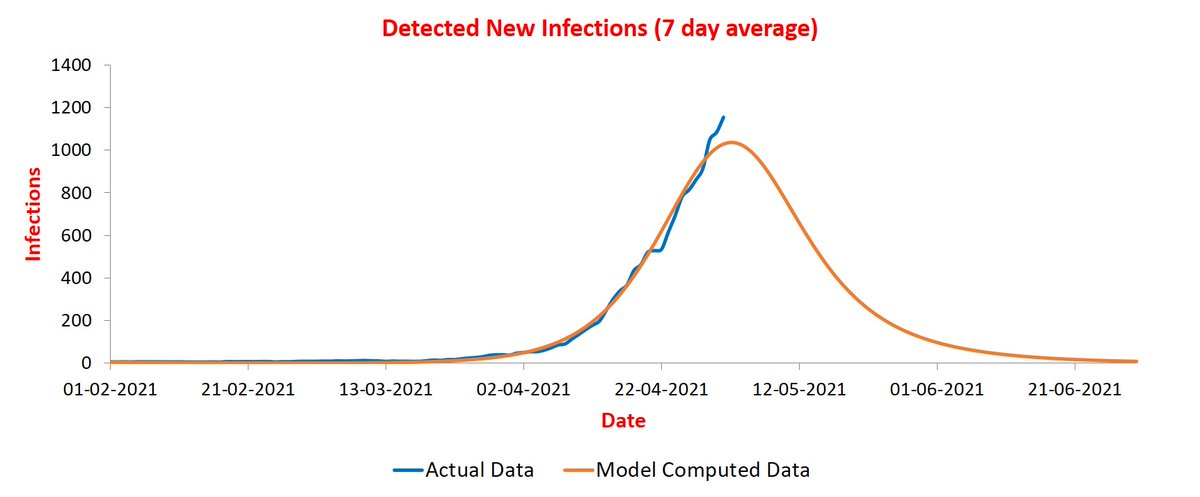
Moving east. Patna also seems to have peaked and meandering downward.

Raipur learning from Mumbai!😳

And Korba learning from Chandigarh!😳Chhattisgarh seems a really cosmopolitan state.

Ranchi may be coming down now.

Finally, Surat has peaked as well!

I forgot to add Khorda from Odisha. The district containing city of Bhubaneswar. It appears near the peak. It appears restrictions were imposed whose effect is visible since past one week. This will delay the peak a bit. Should arrive in next few days.

• • •
Missing some Tweet in this thread? You can try to
force a refresh


