Finland had a special year in 2019, worth a look...
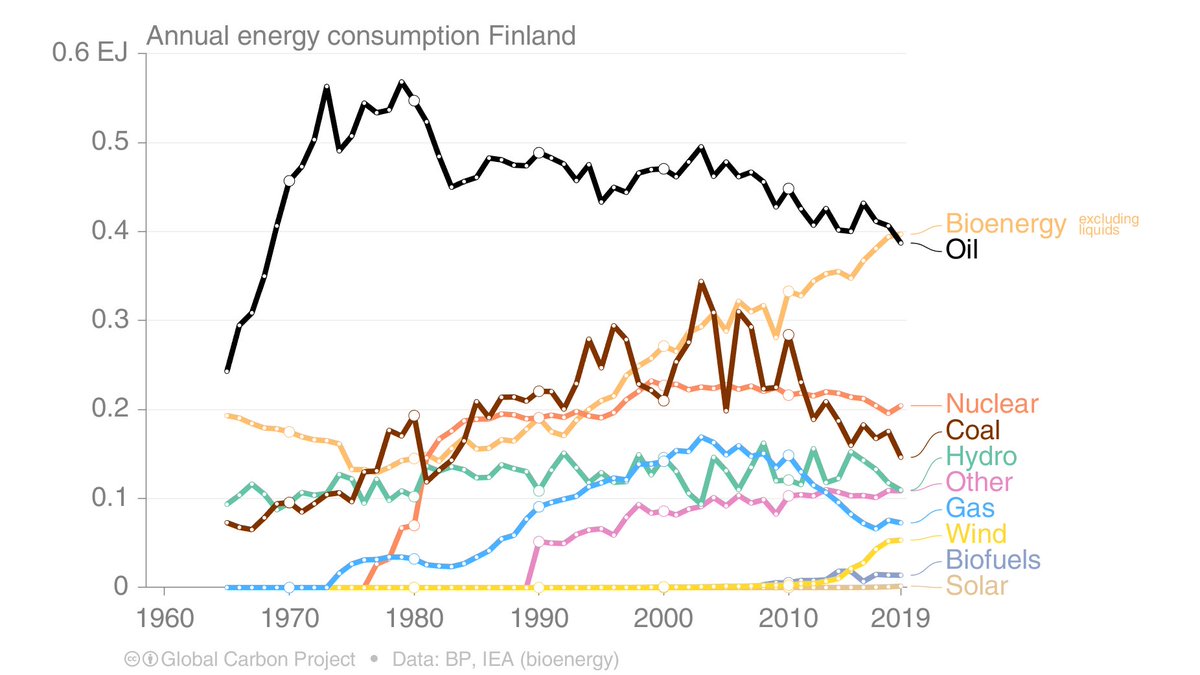
In terms of Primary Energy, the largest energy source in Finland is now bioenergy, passing oil in 2019!
Finland also has a high share of nuclear...
1/
In terms of Primary Energy, the largest energy source in Finland is now bioenergy, passing oil in 2019!
Finland also has a high share of nuclear...
1/
As of 2019, Finland now emits less CO₂ than Sweden & Norway in aggregate terms.
Finnish CO₂ emissions went down 9% in 2019.
Interesting to see how things look in 2021 (after 2020 changes).
2/
Finnish CO₂ emissions went down 9% in 2019.
Interesting to see how things look in 2021 (after 2020 changes).
2/

Though, CO₂ emissions per person are still relatively high in Finland, more than twice the global average.
In good news, Finnish CO₂ emissions per person are falling relatively fast.
3/
In good news, Finnish CO₂ emissions per person are falling relatively fast.
3/

And here are total GHG emissions up until 2018, showing the size of the LULUCF sector in Finaldn...
(more later)
/end
(more later)
/end

Continued...
Here are the CO₂ emissions including LULUCF. The net CO₂ emissions have risen, due to a weakening sink (the gross emissions should be the same as tweet #2)
5/
Here are the CO₂ emissions including LULUCF. The net CO₂ emissions have risen, due to a weakening sink (the gross emissions should be the same as tweet #2)
5/

The LULUCF CO₂ emissions have increased (got less negative) due to less update in forests.
I do not know why, would have to ask a Finn! Could be increased harvest, management, age class effects, etc.
6/
I do not know why, would have to ask a Finn! Could be increased harvest, management, age class effects, etc.
6/

Methane emissions have continued downwards, primarily due to less methane emissions in the waste sector.
7/
7/

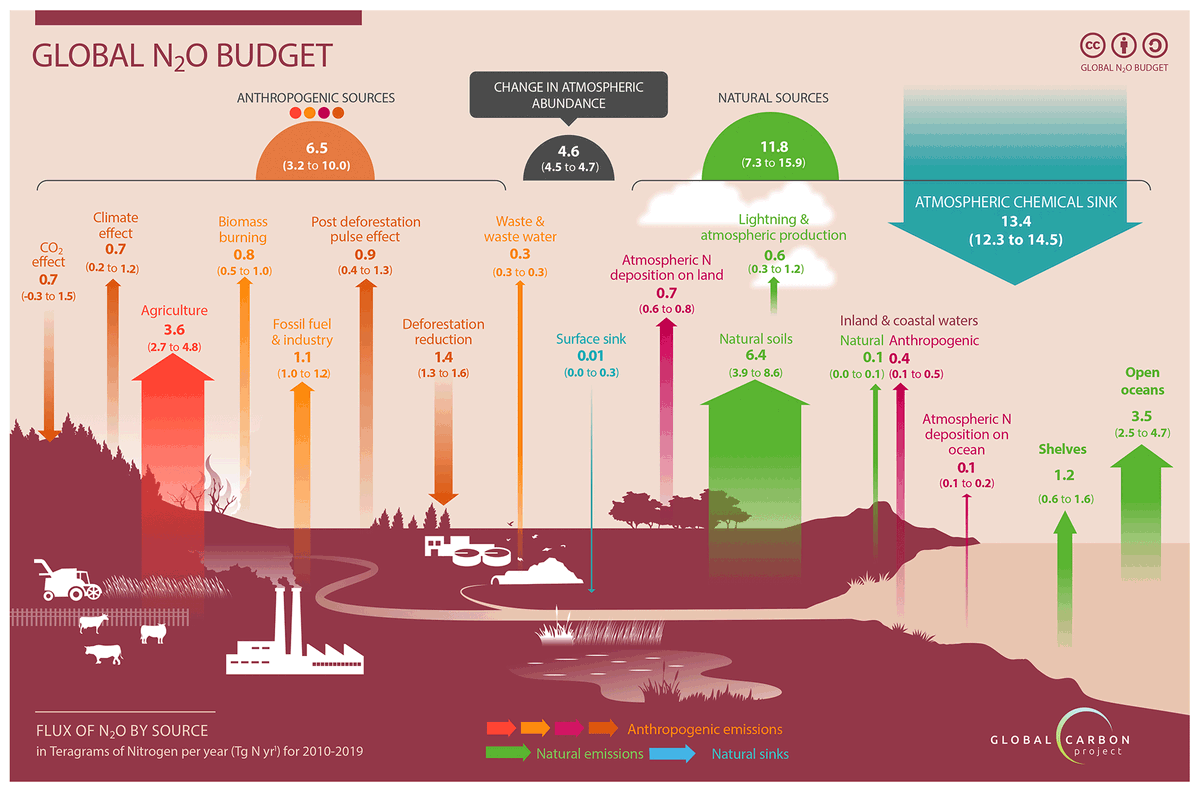
N₂O emissions have been flat, except from a dramatic drop around 2008/2009. This is probably a factory closure.
8/8
8/8

• • •
Missing some Tweet in this thread? You can try to
force a refresh