
NEW: big international Covid data thread, focusing on the contest between vaccines & variants
First to the UK, where things are looking very good. The vaccine effect is still crystal clear, with more than 10,000 lives already estimated to have been saved assets.publishing.service.gov.uk/government/upl…
First to the UK, where things are looking very good. The vaccine effect is still crystal clear, with more than 10,000 lives already estimated to have been saved assets.publishing.service.gov.uk/government/upl…
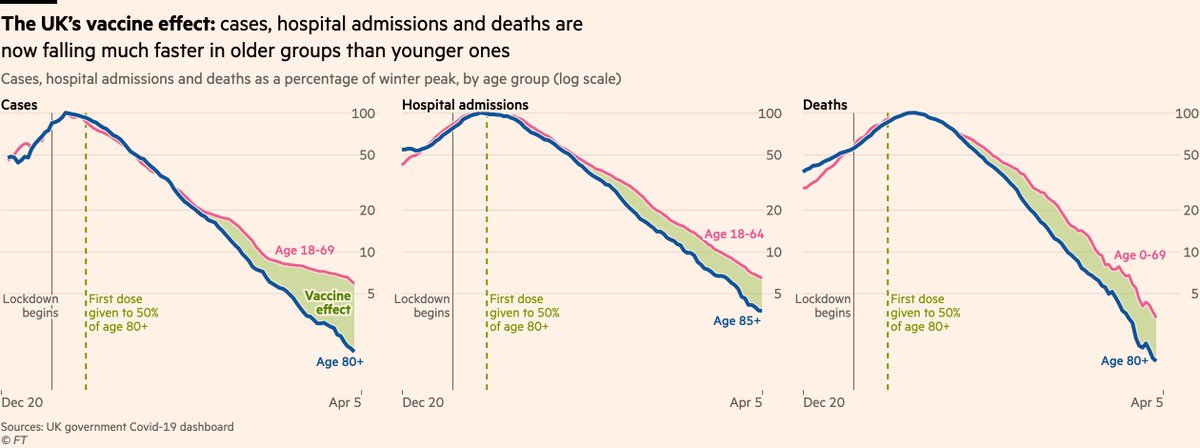
And critically, rates of cases, hospitalisations and deaths are all falling among both the most and least vaccinated age groups.
Those straight blue lines represent constant rates of decline among the most-vaccinated, completely unaffected by the reopening of schools.
Those straight blue lines represent constant rates of decline among the most-vaccinated, completely unaffected by the reopening of schools.
It’s not just the very elderly who are benefiting, either. This chart (concept from @JamesWard73) shows that as the UK’s vaccination rollout has progressed down through the age groups, so has the vaccine effect. It’s amazing how clear the pattern is.
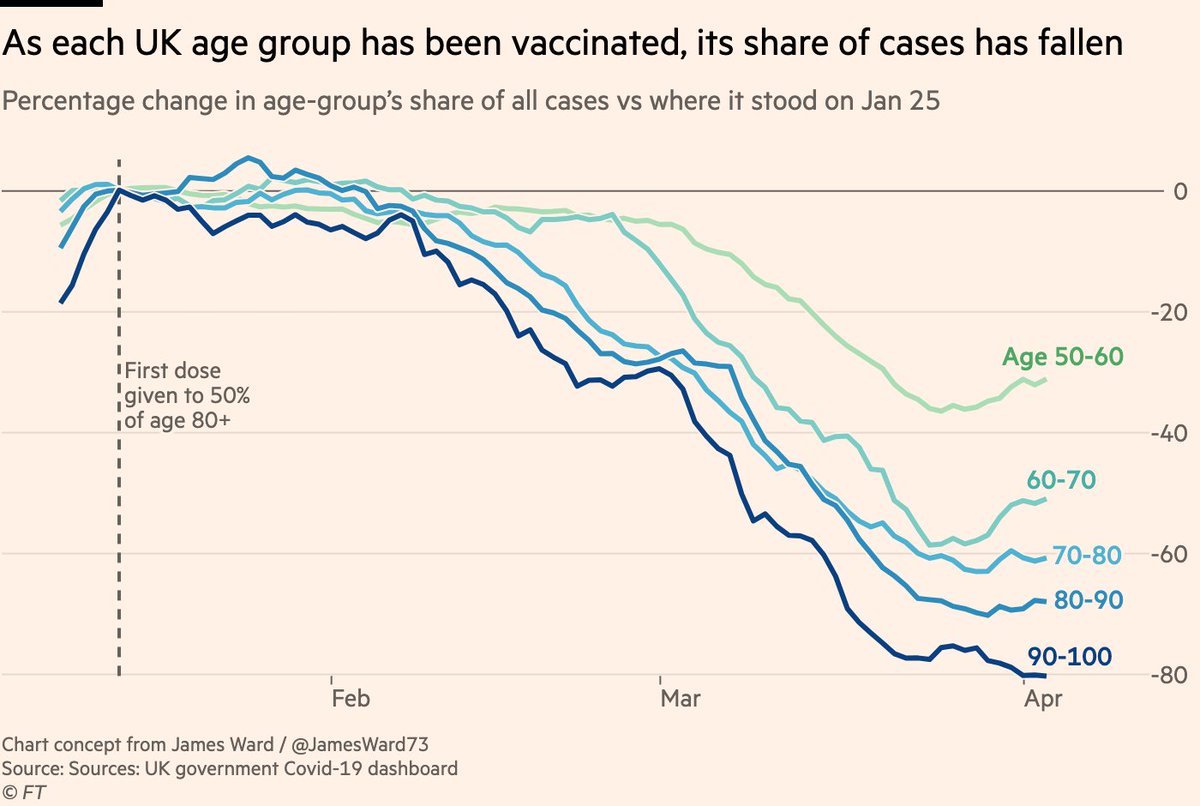
And note how on the original chart, even the least-vaccinated age groups are seeing cases fall. This is also clear in today’s ONS update, which finds no surge among school-aged children.
All suggests vaccines are reducing transmission as well as protecting against infection.
All suggests vaccines are reducing transmission as well as protecting against infection.

But UK began vaccinating in a better position than most countries. B.1.1.7 was already being beaten back by strict winter lockdown (📉 lines both among vaccinated and unvaccinated)
Vaccines were tasked not with fighting a rising outbreak, but with accelerating an ongoing decline
Vaccines were tasked not with fighting a rising outbreak, but with accelerating an ongoing decline
Cross the channel to France, and things look different. There’s still a very clear vaccine effect 💉💪 but rates of cases and admissions have been rising even among the older, most-vaccinated groups.
This is what happens when vaccinations and B.1.1.7 roll out at the same time.
This is what happens when vaccinations and B.1.1.7 roll out at the same time.
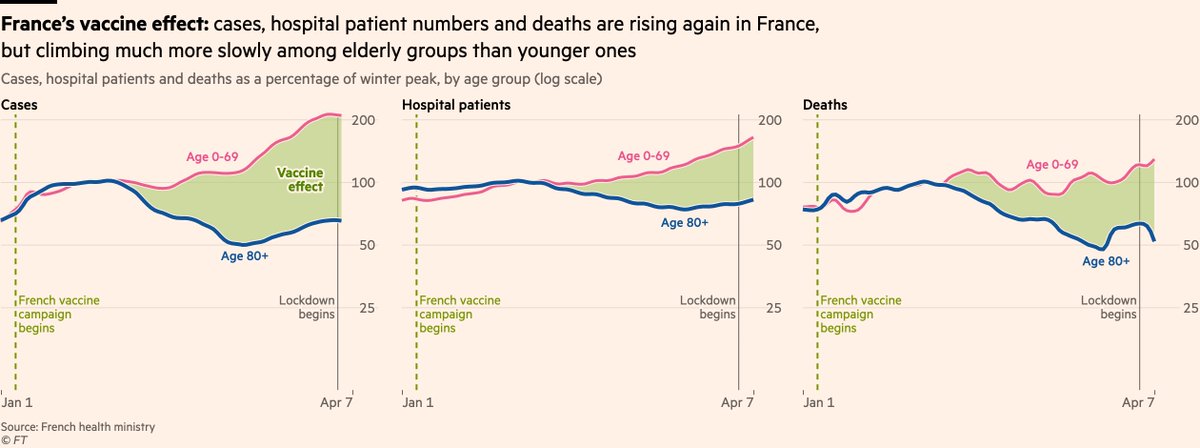
Key thing to note here is there’s nothing to suggest the vaccines are struggling with B.1.1.7 (as we also know from lab data).
The share of cases, admissions and deaths among the elderly (most-vaccinated) population continues to fall, in some cases even accelerating its decline.
The share of cases, admissions and deaths among the elderly (most-vaccinated) population continues to fall, in some cases even accelerating its decline.

But what the French example illustrates is that while a vaccination campaign is still in its early stages, vaccines change the *level* of an outbreak, they don’t change its *direction*.
The vaccinated are far less likely than the unvaccinated to catch Covid or become seriously ill, but if a new variant sends rates rising overall, they’ll rise among the vaccinated too.
In such a scenario the vaccines are very much still working, but they can’t turn back the tide
In such a scenario the vaccines are very much still working, but they can’t turn back the tide
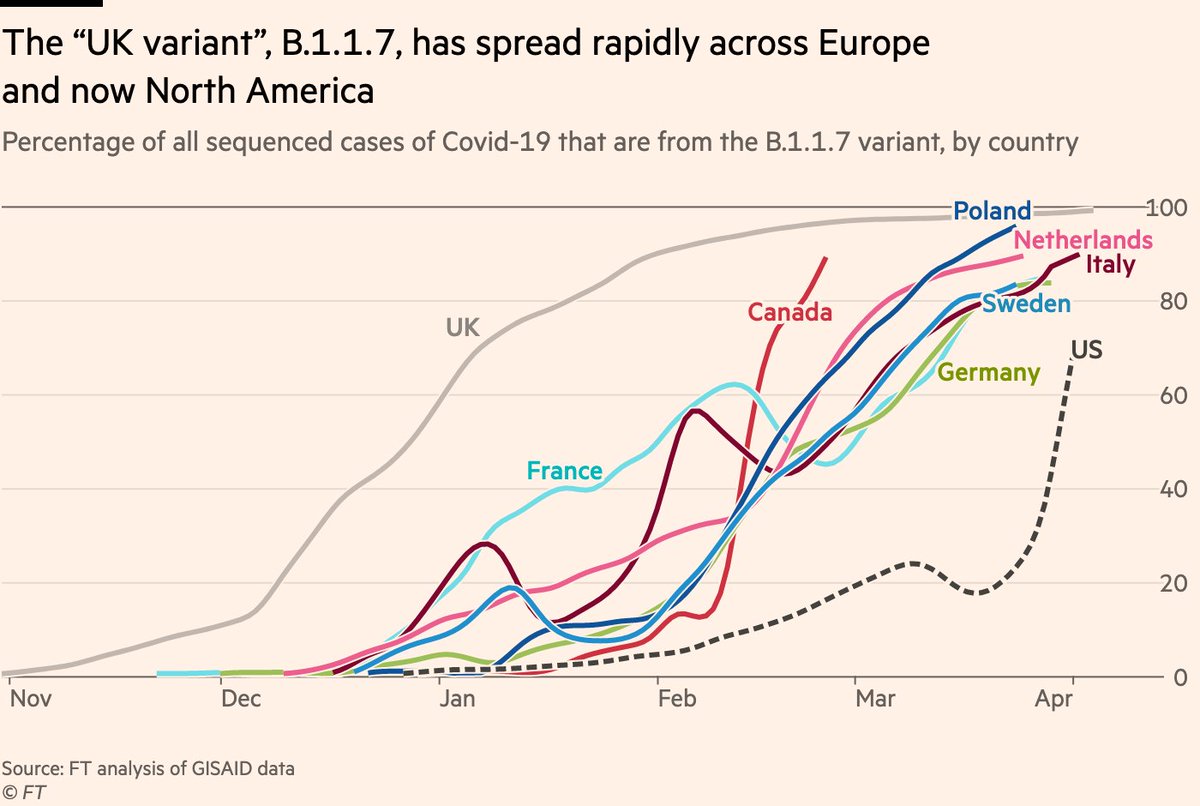
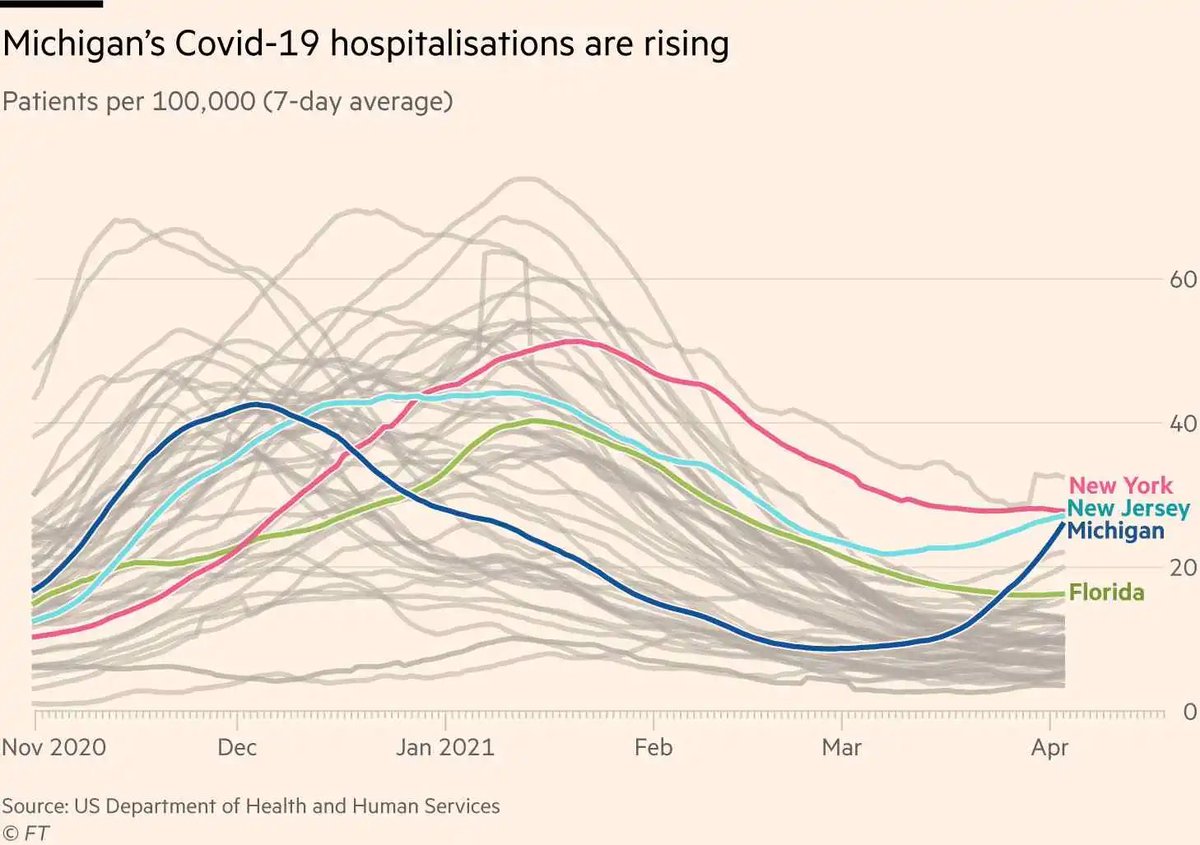
And this brings us to the US, where B.1.1.7 is now surging.
The US is a month or two behind France in this regard, but has a big head-start in terms of vaccination rollout.
The US is a month or two behind France in this regard, but has a big head-start in terms of vaccination rollout.
There’s already a clear and well-established vaccination effect in the US, with hospitalisation rates falling fastest and furthest among the vaccinated.
Cases and deaths look similar (see our story last month ft.com/content/78bb2c…)
Cases and deaths look similar (see our story last month ft.com/content/78bb2c…)

But the steady overall downward trend may be coming to an end.
Michigan is leading a B.1.1.7-induced resurgence, with Covid hospital admissions climbing at a concerning rate. Other states are rising, too (read more here from @christinezhang ft.com/content/805702…)
Michigan is leading a B.1.1.7-induced resurgence, with Covid hospital admissions climbing at a concerning rate. Other states are rising, too (read more here from @christinezhang ft.com/content/805702…)
Going through a B.1.1.7 surge is no fun, and this will be no different in the US than it has been everywhere else
More people will be infected, more will be hospitalised and more will die. But the rapid US vaccination rollout means it will suffer much less than many other places
More people will be infected, more will be hospitalised and more will die. But the rapid US vaccination rollout means it will suffer much less than many other places
Which other places are those?
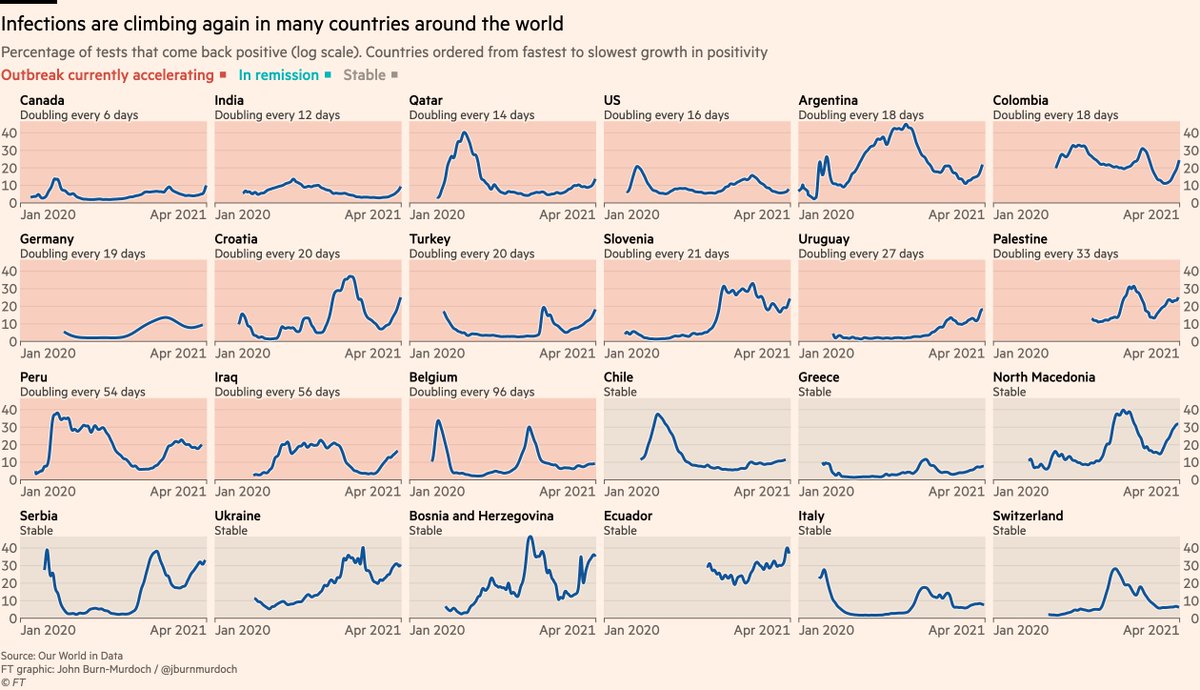
Test positivity rates are currently climbing in dozens of countries around the world, in some cases very rapidly. The US is seeing one of the fastest resurgences globally, but starts with much more vaccine protection than all other countries here.
Test positivity rates are currently climbing in dozens of countries around the world, in some cases very rapidly. The US is seeing one of the fastest resurgences globally, but starts with much more vaccine protection than all other countries here.
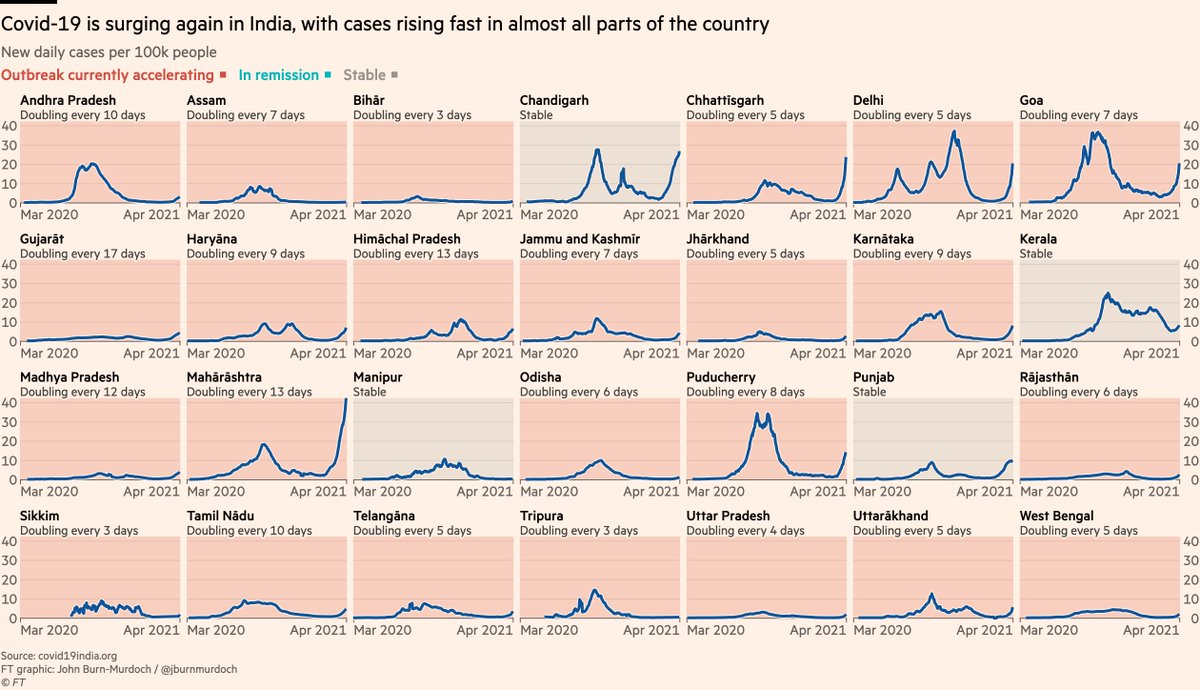
Particularly concerning is India, where some thought herd immunity may have been reached.
It had not.
Case rates are doubling every 5 days in Delhi.
There’s insufficient sequencing to track variants, but it’s likely they’re involved (our story: ft.com/content/38f539…)
It had not.
Case rates are doubling every 5 days in Delhi.
There’s insufficient sequencing to track variants, but it’s likely they’re involved (our story: ft.com/content/38f539…)
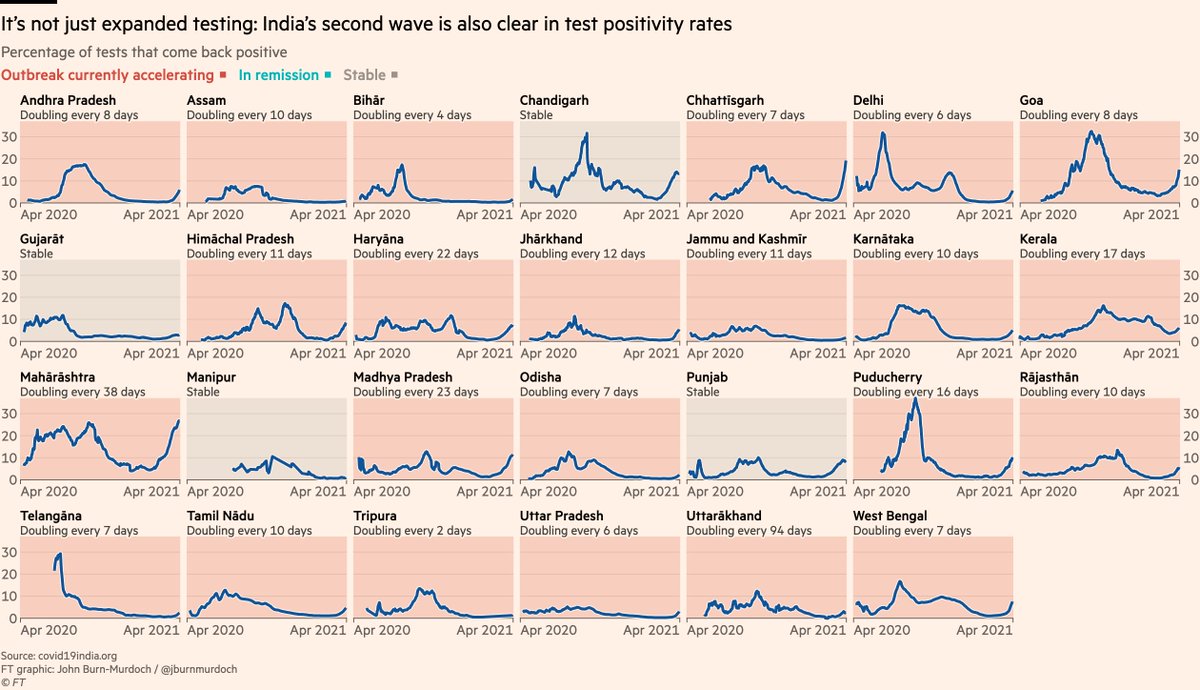
Testing has been expanded in India to keep up with the resurgence, but despite more testing, the percentage of tests coming back positive is still climbing.
Even on this more conservative measure, rates are doubling in under a week in many regions.
Even on this more conservative measure, rates are doubling in under a week in many regions.
Lots of Latin American countries are seeing resurgences, with the Brazilian P.1 variant heavily involved.
This is especially grim news considering the region is already the hardest-hit in the world, with more than a million excess deaths already recorded
This is especially grim news considering the region is already the hardest-hit in the world, with more than a million excess deaths already recorded
https://twitter.com/jburnmurdoch/status/1379499695395995649
A lot of us might have thought we’d be on a relatively steady, linear path out of Covid by now.
The examples of France, India and Brazil show how the variants and or slow vaccine rollout can hinder progress to the finish line.
The examples of France, India and Brazil show how the variants and or slow vaccine rollout can hinder progress to the finish line.
But there are still far more reasons for optimism than pessimism. One example: data from Israel suggests new variants are *not* escaping vaccine-acquired immunity
https://twitter.com/ariehkovler/status/1376789789651955717
So don’t get me wrong, we’re on the way out of this. Several countries are very nearly there.
Here is a new chart that we should all be watching over the coming months, as countries seek to follow Israel’s lead and reach the Covid endgame:
Here is a new chart that we should all be watching over the coming months, as countries seek to follow Israel’s lead and reach the Covid endgame:
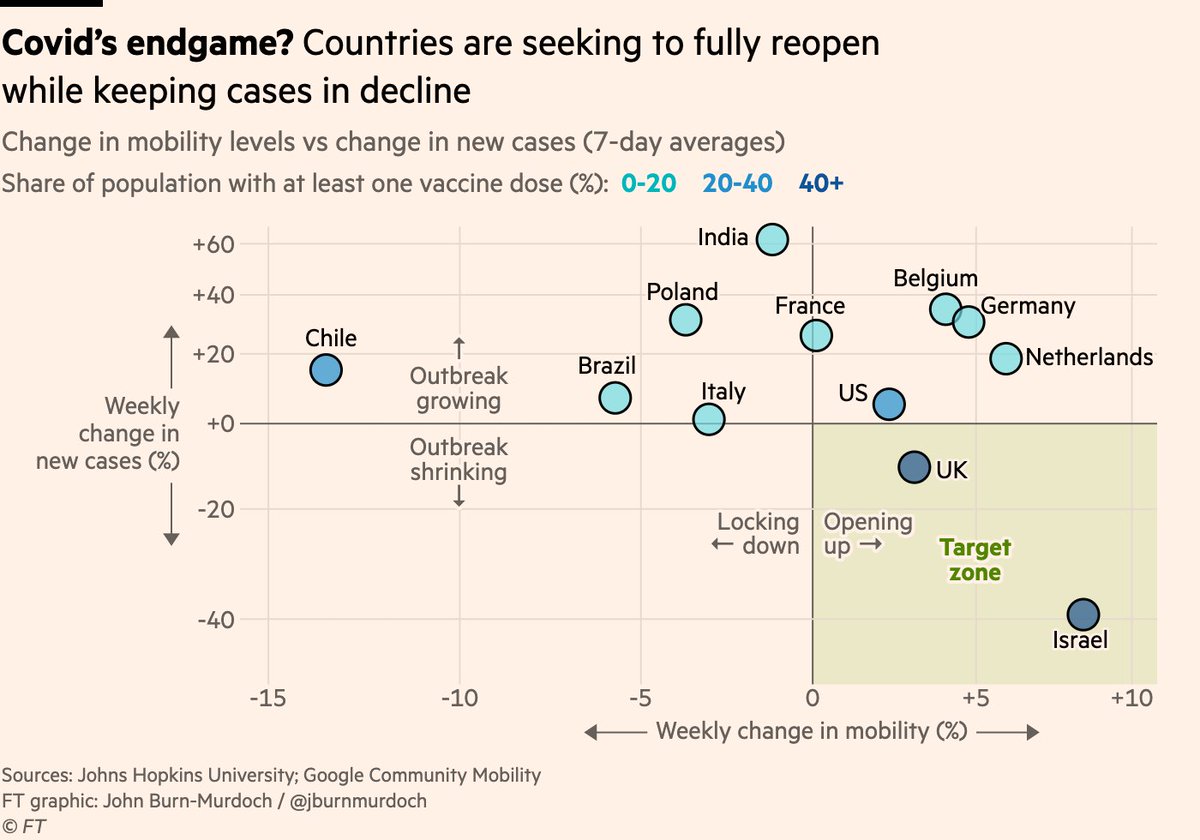
For much of the last year, we’ve lived with restrictions to save lives. What we want now is for societies to reopen *without* risking illness & deaths.
That’s the bottom-right quadrant here: people spending more time socialising at bars & cafés, while cases continue to fall.
That’s the bottom-right quadrant here: people spending more time socialising at bars & cafés, while cases continue to fall.

So there we are. This was a long thread, encapsulating weeks’ worth of our coverage, but I hope it’s been worth the wait.
As usual, do hit me up with any questions and comments, and you can keep track all of the FT’s Covid-19 coverage here: ft.com/coronavirus
As usual, do hit me up with any questions and comments, and you can keep track all of the FT’s Covid-19 coverage here: ft.com/coronavirus
One more note:
There’s been some alarmist reporting that the situation in Chile shows that its vaccination campaign isn’t working
The data suggest otherwise. As in France, rates are rising much more slowly [if at all] among the most-vaccinated age groups
There’s been some alarmist reporting that the situation in Chile shows that its vaccination campaign isn’t working
The data suggest otherwise. As in France, rates are rising much more slowly [if at all] among the most-vaccinated age groups
https://twitter.com/RufusSG/status/1380169345486184450
And here’s our story on Chile ft.com/content/89992b…
Edit: original version of this chart exaggerated the steepness of the US trajectory
https://twitter.com/jburnmurdoch/status/1380548736657600515
• • •
Missing some Tweet in this thread? You can try to
force a refresh


