Prof. Christina Pagel Profile picture
Apr 9, 2021 19 tweets 5 min read Read on X
THREAD on cases in the UK:

TLDR things going in right direction overall but some areas of concern for deprived communities & in schools. 1/19
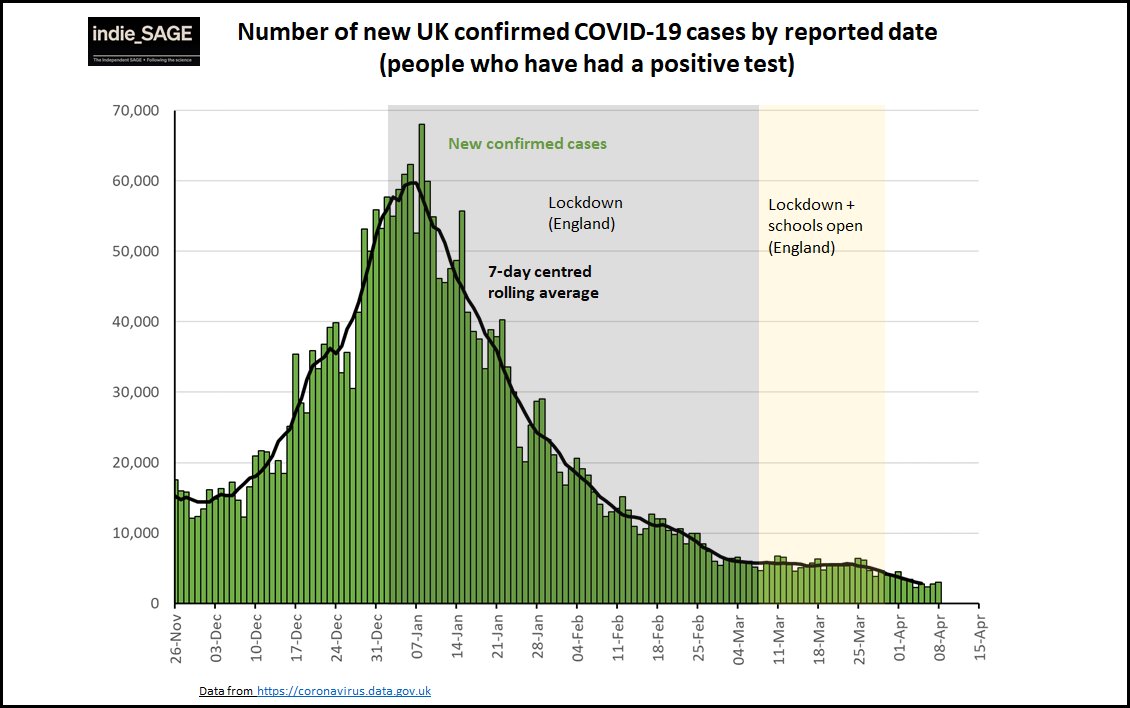
Overall cases in the UK have fallen over last week after a long flat period. Note that tests have fallen too though (mainly lateral flow device (LFD) tests as schools are on holiday). 2/19
The ONS infection survey with data to 3 April - which tests random sample every week - reports new cases going *up* in England, flat in Wales and NI & going *down* in Scotland. 3/19
Cases are now 6-7 times lower than they were at January peak - back to where we were in mid-September last year.

But we're still almost 10x higher than in July last year (our lowest point). 4/19
There is also a difference regionally. The REACT study which tests about 100K people each month, found that while all regions decreased a lot since Feb, Northern regions have the highest rates (2x higher than the South) 5/19
And that difference in cases is also seen in hospital admissions - yes all regions have much reduced admissions (good) but the North has distinctly more than the South. 6/19
Part of the reason the North might be seeing higher cases is that it has more deprived regions than the South.

The most deprived communities have almost 3x as many cases as the least deprived as we leave lockdown. 7/19
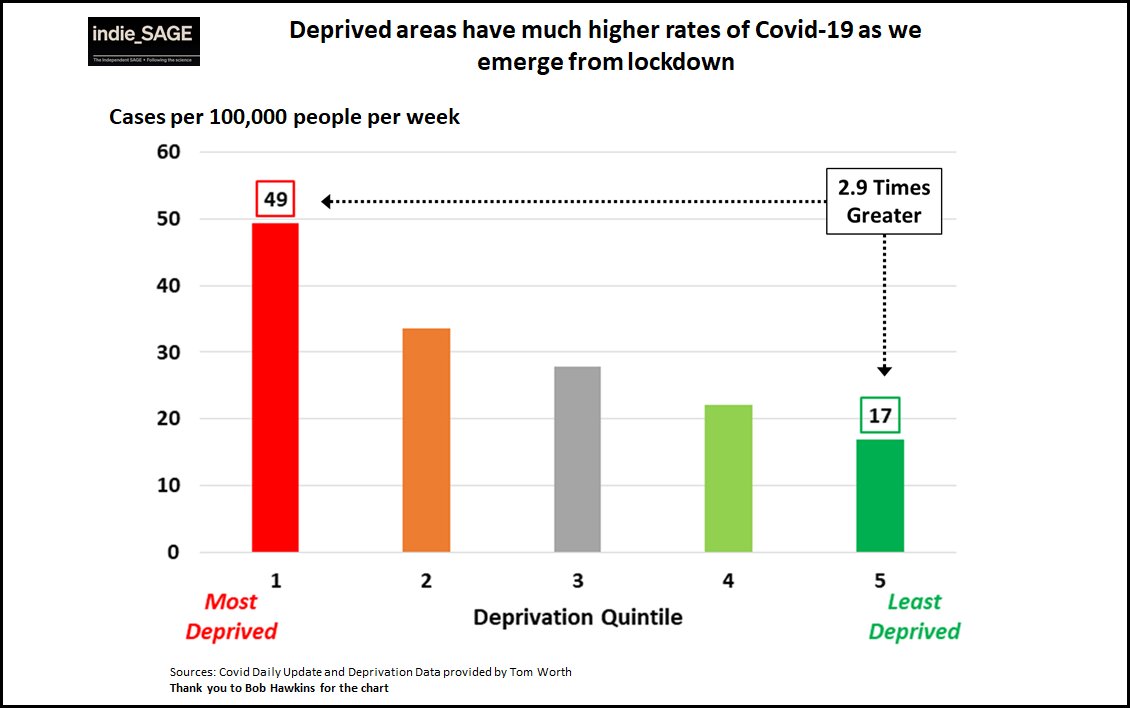
I am worried about inequalities getting worse as we emerge from lockdown, with larger, more serious outbreaks in more deprived areas and concentrated in the North. 8/19
If we look at schools, ONS infection survey released modelled rates of Covid by year of age for each nation.
data here:
ons.gov.uk/peoplepopulati…

Let's look at Scotland which open schools first. 9/19
On 20th February, cases were mostly in working age adults.

On 22nd Feb, Scotland had a phased return to primary schools. 10/19
The ONS modelled estimates for 6th March (yellow), a couple of weeks later, show that while cases drop in older age groups, they have risen in younger ones. 11/19
And by 20th March (red), the modelled estimates are much higher again in younger people while among adults cases keep falling.

Now for some pros and cons... 12/19
Firstly pros: ONS is a random weekly sample so does not rely on people coming forward for testing or whether you have classic covid symptoms (important for kids). It's the best population indicator we have. 13/19
Cons: Number of people sampled in Scotland is not that high and there are quite large uncertainties attached. Plus the following week, ONS shows drops but the most recent week is usually an underestimate in ONS (& they flag it as more uncertain) so I've left it out here. 14/19
Also, ONS infection survey today shows overall cases in Scotland decreasing. This could be cos decreases in adults are offsetting increases in children or inaccuracies in the model or a combo of both 15/19
The confirmed case data in Scotland by age (dependent on testing behaviour and symptoms (in primary school kids)) does show increase in kids after schools open but with a flat trend in late March and declines over Easter holidays (as we'd expect) 16/19
In England, where all schools open on 8 March, ONS sees some increase in children and then a decrease in most recent week in primary school. 17/19
The REACT study shows a clear shift in most cases being in 5-12 year old children in the last two weeks of March in England. 18/19
Cases are likely to decrease during holidays. But by May, with schools open and shops, hairdressers, gyms etc opening we should expect increases. The question is: by how much? in which age groups? are deprived communities going to be hit harder? How much increase is "ok"?! 19/19

• • •

Missing some Tweet in this thread? You can try to force a refresh
 

Keep Current with Prof. Christina Pagel

Prof. Christina Pagel Profile picture

Stay in touch and get notified when new unrolls are available from this author!

Read all threads

This Thread may be Removed Anytime!

PDF

Twitter may remove this content at anytime! Save it as PDF for later use!

Try unrolling a thread yourself!

how to unroll video
  1. Follow @ThreadReaderApp to mention us!

  2. From a Twitter thread mention us with a keyword "unroll"
@threadreaderapp unroll

Practice here first or read more on our help page!

More from @chrischirp

Jul 23
THREAD:
I wrote about Baroness Hallett's Inquiry Module 1 report for @bmj_latest .

She found that there was *never* a plan to keep a pandemic death toll down - I discuss this and what it means going foward.

Main points below: 1/14 Image
The headline most seen is that the UK planned for the wrong pandemic.

While it is true that was far too narrow a focus on a flu pandemic, that is not the most telling bit.

To me the most telling bit, is what the plan did NOT do 2/14


Image
Image
Image
Image
The issue is less the wrong disease, but that there was never a plan to prevent one at all – of any disease type.

The plan was *never* about reducing the number of pandemic deaths. 3/14 Image
Read 14 tweets
Jul 19
Quick thread on current Covid situation in England and Long Covid.

I have Thoughts about the Inquiry Report published yesterday but am still trying to organise them.

TLDR: high Covid levels remain, Long Covid remains 1/11
This wave is not over. While the number of admissions with Covid remains lower than the autumn/winter waves, it has now remained highsh for several weeks.

This means there are a lot of people out there getting sick - and having their work, plans and holidays disrupted. 2/11 Image
Scottish wastewater data to 9 July shows a sharp decrease, suggesting that prevalence might be on its way down.

Obviously Scotland and England can have different dynamics, but it’s the best we’ve got as long as England refuses to analyse its own wastwater. 3/11 Image
Read 12 tweets
Jul 3
THREAD: Given tomorrow's election, I've been thinking about our nation's (poor) health, the wider determinants of health and how these have worsened and what it means for policy....

TLDR: worrying only about NHS & social care is missing the point

let's dive in... 1/25
The UK has a health problem. After steady gains in life expectancy for decades, it flatlined during the austerity years and fell for the first time this century with the Covid pandemic.

The number of people out of work for long term sickness is near record levels. 2/25
There are huge inequalities between rich & poor. Boys born in the most deprived areas can expect to die almost 10 years earlier than their peers in the least deprived areas.

Even worse, they can expect to spend 18 fewer years of their life in good health (52 vs 70 years) 3/25 Image
Read 38 tweets
Jun 4
As ever, I am getting lots of pushback.
Here is a compilation of the European countries I've found with recent wastewater data. Some are going up a bit, some down a bit, some are flat, none are anywhere near previous peaks.
I can't see anything here to be panic anyone. 1/3
Image
I can't find the dashboard for Spain, but others saying it is in a wave. Perhaps it is. England has just had one - the last data we had (a couple of weeks ago from Bob Hawkins) looked as if our wave had peaked.
So, I'm not seeing reason to think things are terrible here! 2/3 Image
Yes there are new variants growing right now. They are not growing faster than JN.1 grew in December and that wave did not end up as bad as feared.
Clearly it remains true that Covid is NOT a seasonal disease (unlike Flu and RSV)
3/3
Read 5 tweets
May 8
Quick thread on the Astra Zeneca (AZ) covid vaccine since it's been in the news today.

TLDR there isn't a new "smoking gun", the AZ vax was one of first and cheapest, it saved millions of lives globally, there are better vax out there now, adapted to new variants 1/9
the AZ vaccine was one of the first approved at the end of 2020, cheaper than Pfizer, and - importantly - easier to administer in lower resource settings as it didn't require super low temperatures for storage 2/9
In most countries it was first rolled out in older adults. As it was rolled out in younger adults, a *very rare*, serious, side effect was noticed - it could cause deadly blood clots

This was spotted quickly and studied. Vax monitoring did its job. 3/9 Image
Read 11 tweets
Apr 2
A short thread on why this is not a scary chart and why all the evidence suggests that there is not much Covid around right now. 1/6 Image
the above chart is recorded covid hospital admissions / reported covid cases. It is close to 100% now *because basically only hospitals can report cases since Feb 2024*

It is to do with changes in case reporting and NOT hospital testing
2/6
In fact hospital testing has been steady since the change in testing a year ago (only symptomatic patients get tested now).

The % of people PCR tested who have Covid is 4% - there is no evidence that there are loads of symptomatic people in hospital being missed. 3/6
Image
Image
Read 6 tweets

Did Thread Reader help you today?

Support us! We are indie developers!


This site is made by just two indie developers on a laptop doing marketing, support and development! Read more about the story.

Become a Premium Member ($3/month or $30/year) and get exclusive features!

Become Premium

Don't want to be a Premium member but still want to support us?

Make a small donation by buying us coffee ($5) or help with server cost ($10)

Donate via Paypal

Or Donate anonymously using crypto!

Ethereum

0xfe58350B80634f60Fa6Dc149a72b4DFbc17D341E copy

Bitcoin

3ATGMxNzCUFzxpMCHL5sWSt4DVtS8UqXpi copy

Thank you for your support!

Follow Us!

:(