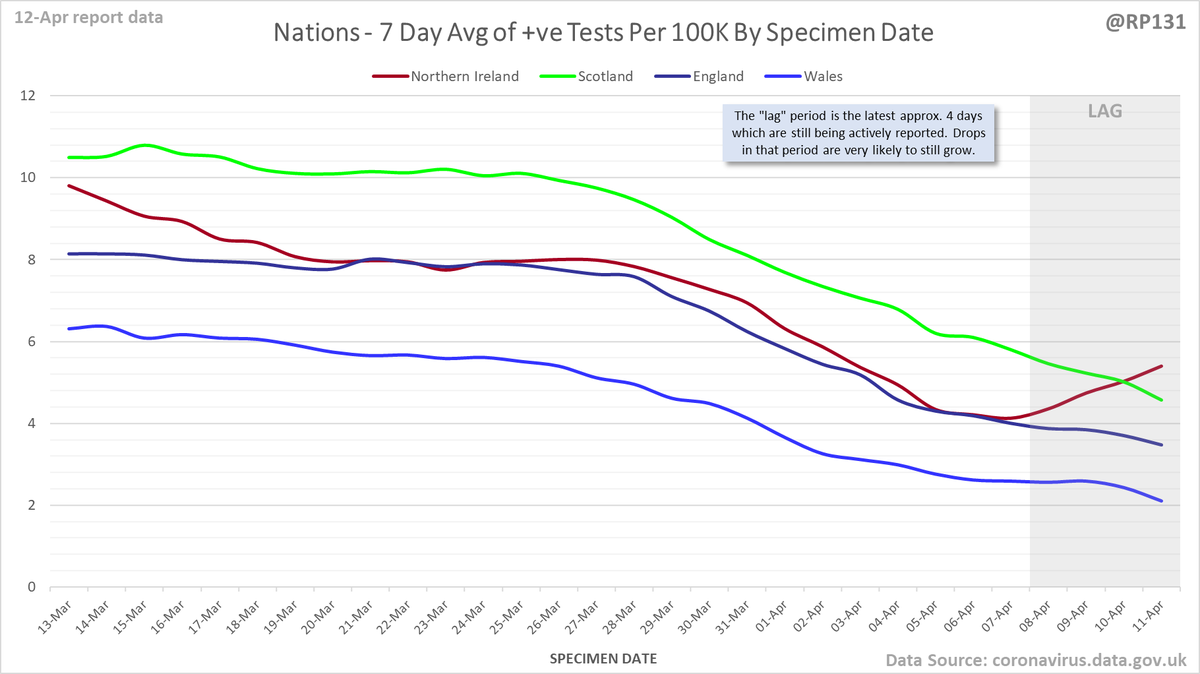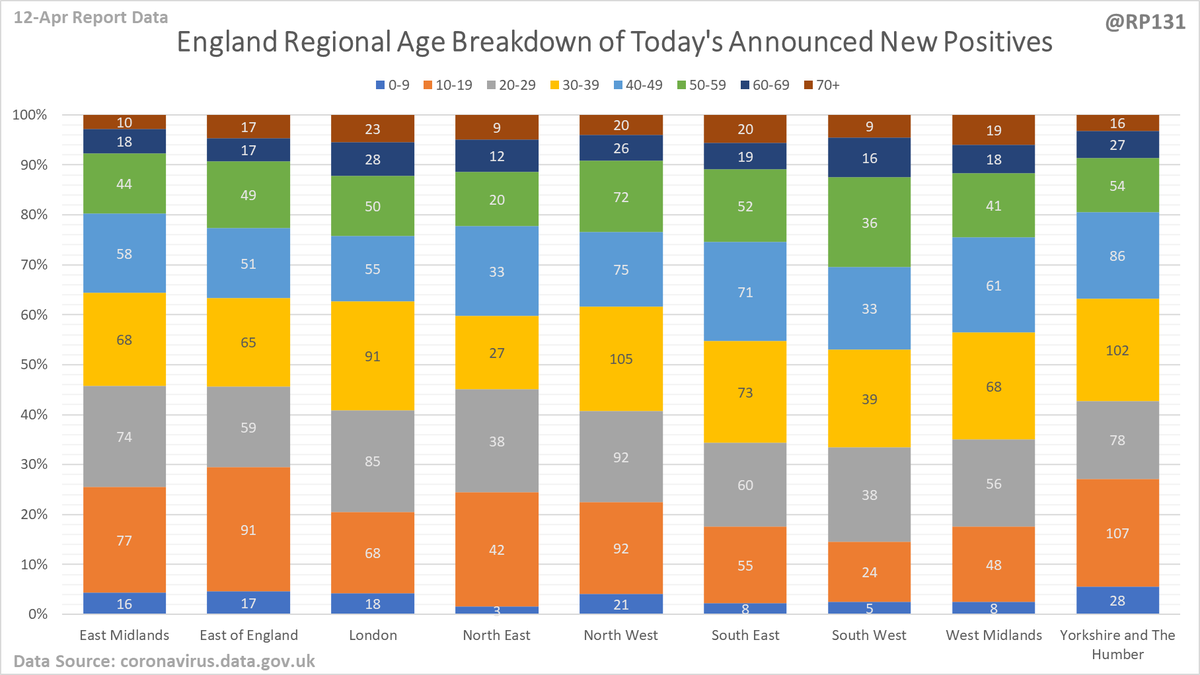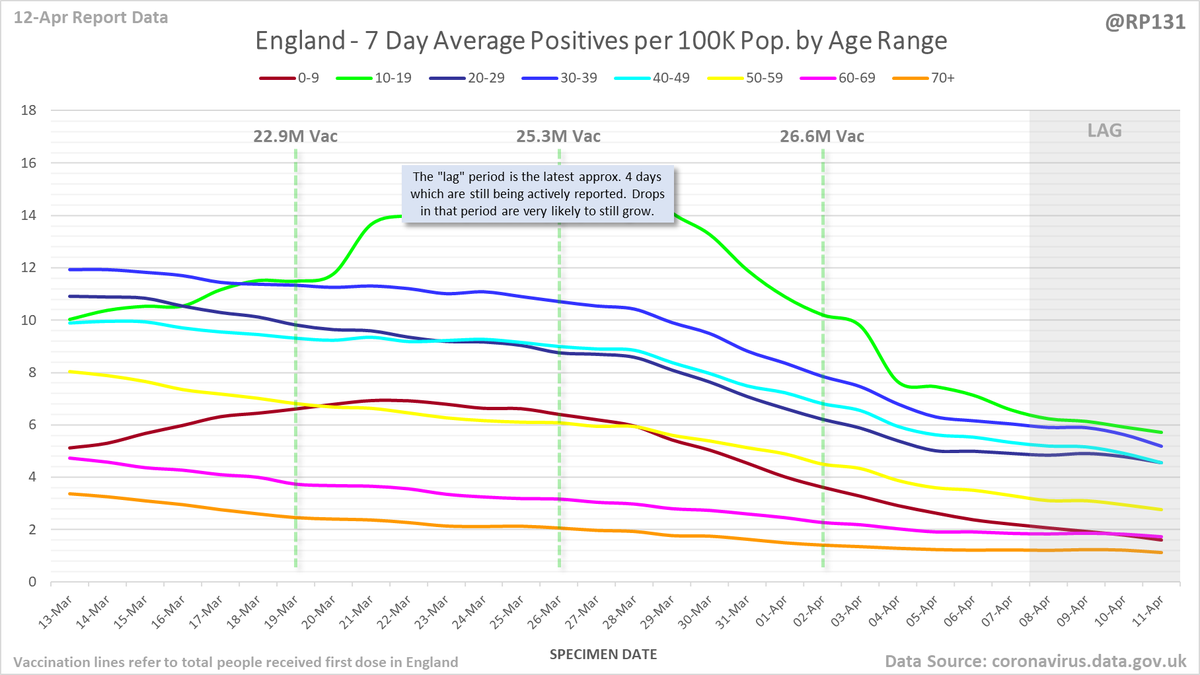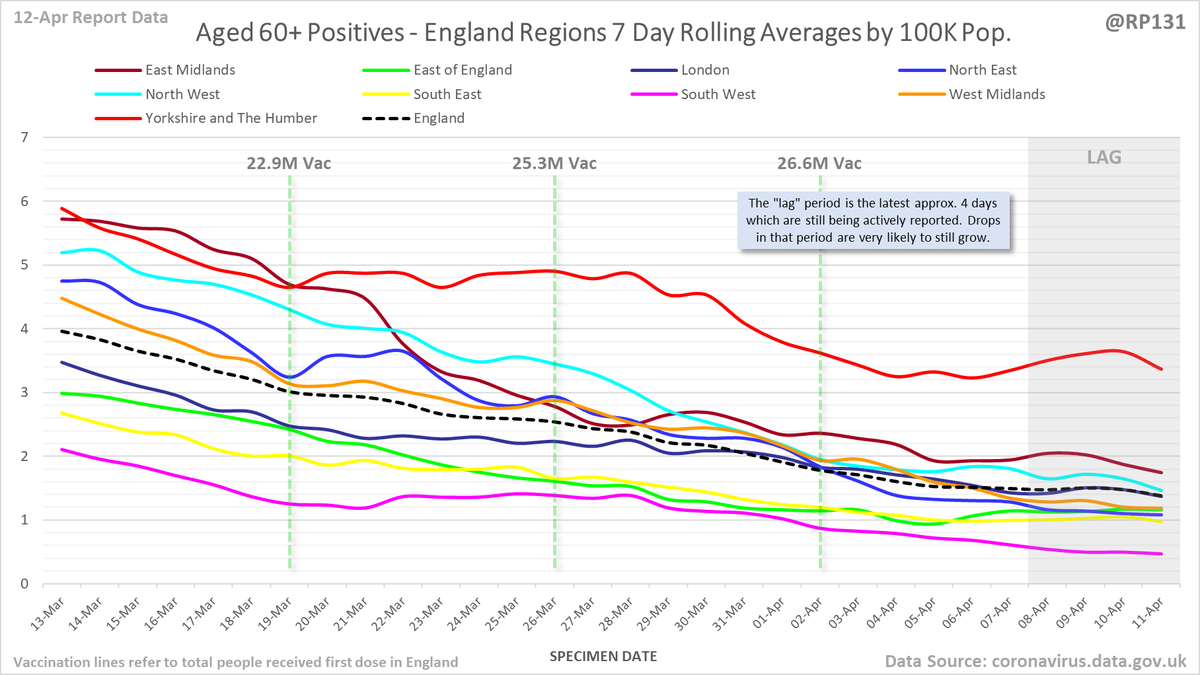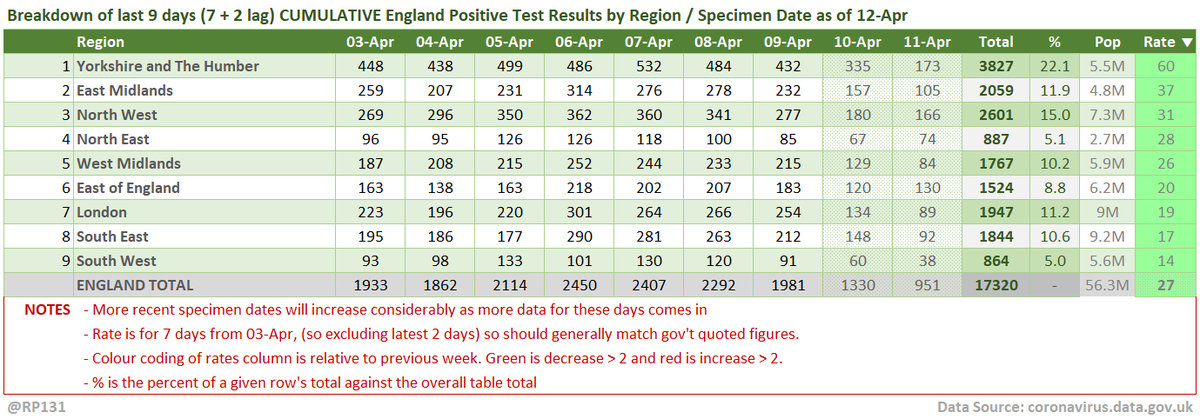
#covid19uk - Detailed positive tests thread. The majority of this thread is a set of views of rolling 7 day average positives per 100K by specimen date. Starting with England regions: 

Some of the more detailed content from this thread has been moved to an external page to try and make the twitter updates a bit more manageable. You can still see the full version here: …ddatashare.s3-eu-west-1.amazonaws.com/Detail/Detail_…
Plus to see how it's shifting, here's the same values but with the same day last week for comparison: 

Rolling weekly comparison of totals up to 3 days ago. I think these have mainly been superseded by the bubble charts but keeping them as I know a few people still like them. 

Full version of these LA compare charts here:
Weekly (Rates): …ddatashare.s3-eu-west-1.amazonaws.com/Week_20210412.…
Weekly (Actual): …ddatashare.s3-eu-west-1.amazonaws.com/WeekActual_202…
Daily (7 Day Avg Rates): …ddatashare.s3-eu-west-1.amazonaws.com/Day_20210412.h…
Weekly (Rates): …ddatashare.s3-eu-west-1.amazonaws.com/Week_20210412.…
Weekly (Actual): …ddatashare.s3-eu-west-1.amazonaws.com/WeekActual_202…
Daily (7 Day Avg Rates): …ddatashare.s3-eu-west-1.amazonaws.com/Day_20210412.h…
• • •
Missing some Tweet in this thread? You can try to
force a refresh
