Intercalation Station Profile picture
Apr 15, 2021 163 tweets 65 min read Read on X
BattCharts by #BattChat
🔋📈🔋📊🔋📉

Aggregating random battery charts, figures, and forecasts from across #batterytwitter Image
1. Li-ion vs SSB

(@BloombergNEF) Image
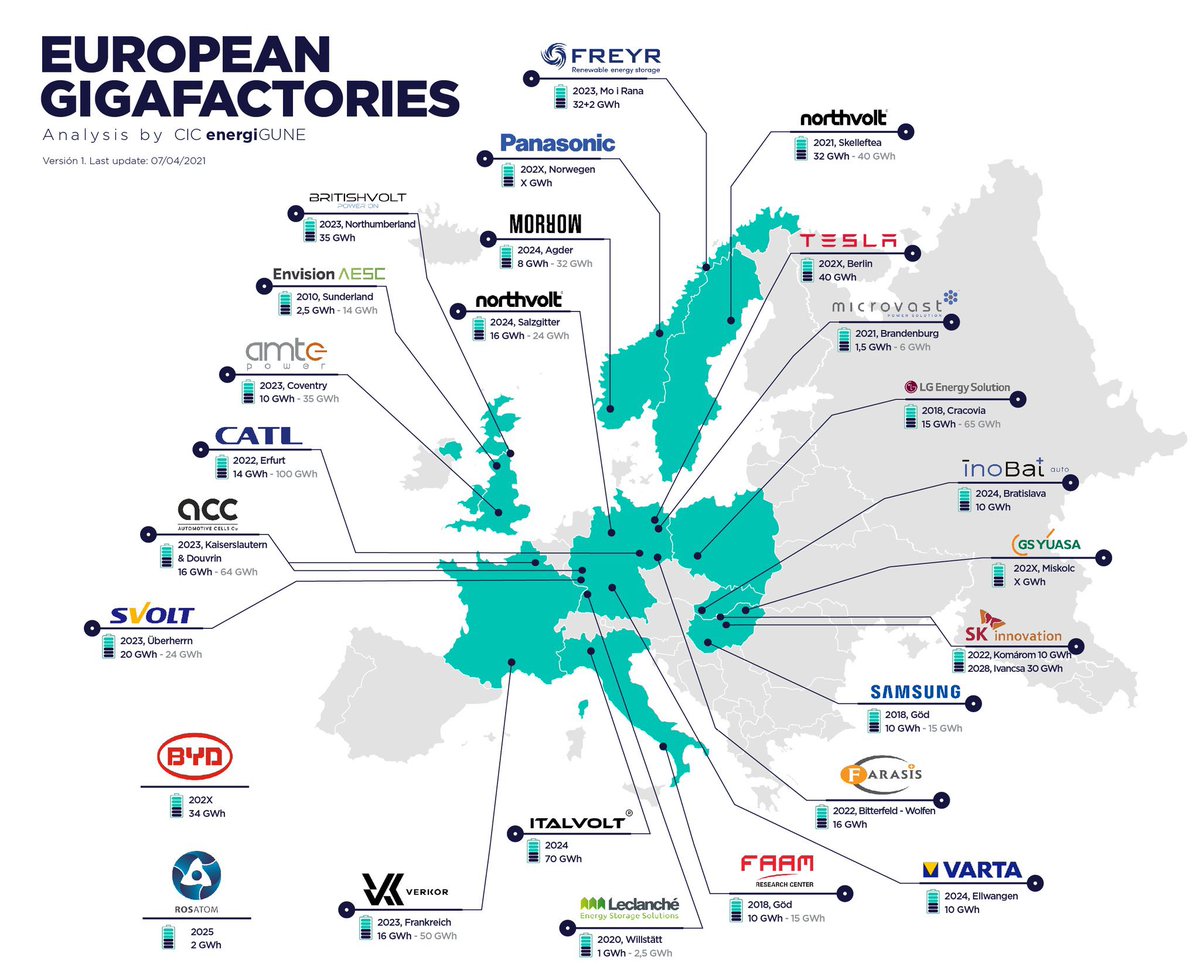
2. Global gigafactory capacity

(VDE Renewables) Image
3. Cathode patent activity

(@EPOorg) Image
4. Recycling by chemistry

(@CircularStorage) Image
5. EV SPACs

(@BloombergNEF) Image
6. Cell producers

(@benchmarkmin) Image
7. Specific energy in academia

(@RInterfaces) Image
8. Cost declines

(@MIT) Image
9. Solid state roadmap

(CAS) Image
10. EV charging rates

(@rhomotion) Image
11. Top patent applicants

(@EPOorg) Image
12. Cathode chemistries

(@VWGroup) Image
13. Supply chain representation

(@Roskill_Info) Image
14. Nickel demand

(@Roskill_Info) Image
15. Chemistry forecast

(@FaradayInst) Image
16. Recycling capacity

(@CircularStorage) Image
17. Energy storage deployment

(@WoodMackenzie) Image
18. Li-ion build out

(@benchmarkmin) Image
19. Lithium production vs demand

(@BloombergNEF) Image
20. Supply chain participation

(@Roskill_Info) Image
21. Material shopping routes

(@BloombergNEF) Image
22. European gigafactories

(@energigune_brta) Image
23. Battery components

(@Energystorage4) Image
24. China LFP

(@AdamasIntel) Image
25. Power vs energy

(@theapcuk) Image
26. Value chain

(@theapcuk) Image
27. European recyclers

(@theapcuk) Image
28. Solid state cost savings

(@BloombergNEF) Image
29. Market share scenarios

(@UniLeidenNews) Image
30. Commercial 18650s

(BatteryBrunch) Image
31. QS timeline

(@QuantumScapeCo) Image
32. LFP production expansion

(WeChat) Image
33. Carbonate prices

(@benchmarkmin) Image
34. Carbonate price forecast

(@jpmorgan) Image
35. New friends

(@IntercalationSt) Image
36. Gigafactory forecasts

(@benchmarkmin) Image
37. Li-S cost

(@SUSTechSZ) Image
38. Production chain

(MEET Battery Research Center) Image
39. European recycling

(@CircularStorage) Image
40. Pack chemistries

(@McKinsey) Image
41. Value add

(ITC) Image
42. Co and Li resources

(@FaradayInst) Image
43. Cobalt production

(@benchmarkmin) Image
44. Solid state publications

(@webofscience) Image
45. Solid state comparison

(@FaradayInst) Image
46. Cell materials & manufacturing roadmap

(@theapcuk) Image
47. Modules & pack roadmap

(@theapcuk) Image
48. Grid storage chemistries

(@WoodMackenzie) Image
49. Raw material cost

(@RockyMtnInst) Image
50. Long duration storage

(@Joule_CP) Image
51. EV pack sizes

(RKEquity) Image
52. North American gigafactories

(@energigune_brta) Image
53. EV survey

(@OliverWyman) Image
54. OEM solid state timelines

(@Yole_Dev) Image
55. Solid state forecast

(@Yole_Dev) Image
56. Solid state step changes

(@Yole_Dev) Image
57. Global EV stock

(@IEA) Image
58. EV models

(@IEA) Image
59. Heavy duty vehicles

(@IEA) Image
60. Uses for lithium

(@StatistaCharts) Image
61. Material demand growth

(@UBS) Image
62. Material demand rise

(@FT) Image
63. Pack cost sensitivity

(@UBS) Image
64. Cost projections

(@BloombergNEF) Image
65. Patent filings per technology

(@adlittle) Image
66. Batteries installed

(@BloombergNEF) Image
67. Focus areas

(@adlittle) Image
68. Unmet requirements

(@adlittle) Image
69. NMC811 comparison

(@McKinsey) Image
70. Performance comparison

(@adlittle) Image
71. Material market projections

(@adlittle) Image
72. NMC811 costs

(@McKinsey) Image
73. EV lifecycle emissions

(@BloombergNEF) Image
74. Battery recycling sources

(@li_cycle) Image
75. Cost of mass market Li-ion

(@SilaNanotech) Image
76. Intercalation vs conversion

(@SilaNanotech) Image
77. Cobalt prices

(@FT) Image
78. Pack content breakdown

(@VW) Image
79. OEM electrification

(@IEA) Image
80. EV mineral usage

(@IEA) Image
81. 2040 mineral demand growth

(@IEA) Image
82. Spent Li-ion batteries

(@IEA) Image
83. Recycled vs primary battery supply

(@IEA) Image
84. EV life-cycle emissions

(@IEA) Image
85. NMC622 emissions footprint

(@BloombergNEF) Image
86. Mineral producing countries

(@IEA) Image
87. Mining commitments vs demand forecast

(@IEA) Image
88. EV battery capacities

(@jpmorgan) Image
89. EV auto industry

(@jpmorgan) Image
90. Battery and EV stock surge

(@jpmorgan) Image
91. US energy storage deployments

(@jpmorgan) Image
92. Top EV prices

(@jpmorganImage
93. Li-ion learning curve

(@jpmorgan) Image
94. EV fires

(@AccureBattery) Image
95. EV & battery price fall

(@ARKInvest) Image
96. Automakers and cell manufacturing

(@BloombergNEF) Image
97. EV battery installations

(SNE Research) Image
98. US battery market

(@GrandViewInc) Image
99. DoD vs capacity loss

(@UofSC) Image
100. 2020 EV forecasts from 2014

(@RITtigers) Image
101. FCV vs BEV Sales

(@BloombergNEF) Image
102. Electric flight

(@EnergyImpact_) Image
103. 2025 production capacity

(@BloombergNEF) Image
104. Long duration characteristics

(@RockyMtnInst) Image
105. Cathode evolution

(@benchmarkmin) Image
106. Geothermal brine Li extraction

(@VulcanEnergyRes) Image
107. US import reliance

(@USGS) Image
108. EV cost parity

(@BloombergNEF) Image
109. LiB production ramp up

(@FraunhoferISI) Image
110. 18650 vs 21700

(@RWTH) Image
111. Pouch vs prismatic vs cylindrical

(Thielmann2017) ImageImage
112. Learning curves for large and small formats

(@FraunhoferISI) Image
113. Battery manufacturing

(@iScience_CP) Image
114. Published storage costs

(@NREL) Image
115. LIB production process

(@NREL) Image
116. Material cost breakdown

(@NREL) Image
117. Cost vs Manufacturing

(@CarnegieMellon) Image
118. Li-ion roadmap

(Sharova2020) Image
119. Natural vs synthetic graphite

(Sharova2020) ImageImage
120. Capacity retention

(Preger2020) Image
121. DC fast charging

(@InsideEVs) ImageImage
122. Regional costs

(@BloombergNEF) Image
123. Solid-state production changes

(Sharova2020) Image
124. Li-metal timelines

(@benchmarkmin) Image
125. Li-S targets

(@JCESRHub) Image
126. Expected developments

(@energigune_brta) Image
127. Costs vs Manufacturing

(Sakti2015) Image
128. Efficiency in passenger EVs

(@transenv) Image
129. More cost projections

(@NREL) Image
130. Formation and aging

(Sharova2020) Image
131. EV sales

(@BloombergNEF) Image
132. Demand projections comparison

(@argonne) Image
133. Cell manufacturing capacities

(@benchmarkmin) ImageImage
134. The supply chain

(@ENERGY) Image
135. Why recycle Li

(@argonne) Image
136. Gigafactory energy consumption

(Sharova2020) Image
137. Reject rates

(Sharova2020) Image
138. Power vs energy

(Enpolite) Image
139. Storage temperatures

(Enpolite) Image
140. North America

(@LMCAutomotive) ImageImage
141. Cell formats

(@LMCAutomotive) ImageImage
142. Cathode types

(Andre2015) Image
143. Cell & pack energy densities

(Ue2020) Image
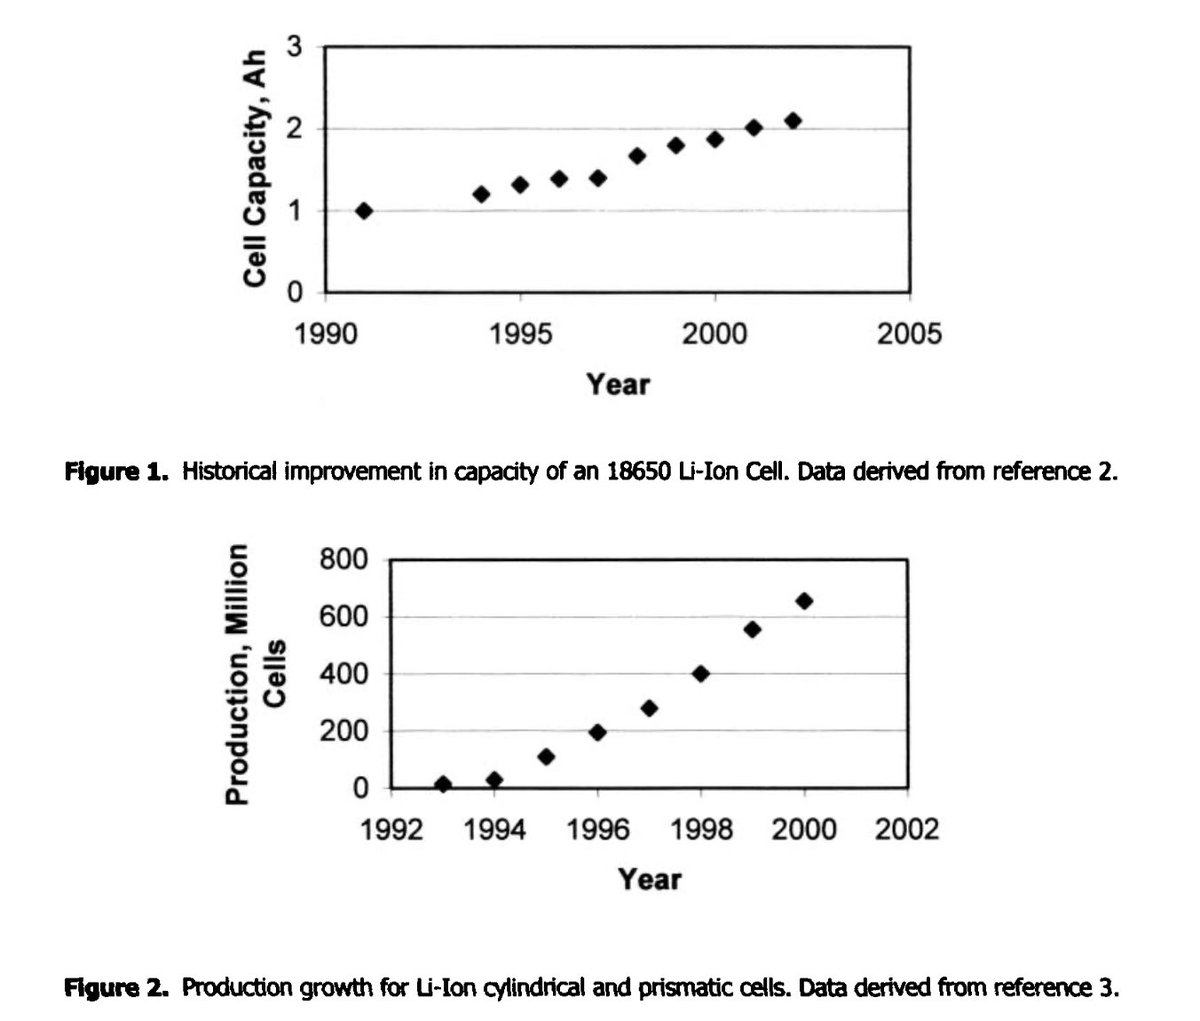
144. Historical capacity & manufacturing trends

(Schalkwijk2002) Image
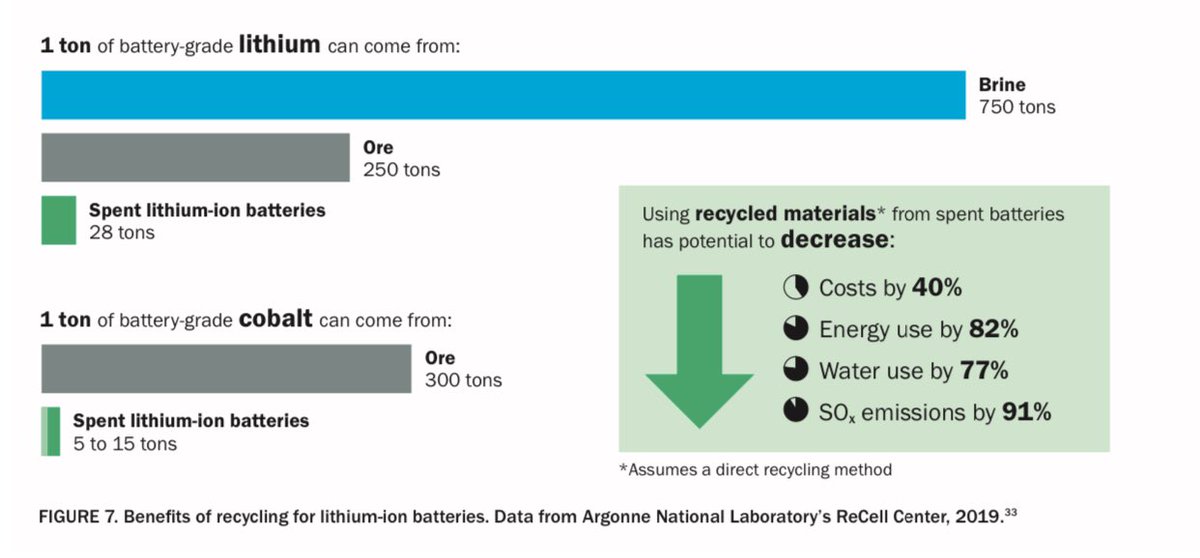
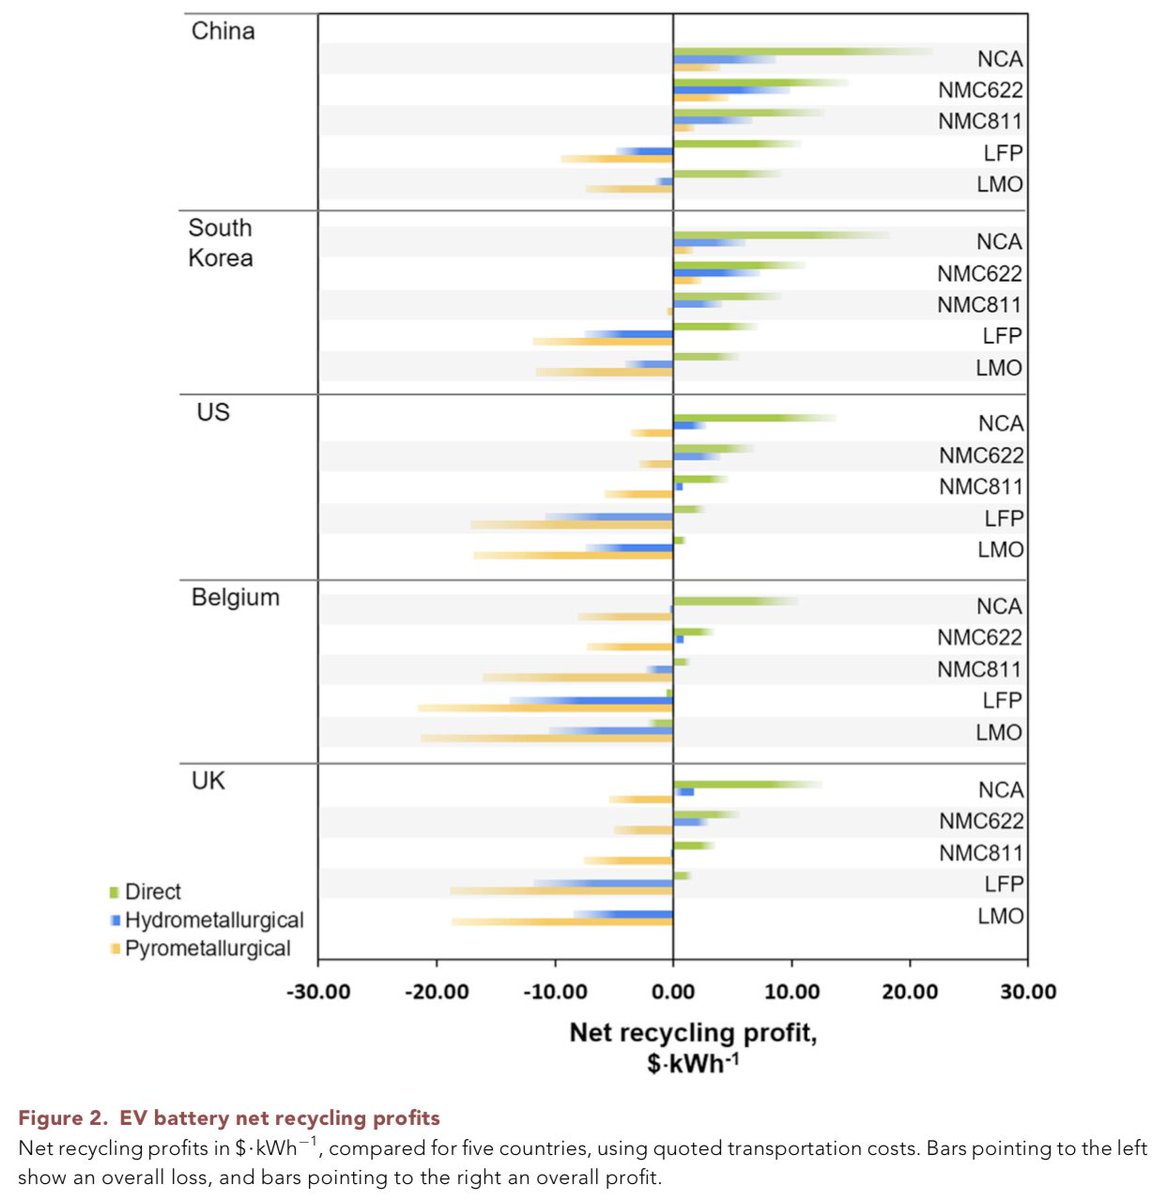
145. EV battery recycling

(Lander2021) Image
146. Gigafactory chemistry mix

(@MatthiasSimolka) Image
147. Chemical cost of energy storage

(Li2017 @Joule_CP) Image
148. Sodium-ion batteries

(Tapia-Ruiz2021 @NaNexgen) ImageImage
149. Na-ion vs Li-ion

(CATL) Image
150. Energy storage vs duration

(@LuxResearch) Image
151. Battery manufacturing capacities

(@BloombergNEF) Image
152. Value chain profitability

(@joewilliams104) Image
153. Batteries across electronics/EV/industrial sectors

(Avicenne) Image
154. History of Panasonic batteries

(@panasonic) Image
155. Deployed cells

(@ZennRoland) Image
156. Battery manufacturers

(@VisualCap) Image
157. Historical specific energy development

(Masias2021) Image
158. Active material performance targets

(Masias2021) Image
159. Pack vs cell

(Masias2021) Image
160. Energy storage landscape

(@Cheesecake_CEL) Image
161. Global production capacity

(@Deloitte) Image
162. Raw material requirements for energy technologies

(@VisualCap) Image

• • •

Missing some Tweet in this thread? You can try to force a refresh
 

Keep Current with Intercalation Station

Intercalation Station Profile picture

Stay in touch and get notified when new unrolls are available from this author!

Read all threads

This Thread may be Removed Anytime!

PDF

Twitter may remove this content at anytime! Save it as PDF for later use!

Try unrolling a thread yourself!

how to unroll video
  1. Follow @ThreadReaderApp to mention us!

  2. From a Twitter thread mention us with a keyword "unroll"
@threadreaderapp unroll

Practice here first or read more on our help page!

Did Thread Reader help you today?

Support us! We are indie developers!


This site is made by just two indie developers on a laptop doing marketing, support and development! Read more about the story.

Become a Premium Member ($3/month or $30/year) and get exclusive features!

Become Premium

Don't want to be a Premium member but still want to support us?

Make a small donation by buying us coffee ($5) or help with server cost ($10)

Donate via Paypal

Or Donate anonymously using crypto!

Ethereum

0xfe58350B80634f60Fa6Dc149a72b4DFbc17D341E copy

Bitcoin

3ATGMxNzCUFzxpMCHL5sWSt4DVtS8UqXpi copy

Thank you for your support!

Follow Us!

:(