Le he seguido dando vueltas a la exposición de motivos de la reforma tributaria. La conclusión a la que estoy llegando es que como dice el refrán "de eso tan bueno no dan tanto". Los supuestos beneficios de la RT son, en un su mayoría, resultado de mezclar 🍐con 🍎. Otro 🧵
La defensa de los méritos de la reforma se centra en este cuadro. Este muestra que el 10% más pobre del país aumenta sus ingresos un 68% mientras que el 10% mas rico reduce sus ingresos en un 4% en 2023. Redistribución!!!
El problema es que esas cifras que muestran una supuesta redistribución no están calculadas en el mismo escenario. Son resultado de la comparación de la situación de los mas pobres y los mas ricos en dos escenarios diferentes. 🍐y 🍎.
Y que tan diferentes son esos escenarios? Pues son el equivalente a comparar una situación donde todo sale bien, incluyendo que la selección Colombia gane la Copa del Mundo 2022, a que todo salga muy mal, incluyendo que Santa Fe salga siempre campeón en el torneo nacional.
El escenario CPL (donde todo sale bien) incluye (al menos) tres supuestos claves. Primero, que la reforma, gracias a confianza inversionista (¡) disminuye tasas de interés. Segundo, inversión publica aumenta PIB potencial. Tercero, un mercado laboral al revés.
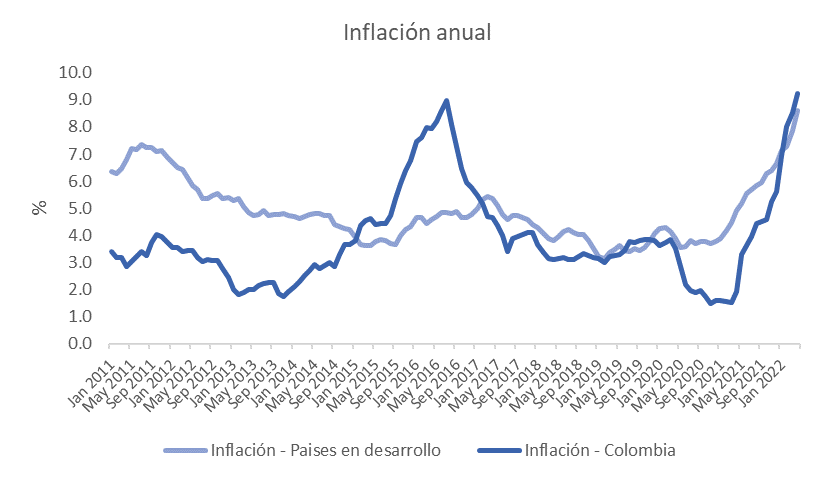
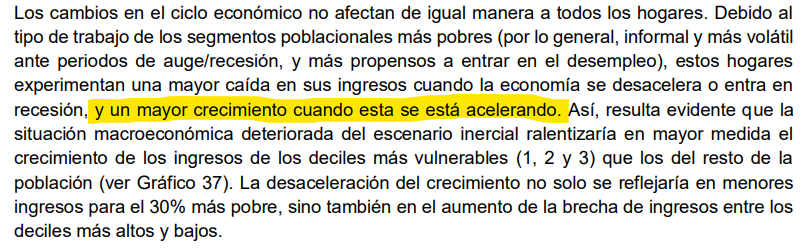
Como así que al revés? Modelo pareciera asumir una situación donde los mas vulnerables son los primeros en perder su empleo e ingresos (correcto) pero que en una recuperación son los primeros en recuperar empleo e ingresos (incorrecto). Normalmente son los últimos.
Y porque esto es importante? Porque entre menores tasas de interés, crecimiento turbo cargado y un mercado laboral que privilegia a los mas vulnerables (y tradicionalmente menor preparados) es lo que explica el rápido crecimiento de ingresos de deciles mas bajos en CPL.
Que pasa mientras tanto en el escenario Santa Fe (donde sale todo mal). Tasas de interés mas altas, default de deuda (ya saben, el castrochavismo 2022 no se lleva bien con los mercados), menor inversión pública, menor PIB potencial, y menor empleo.
El famoso 68% de ingresos mas altos sale de comparar el ingreso del decil mas bajo en los escenarios CPL y Santa Fe. Es decir que mezcla tres cosas. Además de transferencias, incluye diferencias de crecimiento y empleo entre ambos escenarios extremos para el decil 1.
El crecimiento y empleo parecen representar al menos las dos terceras partes de ese 68% si comparamos escenario CPL con inercial gasto (proxy Santa Fe) en 2023. El ultimo 30% se explicaría por transferencias y empleo (sin modelo no es posible separar efectos y deciles).
Al final del día, como el 68% sale de esta cuestionable comparación entre 🍐y 🍎, con muchos supuestos detrás de cada escenario, las cifras de impacto distribucional y de pobreza presentadas en la EM deben ser desagregadas con cuidado.
Esta desagregación requiere dos cosas. Primero, modelo utilizado para las proyecciones de crecimiento, con todos sus supuestos, de tal manera que pueda ser replicado. Segundo, como lo hace el CBO en Estados Unidos, hacer un análisis estático que aislé impacto distributivo de RT.
Ese análisis estático probablemente muestre efecto positivo del programa de transferencias. Sin embargo, no va a ser el citado 68% sino una cifra mucho menor. Esto tiene implicaciones importantes para lo que pase en otro extremo de distribución del ingreso.
Hay otro par de cosas que se me quedan en el tintero para otro dia. De momento, lo que se necesita es que el MinH comparta su modelo y cifras para poder debatir en igualdad de condiciones, con transparencia y evitar confundir al público.
Actualización de la discusión sobre la base de nueva información:
The Gabon debt swap has been getting a ton of good press. However, now that we have more (but not all!) information about it, this deal is as questionable as those that preceded it 🧵
First, transparency. Its not OK for bilateral lenders to fail to disclose contracts. Its not OK for commodity traders to do the same. So then why are we giving a free pass to recent debt for nature swaps when they fail to meet the most basic disclosure standards?
Lack of transparency has serious implications. Most articles have been quoting the bond coupon as the cost of interest for Gabon (6.095%). This is wrong. The actual cost for the country is the interest rate on the loan that is used as collateral.
Debt challenges in developing countries remain contained in "pockets" according to the IMF WEO.
UNCTAD challenges this notion in its TDR update.
We are already in a debt and development crises which is about to worsen due to bad policy prescriptions (h/t Garcia Marquez) 🧵
Net debt resource transfers (i.e. a country pays more than it receives) are an increasingly serious problem. Middle-income countries without access to adequate multilateral support are the most vulnerable to a dynamic that is the herald of debt distress @Brad_Setser@MarinaZucker
Persistent capital outflows and raising borrowing costs are affecting most developing countries. Since 2019, the number of developing countries with spreads above 1000 basis points has increased from 4 to 19.
Es sabado, el verano ha llegado y me quedo un poco de tiempo libre. Como contextualizar los movimientos de indicadores en Colombia 🇨🇴 en la ultima semana desde una perspectiva global? 🧵
1. Estamos en un contexto de aceleración de inflación a nivel global, la cual ha llegado a los niveles mas altos de ultima decada (shock de oferta + commodities). Esta dinamica esta poniendo presión sobre bancos centrales.
2. Bancos centrales estan respondiendo de manera agresiva a nivel global (incluyendo BanRep). Sin embargo, inflación esta aumentando a un ritmo mas rapido (tasas reales negativas). Ello se traduce, entre otras cosas, en presión sobre el tipo de cambio nominal.
There is a LOT to cover in the IMF Ex-Post Evaluation of the Argentina program (it is a 135 pg document after all). Ill try to focus on a couple of key issues, including the decision making behind it and the EAL framework 🧵
The key issue raised by the EPE relates to the uniformity of treatment. The proper functioning of the multilateral system relies on adherence to rules. All countries and multilateral institutions should observe and respect the same rules. This is not what happened in 2018.
In 2018 the IMF proceeded to approved its largest loan in history while: a. allowing borrower to set policy red lines and timeline for implementation (following domestic political priorities); b. relying on borrower optimistic macro projections to set the program baseline.
New @eurodad analysis of IMF Surcharges: What are they, which countries pay them and why they must be eliminated in the context of the Covid-19 crisis 🧵 eurodad.org/a_guide_to_imf…
TL/DR: IMF surcharges are a system of fees on loans which place an unfair burden on vulnerable countries that are in need of financial support. 14 countries are set to pay US$ 7.9 billion in surcharges. This is 10 times more what rich countries have given for debt cancellation.
IMF surcharges apply to countries with GRA loans above 187.5% of IMF quota. Out of the 52 countries with IMF loans, a total of 14 countries with a total of US$ 96.1 billion are subject to surcharges.
Belize is in the process of negotiating a so-called green debt restructuring of an outstanding US$ bond. While the deal is being heralded as "groundbreaking" and a "good solution" there are plenty of reasons to be skeptical about the benefits of the deal.
The deal involves the provision of financing by @nature_org to buyback a bond worth US$ 526 million (which has already been restructured 3 times) on 55 cents on the dollar. As part of the agreement, Belize commits to fund a marine conservation trust (US$ 23 million).
The proposed restructuring is unlikely to restore debt sustainability. As a result, current bond holders might end up getting a better deal than under a comprehensive debt restructuring under an IMF program. This might explain why key bondholders are keen on this deal.