
Nestle Annual Report Notes (Motilal Oswal)🧵
*Some good charts in there*
Market cap: 164,738 crores.
Revenues: 13,350 crores.
P/E: 79.11
P/B: 81.58
Dividend yield: 1.17%
Here we go👇
@dmuthuk
1/25
*Some good charts in there*
Market cap: 164,738 crores.
Revenues: 13,350 crores.
P/E: 79.11
P/B: 81.58
Dividend yield: 1.17%
Here we go👇
@dmuthuk
1/25
Barring 2QCY20, where all Consumer companies, especially those with their own manufacturing facilities, faced supply-chain issues due to the sudden COVID-led lockdown, Nestle India reported 10-11% sales growth in 3 quarters in CY20.
2/25
2/25
This means that for four consecutive years (excluding revival from the CY15 Maggi crisis in CY16) the company reported double-digit, or close to double-digit, sales growth, which is better than peers.
3/25
3/25
NEST has launched 80 (including nine in CY20) new products. The company stated that these products contributed a healthy 4.3% of sales in CY20 v/s 3.4% in CY19. With 40-50 products in the pipeline, the pace of
new launches is likely to remain healthy going forward.
4/25
new launches is likely to remain healthy going forward.
4/25
The business has been improving its efficiency over the years. While the number of employees has remained flattish in the last five years, sales per employee have consistently improved to ~INR17m per employee in CY20 from ~INR12m in CY16.
5/25
5/25

Slight increase though in NWC days (up three days on an average basis from negative three days in CY19 to nil days in CY20 and up by four days on a year-end basis from negative two days to two days, with inventory days increasing slightly).
6/25
6/25
Barring Beverages (~11% of CY20 sales), other segments reported strong growth including 8.8% growth in its largest category -Milk and Nutrition (46% CY20 sales, close to its highest growth since CY14).
Management stated that market share gains were significant in Nescafe.
7/25
Management stated that market share gains were significant in Nescafe.
7/25
Management shared more on its successes from the recently introduced ‘cluster-based approach’ and stated: ‘Through the cluster-based approach, which is powered by Data & technology, the company has made a deeper penetration into newer markets, unleashed growth potential'.
8/25
8/25
During the COVID-19 led lockdown in CY20, the company stood by 100,000 dairy farmers and bought every drop of milk that was offered by them. The
management also worked closely with 3,500 coffee farmers, 1,250 spice growers, and extended its support, via its suppliers.
9/25
management also worked closely with 3,500 coffee farmers, 1,250 spice growers, and extended its support, via its suppliers.
9/25
The management reiterated its intention to move to 100% recyclable or reusable packaging by CY25.
Upcoming capex of INR26b over the next 3-4 years could impact the improvement in fixed asset turnover.
10/25
Upcoming capex of INR26b over the next 3-4 years could impact the improvement in fixed asset turnover.
10/25
Financials:
👉Net sales rose 7.9% YoY to INR133.5b in CY20.
👉Domestic sales growth stood at 8.5% in CY20 — a noteworthy performance despite a) two consecutive years of double-digit domestic topline growth in the
base and b) facing nationwide lockdowns in two quarters.
11/25
👉Net sales rose 7.9% YoY to INR133.5b in CY20.
👉Domestic sales growth stood at 8.5% in CY20 — a noteworthy performance despite a) two consecutive years of double-digit domestic topline growth in the
base and b) facing nationwide lockdowns in two quarters.
11/25

On a three-year basis, NEST has outperformed most peers in terms of sales CAGR, barring P&G Hygiene (PGHH).
12/25
12/25


Export sales grew 1.4% to INR6.5b in CY20 – slower than overall sales growth due to lower coffee exports to Turkey.
NEST continues to explore new markets for categories such as Prepared Dishes and Cooking Aids, Chocolates, and Confectionery in the Middle East.
13/25
NEST continues to explore new markets for categories such as Prepared Dishes and Cooking Aids, Chocolates, and Confectionery in the Middle East.
13/25

Maggi drives volumes, non-Maggi volumes decline YoY:
Overall volume growth was driven by continued strong volumes in the Prepared Dishes (Maggi) portfolio (57%/29.4% of total volumes/sales in CY20), which grew 6.6% YoY. This segment delivered sales growth of 11.8% in CY20
14/25
Overall volume growth was driven by continued strong volumes in the Prepared Dishes (Maggi) portfolio (57%/29.4% of total volumes/sales in CY20), which grew 6.6% YoY. This segment delivered sales growth of 11.8% in CY20
14/25

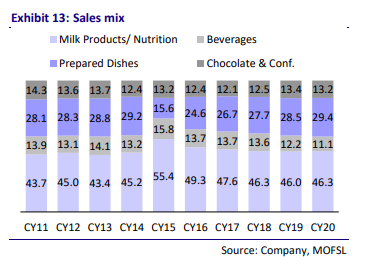
The non-Maggi portfolio registered a volume decline of 2.2% in CY20, led by a sharp (21.3%) volume decline in Beverages and flattish volume growth in Milk products.
15/25
15/25


The Chocolates and Confectionary segment (10% of total volumes and 13% of total sales in CY20) witnessed tepid volume growth (2.7%) in CY20. Volume growth was on a strong base (16.2% growth in CY19) – the highest pace of growth for the category since CY10.
16/25
16/25


Innovation:
On the consumer engagement front, NEST extended its AskNestlé 2.0 platform in Hindi. AskNestlé is a website that provides real-time and personalized advice on nutrition.
17/25
On the consumer engagement front, NEST extended its AskNestlé 2.0 platform in Hindi. AskNestlé is a website that provides real-time and personalized advice on nutrition.
17/25
Advertising and sales promotion (A&P) costs fell 2.8% YoY to INR7.6b in CY20.
As a percentage of domestic sales, NEST’s A&P expense declined 70bp YoY to 6%. As a percentage of net sales, A&P fell 70bp YoY to 5.7%.
18/25
As a percentage of domestic sales, NEST’s A&P expense declined 70bp YoY to 6%. As a percentage of net sales, A&P fell 70bp YoY to 5.7%.
18/25


Royalty expense, as a percentage of net sales, remained flat at 4.9%in CY20.
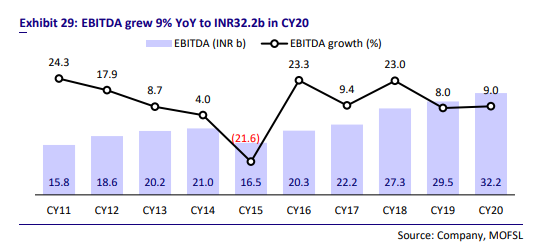
EBITDA margin grew 60bp YoY to 24.1% in CY20. . Negative contributors to EBITDA margin included a 30bp decline in gross margin and 80bp increase in
employee costs-to-sales ratio.
19/25
EBITDA margin grew 60bp YoY to 24.1% in CY20. . Negative contributors to EBITDA margin included a 30bp decline in gross margin and 80bp increase in
employee costs-to-sales ratio.
19/25


CY20 is the first year, after seven years in a row, where annual capex has been ahead of depreciation, which in turn, has led to an increase in net fixed assets + CWIP.
20/25
20/25

Debtor days remained at an historical average of ~3-4 days. Inventory days increased by four days YoY to 37 days. However, creditor days increased by a day YoY to 41 days.
21/25
21/25

Operating cash flow/free cash flow grew/fell 6.9%/7.6% YoY to INR24.5b/19.8b in CY20. The decline in FCF was on account of the significant capex of INR6.5b during the year.
Operating cash flow/free cash flow has delivered 10.5%/6.9% CAGR over the last three years.
22/25
Operating cash flow/free cash flow has delivered 10.5%/6.9% CAGR over the last three years.
22/25

As cash and cash equivalents increased significantly over CY15-18, the company declared a special dividend, leading to a sharp payout (169%) in CY19 v/s 64% in CY18. NEST continued its higher payout levels in CY20 with a 92% payout.
23/25
23/25

With higher dividend payouts in CY19-20, return ratios improved significantly in CY20. RoE/RoCE rose to 106.5%/110.2% in CY20 from 69.7%/71.9% in CY19.
24/25
24/25

Nearly 40% of NEST’s invoices are managed digitally.
Technology implementation, leads to transparency & speed, benefits all stakeholders in the value chain, including dairy farmers, who now receive e-slips on their mobile phones.
End of thread 🧵
25/25
Technology implementation, leads to transparency & speed, benefits all stakeholders in the value chain, including dairy farmers, who now receive e-slips on their mobile phones.
End of thread 🧵
25/25


• • •
Missing some Tweet in this thread? You can try to
force a refresh


