Updated our T&T performance tracker, covers 8-14th April.
Key points
- lots of changes to LFD use, with differences across the country
- despite falling cases, end-to-end journey time from symptoms to reaching contacts increasing
Detail in 🧵
health.org.uk/news-and-comme…
Key points
- lots of changes to LFD use, with differences across the country
- despite falling cases, end-to-end journey time from symptoms to reaching contacts increasing
Detail in 🧵
health.org.uk/news-and-comme…
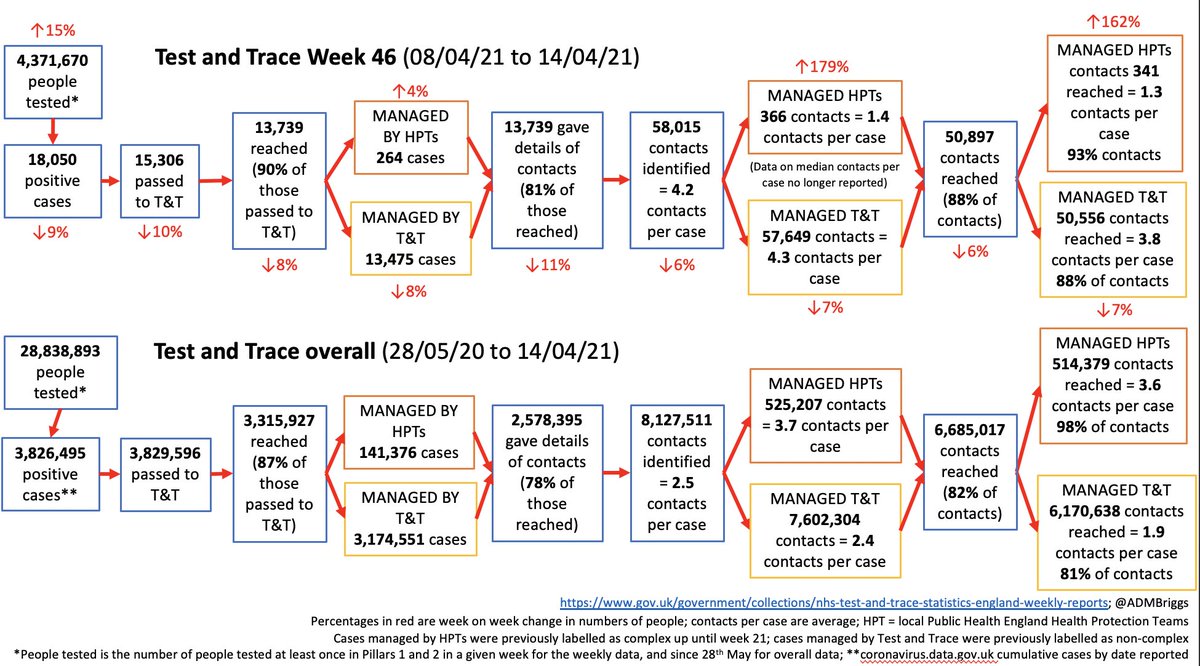
After a dip over the Easter bank holiday w/e, number of people tested increased by 15% to 4.4m
although this is still some way off the peak of 6.2m four weeks earlier
although this is still some way off the peak of 6.2m four weeks earlier


The changes have been mainly due to variations in use of rapid lateral flow devices (LFDs).
These have been rolled out by the government for people without symptoms over recent months and are now available to everyone in England.
These have been rolled out by the government for people without symptoms over recent months and are now available to everyone in England.
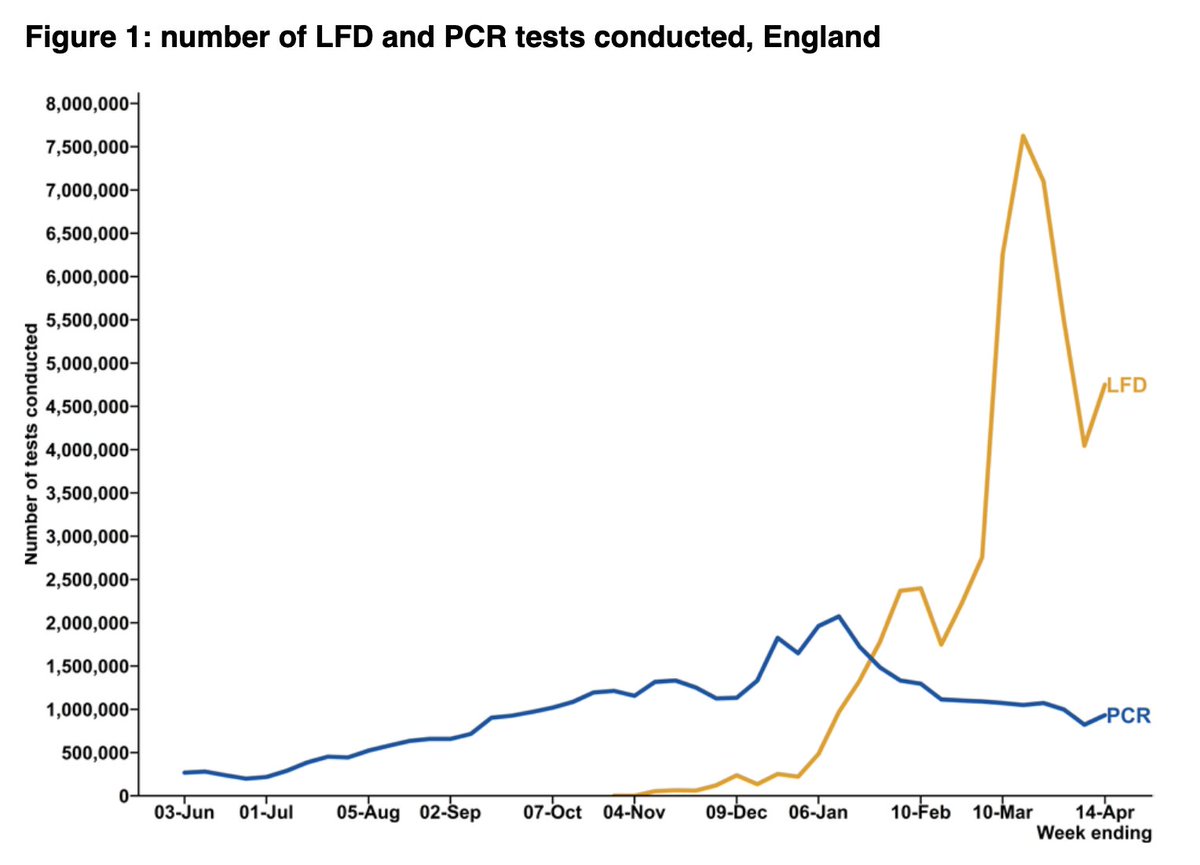
The drop in LFD use in the last week of March/first week of April (down from 7.1m tests a week to just 4.0m) was mainly from fewer tests from secondary schools and colleges.
The fall coincided with the shift to testing at home, and start of the Easter hols.
The fall coincided with the shift to testing at home, and start of the Easter hols.
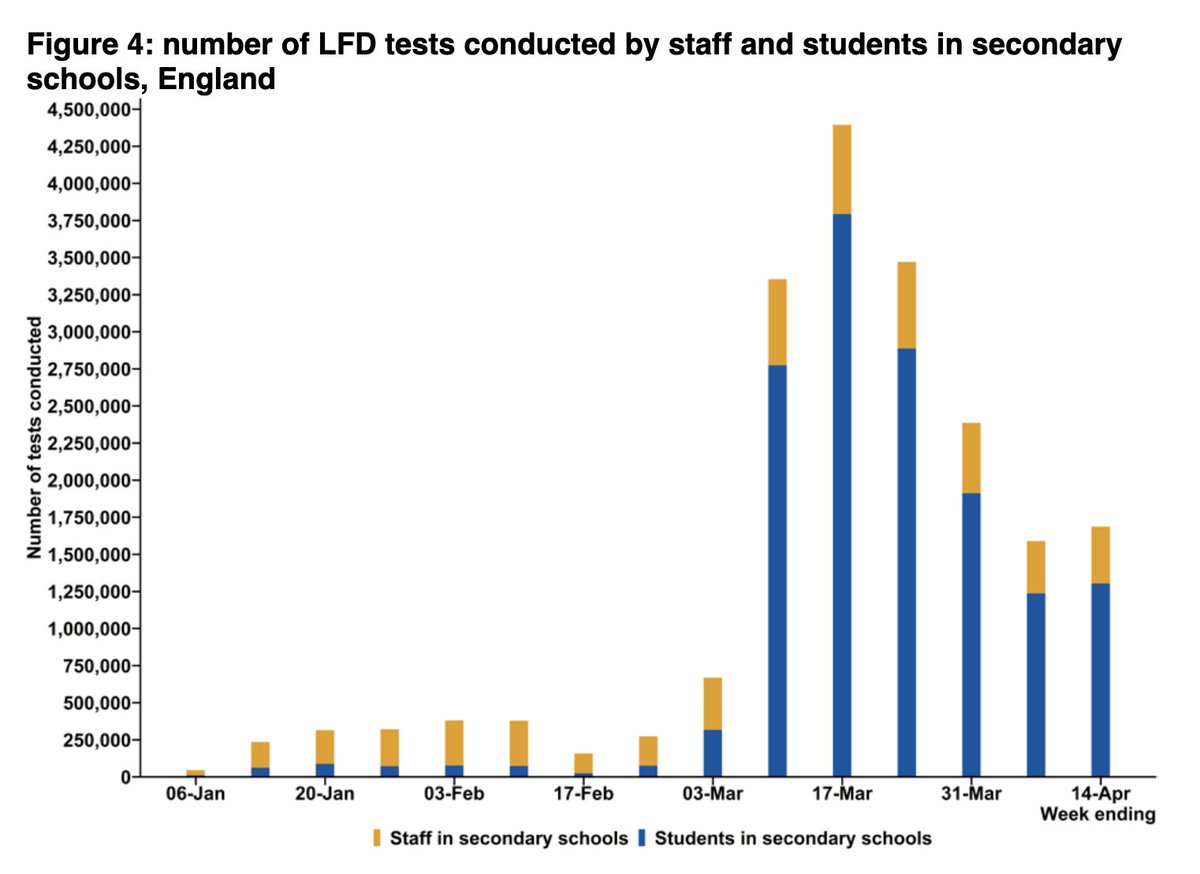
In the most recent week, LFD use was up by 750k.
Only around a fifth of this rise is explained by school testing, with the rest coming other government testing schemes – in particular LFDs being made available to everyone from 9 April 2021.
Only around a fifth of this rise is explained by school testing, with the rest coming other government testing schemes – in particular LFDs being made available to everyone from 9 April 2021.

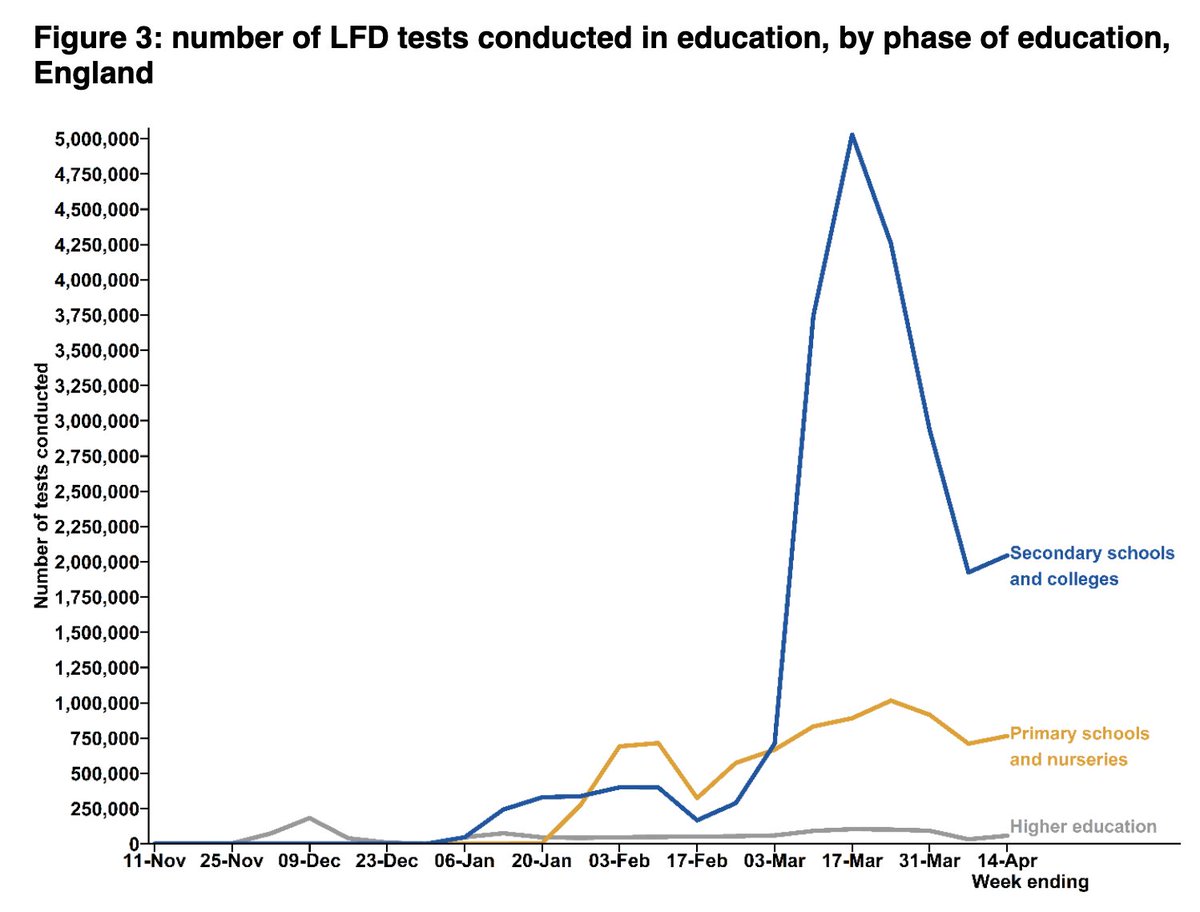
There are still important differences by region.
The highest LFD use is in the East of England with 12,500 tests per 100,000, compared to just 5,200 per 100,000 in London.
The highest LFD use is in the East of England with 12,500 tests per 100,000, compared to just 5,200 per 100,000 in London.

This will partly be explained by the different dates that schools returned across the country, but also due to differences in factors such as employment, access, and willingness to engage with the scheme.
Important to monitor moving forward now everyone has access to LFDs.
Important to monitor moving forward now everyone has access to LFDs.
Despite the 15% increase in the number of people being tested, case numbers still fell by 9%.
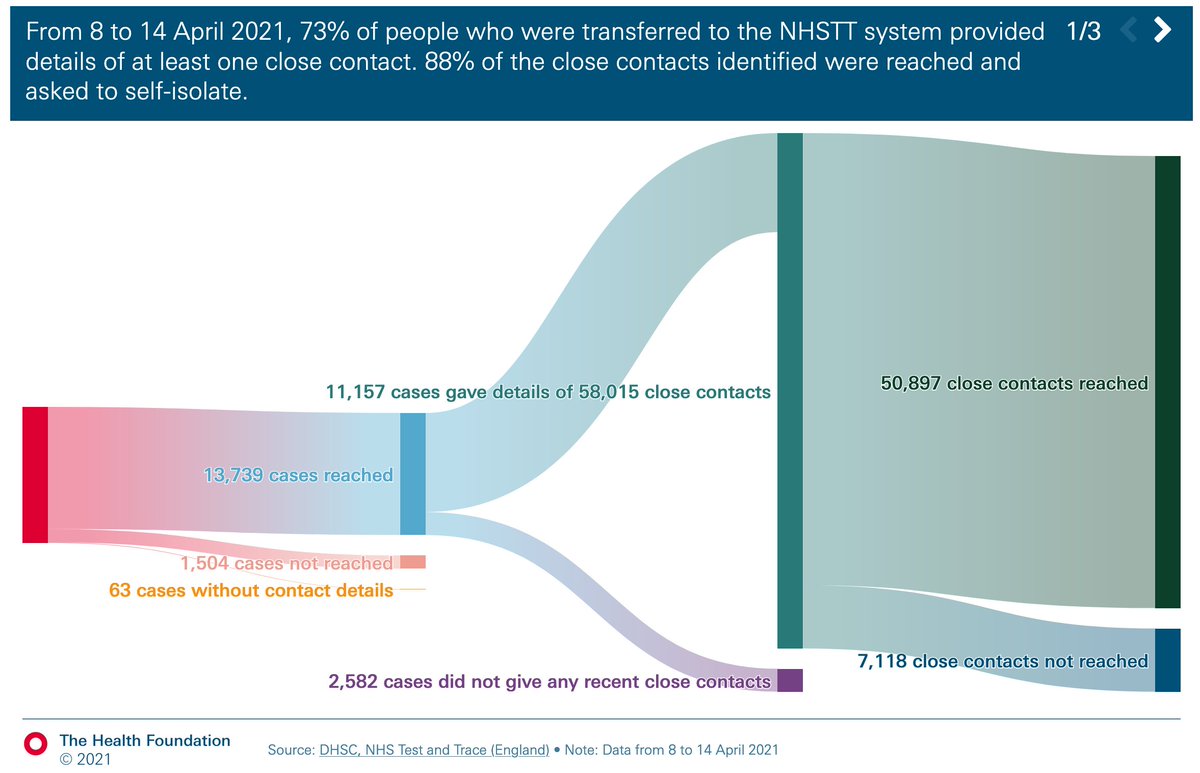
Whilst overall T&T performance remains broadly unchanged, there is an increasing trend in the time taken to reach contacts from when a case is first passed to the system.
Whilst overall T&T performance remains broadly unchanged, there is an increasing trend in the time taken to reach contacts from when a case is first passed to the system.


Perhaps surprisingly, week on week fall in the percentage of cases providing details of contacts, but overall contacts per case rising.
Now 4.2 contacts per case, up from just 2 in mid-Jan.
Now 4.2 contacts per case, up from just 2 in mid-Jan.


Big drops in the percentage of contacts from the same households.
The fall would be expected, but the extend of the drop is perhaps a little surprising.
The fall would be expected, but the extend of the drop is perhaps a little surprising.

It's this drop in % of contacts from the same household that explains the slight fall in success rates of reaching contacts overall.
In fact, success rates of reaching HH contacts is the same as previous wks (97%), and slightly improving for non HH contacts (now 78%).
In fact, success rates of reaching HH contacts is the same as previous wks (97%), and slightly improving for non HH contacts (now 78%).

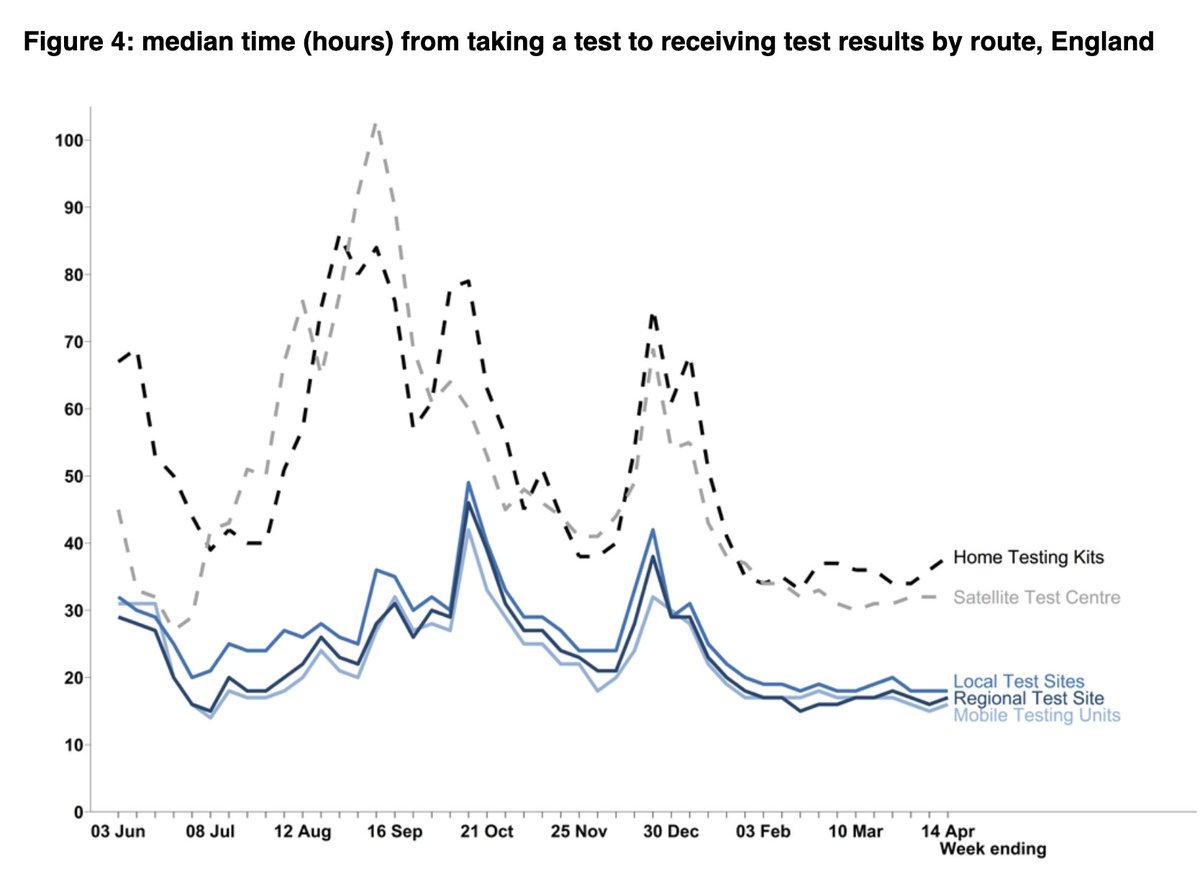
As more contacts are identified per case, and more of these are from outside of the case’s household, the median time for contacts to be reached from when a case first developed symptoms is now 97 hours.
Up from just 79 hours two weeks previously.
Up from just 79 hours two weeks previously.

Part of the issue seems to be with it taking longer to reach cases.
The % cases reached within 24hrs has dropped, whereas test turnaround time is generally unchanged, as has % of contacts reached within 24hrs of contacts identified.
The % cases reached within 24hrs has dropped, whereas test turnaround time is generally unchanged, as has % of contacts reached within 24hrs of contacts identified.


As society continues to open up, any additional time gives more opportunity for the virus to spread, so it’s crucial this trend doesn’t continue.
And as ever, these numbers don’t tell us about who doesn’t get tested and who struggles to adhere to isolation.
And as ever, these numbers don’t tell us about who doesn’t get tested and who struggles to adhere to isolation.
As the number of cases in the community falls and social mixing increases, it becomes ever more important that any cases that do occur are identified and managed as quickly as possible before the virus has the chance to spread.
And here's the overall summary slide.
wk 46 T&T ☝️ @felly500 @trishgreenhalgh @deb_cohen @martinmckee @carolecadwalla @mgtmccartney
@ADPHUK @Jeanelleuk @fascinatorfun @profchrisham @petermbenglish @HPIAndyCowper @Davewwest @HSJEditor @KateAlvanley @IndependentSage @nedwards_1 @chrischirp @SamanthaJonesUK
@ADPHUK @Jeanelleuk @fascinatorfun @profchrisham @petermbenglish @HPIAndyCowper @Davewwest @HSJEditor @KateAlvanley @IndependentSage @nedwards_1 @chrischirp @SamanthaJonesUK
@ewanbirney @TimHarford @devisridhar @FurberA @andrewleedr @kieran_walshe @DrChadborn @Dr_D_Robertson
• • •
Missing some Tweet in this thread? You can try to
force a refresh