1/H
There was a recent effort to champion Nate Silver (@NateSilver538) as a non-expert who speaks uncomfortable truths experts don't want to hear.
That's misguided, as we can see by examining how many SARS-CoV-2-infected get hospitalized.

There was a recent effort to champion Nate Silver (@NateSilver538) as a non-expert who speaks uncomfortable truths experts don't want to hear.
That's misguided, as we can see by examining how many SARS-CoV-2-infected get hospitalized.
https://twitter.com/LajXtra/status/1383948036905127946
2/H
Some context:
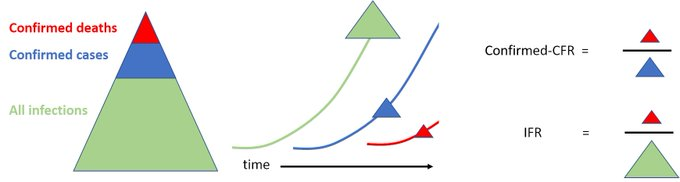
Infection fatality rate, or IFR, is the proportion of people infected with the virus SARS-CoV-2 who die of the disease COVID-19.
Infection hospitalization rate, or IHR, is like IFR, but with COVID-19 hospitalizations instead of deaths
institutefordiseasemodeling.github.io/nCoV-public/an…
Some context:
Infection fatality rate, or IFR, is the proportion of people infected with the virus SARS-CoV-2 who die of the disease COVID-19.
Infection hospitalization rate, or IHR, is like IFR, but with COVID-19 hospitalizations instead of deaths
institutefordiseasemodeling.github.io/nCoV-public/an…
3/H
Seroprevalence studies measure antibody levels to estimate the number of infected people.
Dividing COVID-19 hospitalizations by that number of infected people gives a seroprevalence-based IHR.
IHR is good to know.
Seroprevalence studies measure antibody levels to estimate the number of infected people.
Dividing COVID-19 hospitalizations by that number of infected people gives a seroprevalence-based IHR.
IHR is good to know.
https://twitter.com/AtomsksSanakan/status/1386751496390336518
https://twitter.com/AtomsksSanakan/status/1341185258964836353
4/H
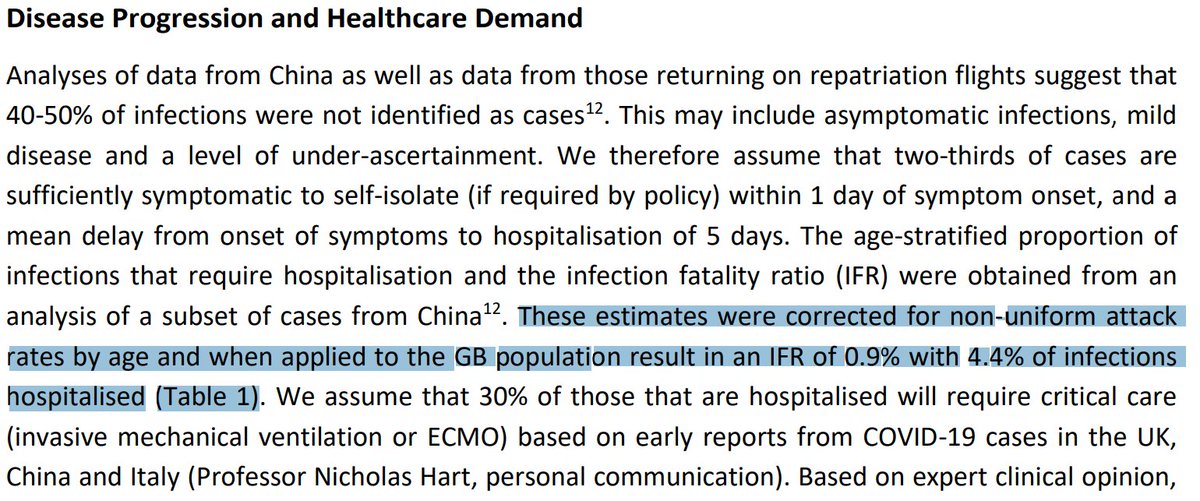
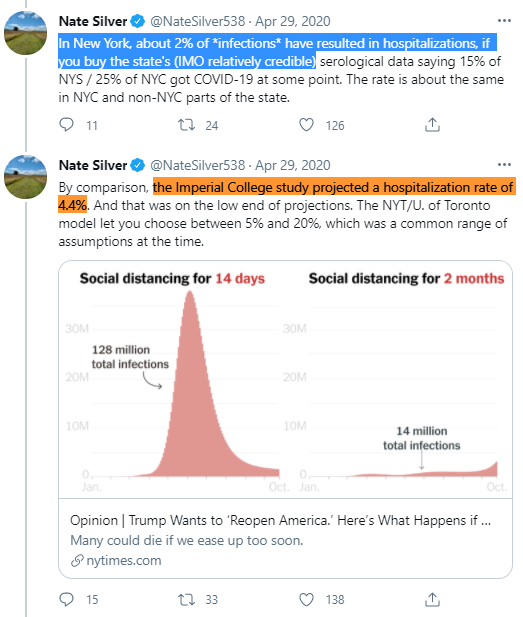
Neil Ferguson's team at Imperial College gave IFR + IHR estimates for Great Britain (GB) and the USA in March 2020.
Their IFR estimates held up well for the mitigated pandemic that actually occurred.
Their IHR was ~4.4%.
spiral.imperial.ac.uk:8443/bitstream/1004…
Neil Ferguson's team at Imperial College gave IFR + IHR estimates for Great Britain (GB) and the USA in March 2020.
Their IFR estimates held up well for the mitigated pandemic that actually occurred.
Their IHR was ~4.4%.
https://twitter.com/AtomsksSanakan/status/1353875481880354825
spiral.imperial.ac.uk:8443/bitstream/1004…
5/H
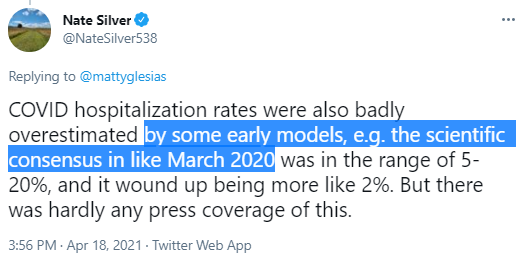
This is where Nate Silver objects.
He claims IHR was more like ~2%, and so Ferguson et al.'s ~4.4% value was an over-estimate.
He's been saying this for about a year or more, despite people repeatedly explaining he's wrong.
This is where Nate Silver objects.
He claims IHR was more like ~2%, and so Ferguson et al.'s ~4.4% value was an over-estimate.
He's been saying this for about a year or more, despite people repeatedly explaining he's wrong.
https://twitter.com/NateSilver538/status/1255500333922635782
https://twitter.com/NateSilver538/status/1312501274877726722
6/H
Silver recently brought up this up again, after experts correctly criticized his non-expert + uninformed claims on vaccine policy / communication.
So he may have thought pointing out experts being wrong might help him.
Silver recently brought up this up again, after experts correctly criticized his non-expert + uninformed claims on vaccine policy / communication.
So he may have thought pointing out experts being wrong might help him.
https://twitter.com/NateSilver538/status/1383871962758344709
https://twitter.com/AtomsksSanakan/status/1382371294109392910
7/H
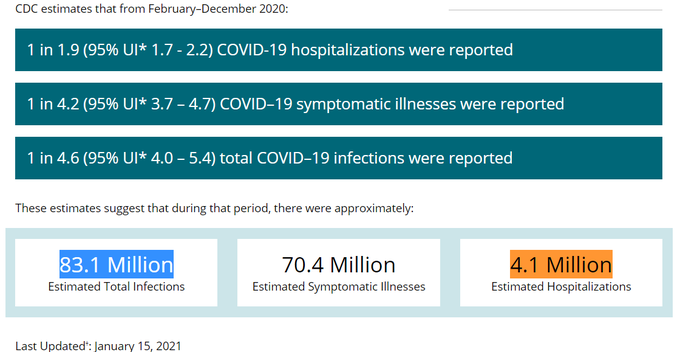
With that background out of the way, it might help to assess how Silver's claims held up in comparison to experts like Ferguson et al.
Well, the CDC's most recent IHR is ~4.9%. So not a good start for Silver.
web.archive.org/web/2021042521…
With that background out of the way, it might help to assess how Silver's claims held up in comparison to experts like Ferguson et al.
Well, the CDC's most recent IHR is ~4.9%. So not a good start for Silver.
https://twitter.com/Balgor11/status/1386434734696255489
web.archive.org/web/2021042521…
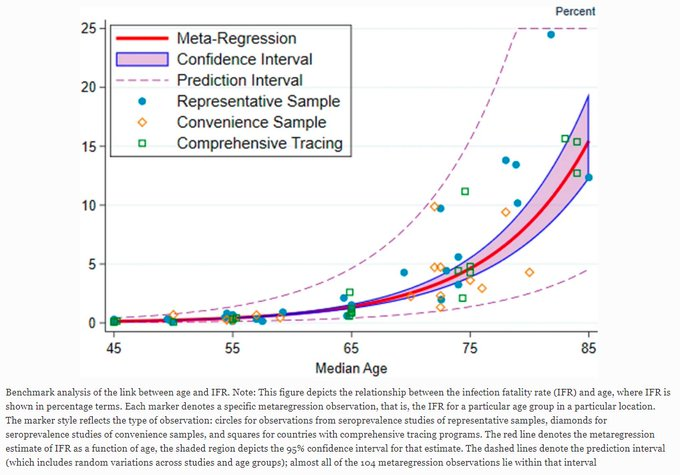
8/H
IHR is higher for nursing home residents, consistent with higher IFR for nursing home residents + older people due to more severe infections.
So IHR can be higher in older populations + lower elsewhere
ncbi.nlm.nih.gov/pmc/articles/P…
medrxiv.org/content/10.110…
link.springer.com/article/10.100…
IHR is higher for nursing home residents, consistent with higher IFR for nursing home residents + older people due to more severe infections.
So IHR can be higher in older populations + lower elsewhere
ncbi.nlm.nih.gov/pmc/articles/P…
medrxiv.org/content/10.110…
link.springer.com/article/10.100…
9/H
Yet under-estimating IHRs by excluding nursing home residents, leads to IHRs are at or above Silver's value of ~2%.
With the CDC's analysis, that further undermines Silver's IHR claim.
"2.1%"
ingentaconnect.com/content/wk/phh…
"2.7%"
sciencedirect.com/science/articl…
sciencedirect.com/science/articl…
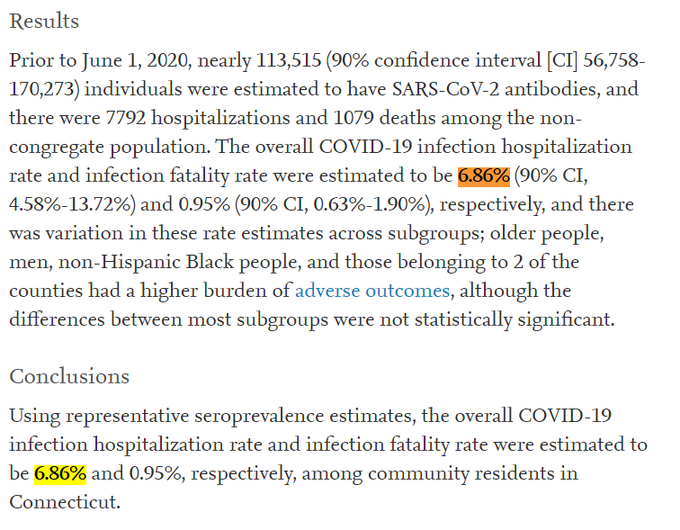
10/H
So where did @NateSilver538 go wrong?
It goes back to the New York study he relied on.
People who've read some of my IFR threads, especially those on Ioannidis, know what I'm about to say:
non-representative sampling. 🙂
ncbi.nlm.nih.gov/pmc/articles/P…
So where did @NateSilver538 go wrong?
It goes back to the New York study he relied on.
People who've read some of my IFR threads, especially those on Ioannidis, know what I'm about to say:
non-representative sampling. 🙂
https://twitter.com/NateSilver538/status/1255499961791328262
ncbi.nlm.nih.gov/pmc/articles/P…
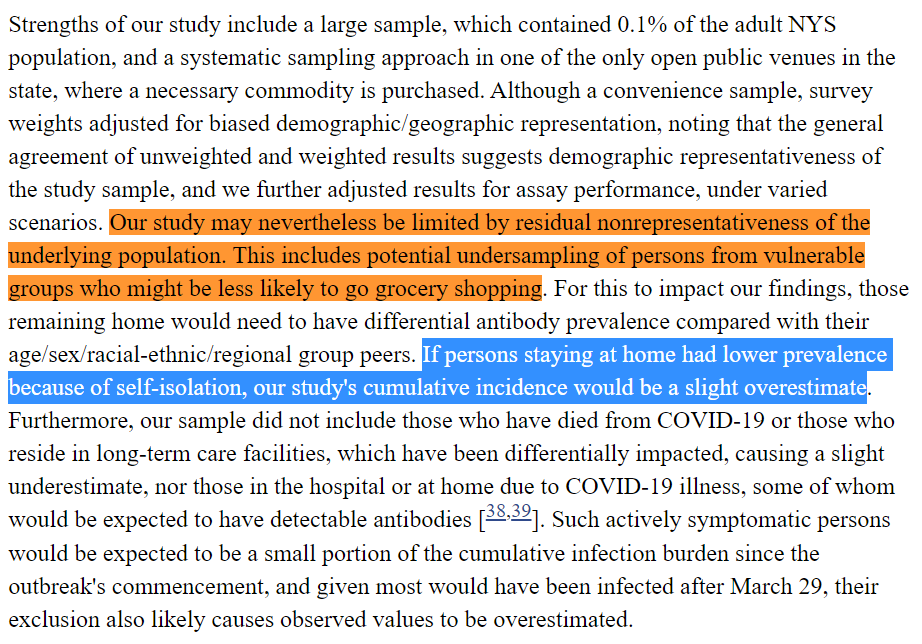
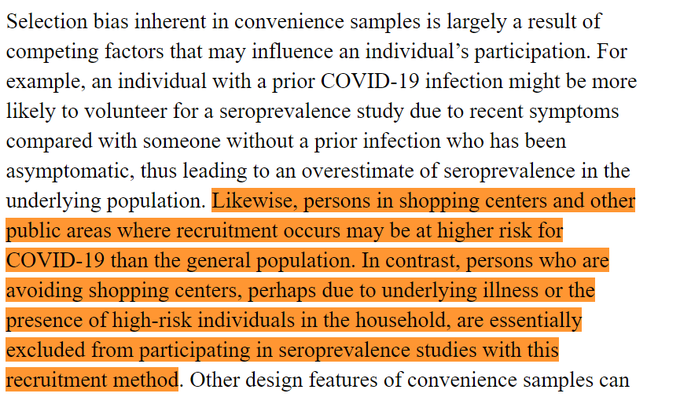
11/H
The study Silver relied on sampled only those in grocery stores. None of the IHR work cited in 7/H to 9/H did that.
So Silver likely over-estimated the number of people infected, + thus under-estimated IHR.
ncbi.nlm.nih.gov/pmc/articles/P…
The study Silver relied on sampled only those in grocery stores. None of the IHR work cited in 7/H to 9/H did that.
So Silver likely over-estimated the number of people infected, + thus under-estimated IHR.
https://twitter.com/AtomsksSanakan/status/1341303286272413696
ncbi.nlm.nih.gov/pmc/articles/P…
12/H
Silver messed this up because he's a non-expert.
What he should have done was run this by experts first, + listened when they corrected him.
Instead he stuck to his false claims despite correction, + used this to unfairly criticize experts.
onlinelibrary.wiley.com/doi/full/10.11…
Silver messed this up because he's a non-expert.
What he should have done was run this by experts first, + listened when they corrected him.
Instead he stuck to his false claims despite correction, + used this to unfairly criticize experts.
onlinelibrary.wiley.com/doi/full/10.11…
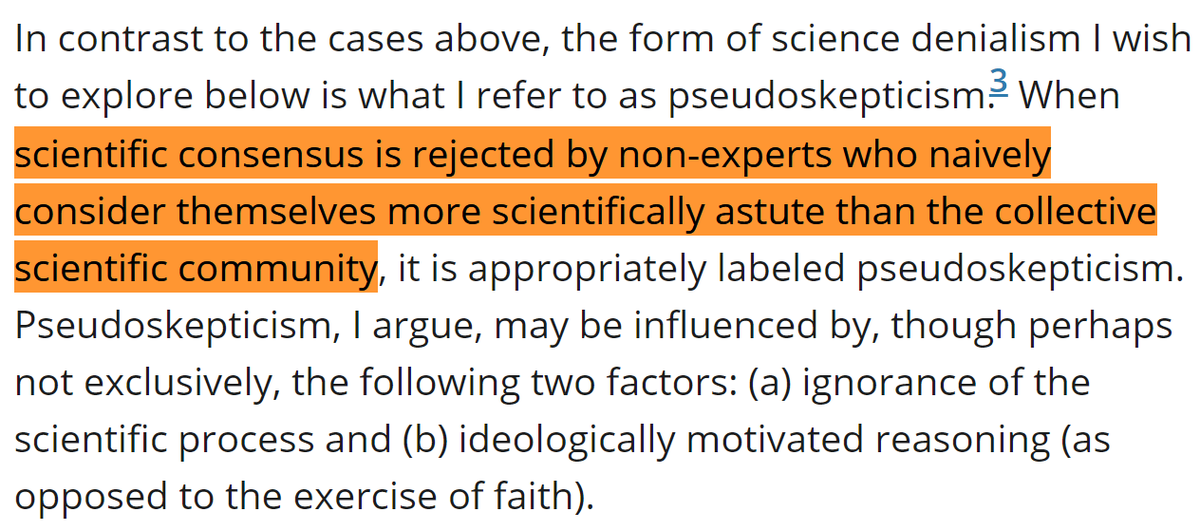
13/H
Silver often does this sort of "epistemic trespassing," where he contradicts experts in a topic, when the problem is that he doesn't understand the information that experts do.
For example, on climate models (after speaking to @ClimateOfGavin):
Silver often does this sort of "epistemic trespassing," where he contradicts experts in a topic, when the problem is that he doesn't understand the information that experts do.
For example, on climate models (after speaking to @ClimateOfGavin):
https://twitter.com/AtomsksSanakan/status/1300530097468866561
14/H
To modify @Potholer54T's rule:
If you're a non-expert disagreeing with the evidence-based consensus of scientific experts, then either:
1) experts know less than you
2) experts covered up what they know
3) experts know more than you
Start with #3
To modify @Potholer54T's rule:
If you're a non-expert disagreeing with the evidence-based consensus of scientific experts, then either:
1) experts know less than you
2) experts covered up what they know
3) experts know more than you
Start with #3
15/H
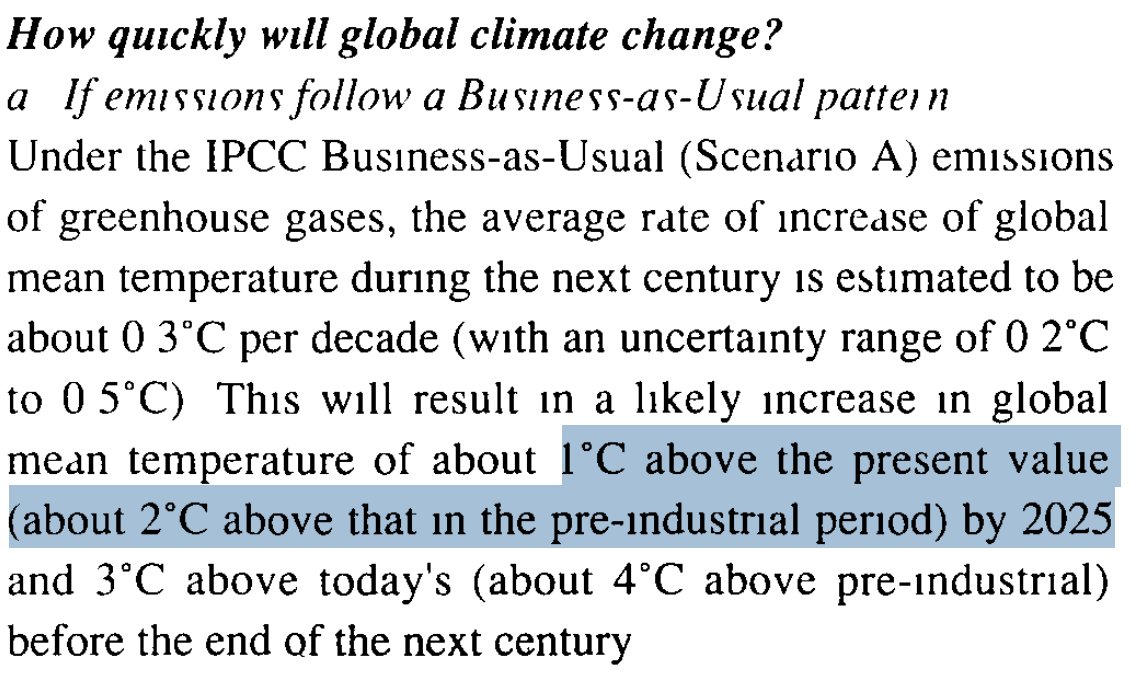
Silver claims that in March 2020 the consensus range for IHR was 5% - 20%.
His citation of the New York Times doesn't make his case, since the range they let people choose is not the same as a best estimate for the model.
Silver claims that in March 2020 the consensus range for IHR was 5% - 20%.
His citation of the New York Times doesn't make his case, since the range they let people choose is not the same as a best estimate for the model.
https://twitter.com/NateSilver538/status/1383871962758344709
https://twitter.com/NateSilver538/status/1255500333922635782

16/H
Looking back, several sources either:
- use Ferguson et al.'s IHR value of 4.4%
- use a value of ≤8%
Either option is consistent with the range of IHRs given in parts 7/H to 9/H.
The WHO gives a higher value, when just relaying information on reported cases.
Looking back, several sources either:
- use Ferguson et al.'s IHR value of 4.4%
- use a value of ≤8%
Either option is consistent with the range of IHRs given in parts 7/H to 9/H.
The WHO gives a higher value, when just relaying information on reported cases.
17/H
Examples:
"from Imperial College"
medrxiv.org/content/10.110…
"2.7%"
sites.utexas.edu/dodabalapur/fi…
"1 out of every 20 people"
news.utexas.edu/2020/03/26/a-n…
"5 percent"
montclairlocal.news/2020/03/30/cov…
[predictivehealthcare.pennmedicine.org/2020/03/14/acc…]
"6.2% [...] 6.4%"
uaa.alaska.edu/academics/coll…
who.int/emergencies/di…

18/H
So Silver made unsupported claims on what the "consensus" showed, to make himself look more accurate than experts.
In reality, the evidence-based expert consensus was right, and Silver wrongly downplayed the risk of COVID-19
So Silver made unsupported claims on what the "consensus" showed, to make himself look more accurate than experts.
In reality, the evidence-based expert consensus was right, and Silver wrongly downplayed the risk of COVID-19
https://twitter.com/NoahHaber/status/1300450833763622915
https://twitter.com/GidMK/status/1340537758675161088

Twitter isn't showing part 15/H for some reason, so here it is:
https://twitter.com/AtomsksSanakan/status/1386893240276824064

• • •
Missing some Tweet in this thread? You can try to
force a refresh