A simple thread about position sizing and volatility targeting 👇
You have $1,000
You buy $1,000 of SPY
You leave it alone
The volatility of SPY over the period was 18%
What is the volatility of your portfolio?
Not a trick question. It's 18%
1/n
You have $1,000
You buy $1,000 of SPY
You leave it alone
The volatility of SPY over the period was 18%
What is the volatility of your portfolio?
Not a trick question. It's 18%
1/n

Imagine instead you buy $500 of SPY in your $1000 account.
At the start, you have half your money in cash and half in SPY.
What is the volatility of your portfolio now?
It's 9%: half what it was before.
2/n
At the start, you have half your money in cash and half in SPY.
What is the volatility of your portfolio now?
It's 9%: half what it was before.
2/n

Now, let's say you could buy $2000 of SPY in your $1000 account (and don't pay anything to borrow)
What is the volatility of your portfolio now?
It's 36%: twice the figure when you were fully invested.
This is a useful result. You can prove it to yourself easily in Excel
3/n
What is the volatility of your portfolio now?
It's 36%: twice the figure when you were fully invested.
This is a useful result. You can prove it to yourself easily in Excel
3/n
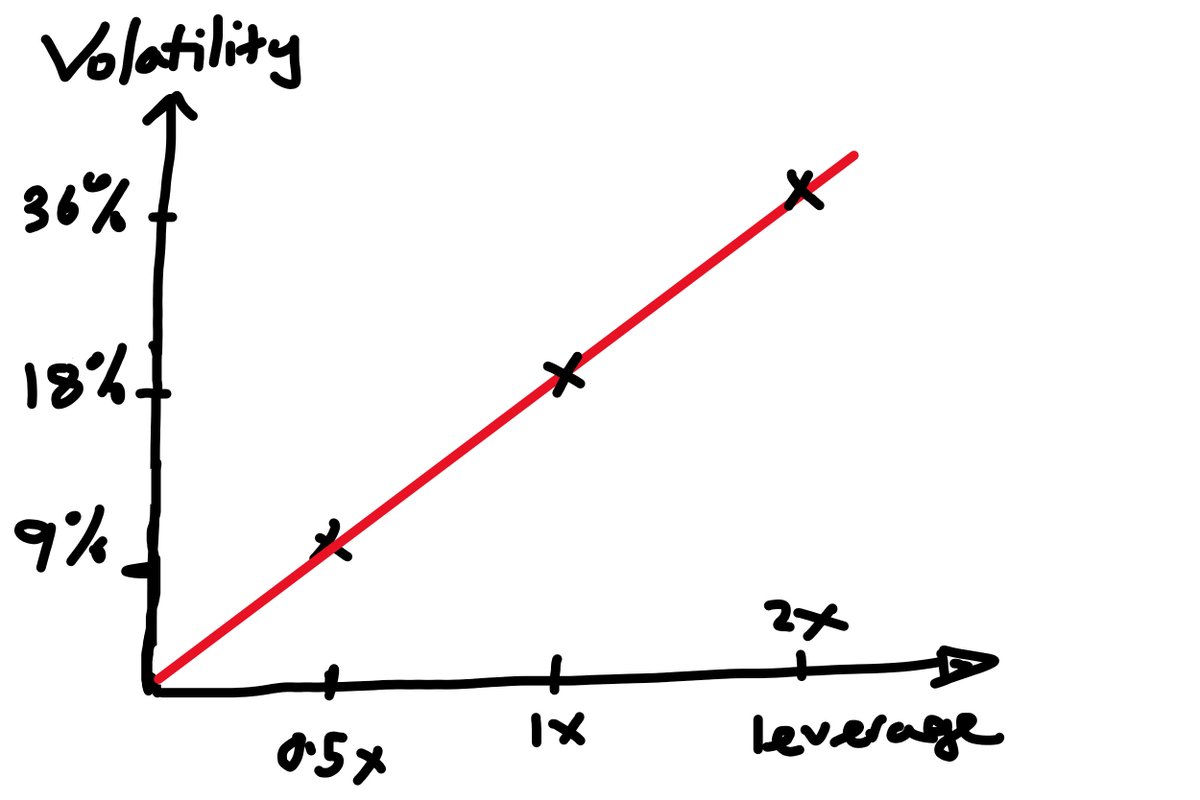
If you half the size of your position you get half of the volatility contribution.
If you double the size of your position you get double the volatility contribution.
This is very useful when it comes to *sizing positions*
4/n
If you double the size of your position you get double the volatility contribution.
This is very useful when it comes to *sizing positions*
4/n

Asset volatility is quite easy to predict.
And here are some scatterplots to illlustrate.
I've plotted annualised volatility over 20 days against the vol over the previous 20 days.
(estimated from the standard deviation of returns)
5/n
And here are some scatterplots to illlustrate.
I've plotted annualised volatility over 20 days against the vol over the previous 20 days.
(estimated from the standard deviation of returns)
5/n
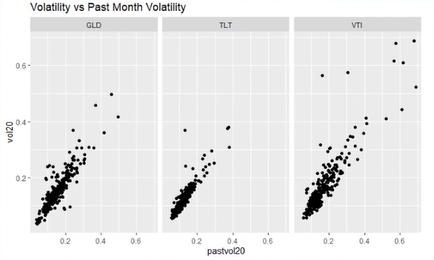
Simply assuming volatility stays the same as your last estimate of it works pretty well as a forecast.
Just like the weather.
This, and the fact that volatility increases in linear proportion to size, suggests a simple approach to "targeting" a certain level of volatility.
6/n
Just like the weather.
This, and the fact that volatility increases in linear proportion to size, suggests a simple approach to "targeting" a certain level of volatility.
6/n
If you want a given position to contribute 10% volatility to your portfolio.
You can:
- Observe the vol it contributed over the last 20 days (15% say)
- Scale its sizing by vol_estimated / vol_you_want:
So you'd scale the position up 15 / 10 = 1.5
7/n
You can:
- Observe the vol it contributed over the last 20 days (15% say)
- Scale its sizing by vol_estimated / vol_you_want:
So you'd scale the position up 15 / 10 = 1.5
7/n
Why would this be a useful thing?
Why would you target a certain level of volatility?
Imagine you have two assets:
- a volatile orange asset
- a less volatile yellow asset
8/n
Why would you target a certain level of volatility?
Imagine you have two assets:
- a volatile orange asset
- a less volatile yellow asset
8/n

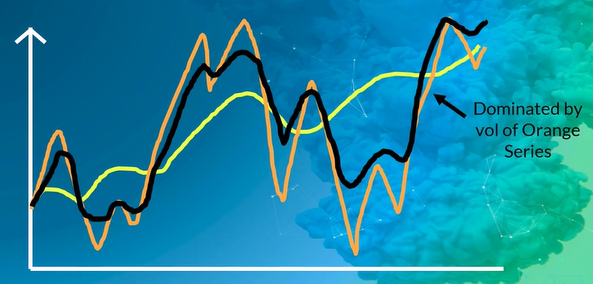
If you hold these assets together with equal size.
Half your money in orange. Half your money in yellow.
The portfolio returns are going to look a bit like the black line here.
It will be dominated by the volatility of the orange asset.
9/n
Half your money in orange. Half your money in yellow.
The portfolio returns are going to look a bit like the black line here.
It will be dominated by the volatility of the orange asset.
9/n
Is this what you want?
Probably not, right?
You're allowing our portfolio to be dominated by the most volatile asset, simply because it happens to be the most volatile asset.
10/n
Probably not, right?
You're allowing our portfolio to be dominated by the most volatile asset, simply because it happens to be the most volatile asset.
10/n
Unless you have a good reason to prefer one asset over the other, you'll want each stock to contribute about the same amount of volatility to your portfolio.
You want the movements in your portfolio to be equally dependent on both assets. Probably.
11/n
You want the movements in your portfolio to be equally dependent on both assets. Probably.
11/n
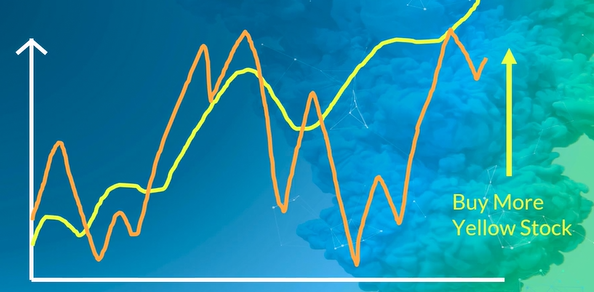
To do that, we'd buy more of the yellow one - intentionally making it more volatile in the context of our portfolio (than when we equal-weighted it)
And we'd buy less of the orange one - intentionally making it less volatile in the context of our portfolio.
12/n
And we'd buy less of the orange one - intentionally making it less volatile in the context of our portfolio.
12/n
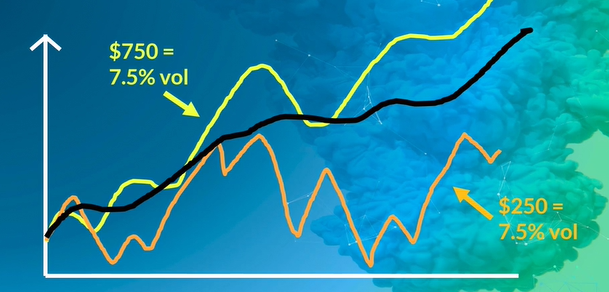
If you scale yellow up and size orange down to targe equal vol... it would look something like this:
The portfolio (black line) is less volatile than the constituent stocks. This will always be the case as long as they don't wiggle in sync.
Diversification 101
13/n
The portfolio (black line) is less volatile than the constituent stocks. This will always be the case as long as they don't wiggle in sync.
Diversification 101
13/n

One objection you may have to this example is:
"Why would I give them equal volatility weight? The yellow one is better"
Yeah, but only in the past... We have no idea what's going to happen next.
Predicting returns is super hard. At least in the future.
14/n
"Why would I give them equal volatility weight? The yellow one is better"
Yeah, but only in the past... We have no idea what's going to happen next.
Predicting returns is super hard. At least in the future.
14/n

Now if you're convinced this is a good idea, you already know how to do the scaling, cos I told you earlier...
But let's go thru it cos repetition is good...
We'll assume:
- orange shows 30% vol over the charted period
- yellow 10% vol
15/n
But let's go thru it cos repetition is good...
We'll assume:
- orange shows 30% vol over the charted period
- yellow 10% vol
15/n

Remember volatility scales in proportion to size?
Given a $1k account...
At $1k we realize 30% vol
At $500 we realize 15% vol
At $250 we realize 7.5% vol
16/n
Given a $1k account...
At $1k we realize 30% vol
At $500 we realize 15% vol
At $250 we realize 7.5% vol
16/n
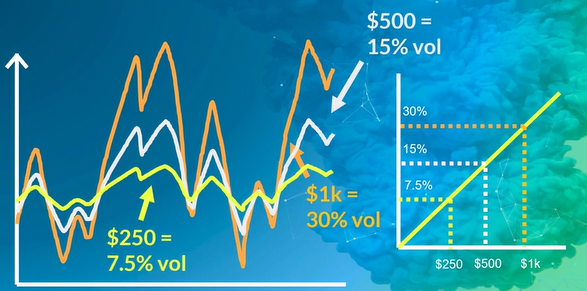
So let's size "orange" to 7.5% vol contribution by buying $250 of it in our $1k account.
17/n
17/n

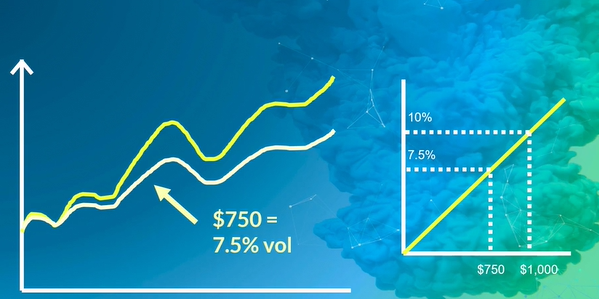
Now let's do yellow.
Given our $1k account...
At $1k we realize 10% vol
At $750 we realize 7.5% vol
So we size "yellow" to a 7.5% vol contribution by buying $750 of it in our $1k account.
18/n
Given our $1k account...
At $1k we realize 10% vol
At $750 we realize 7.5% vol
So we size "yellow" to a 7.5% vol contribution by buying $750 of it in our $1k account.
18/n
Now, assuming our volatility "predictions" were reasonable, we can now expect both assets to contribute about 7.5% volatility each to our portfolio.
And, to the extent one zigs whilst the other zags, we'd see portfolio vol to be less than the sum (<15%)
19/n
And, to the extent one zigs whilst the other zags, we'd see portfolio vol to be less than the sum (<15%)
19/n
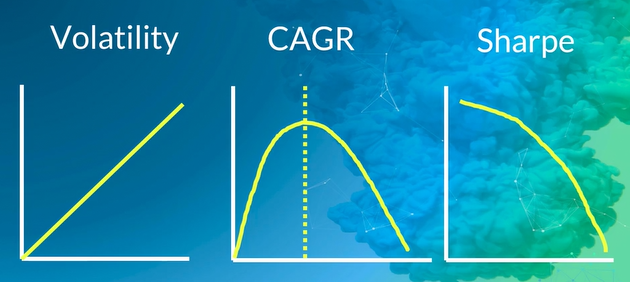
This is a really useful sizing technique. And it's useful to think in these terms.
Managing volatility can also increase your risk/adjusted returns. Because although volatility is linear in size, compounded returns are not.
A discussion for another time...
20/20
Managing volatility can also increase your risk/adjusted returns. Because although volatility is linear in size, compounded returns are not.
A discussion for another time...
20/20
I took these examples from this simple retail-focused quant trading course I'm teaching here: robotwealth.com/trade-like-a-q…
Tweet 7 is the wrong way around here. Thanks @cyberSM7. Should say...
You want to target 10% vol
You can:
- Observe the vol it contributed over the last 20 days (15% say)
- Scale its sizing by vol_you_want / vol_estimated:
So you'd scale the position up 10 / 15 = 2/3
You want to target 10% vol
You can:
- Observe the vol it contributed over the last 20 days (15% say)
- Scale its sizing by vol_you_want / vol_estimated:
So you'd scale the position up 10 / 15 = 2/3
• • •
Missing some Tweet in this thread? You can try to
force a refresh