
THREAD: A new @CatoInstitute national survey seeks to explore and examine why Americans support or oppose a more open immigration regime. cato.org/survey-reports… #CatoPolls #CatoImmigration
Support for more immigration has tripled from the mid‐1990s when about 10% of the public supported more immigration and two‐thirds wanted less. Today 29% of Americans want more, 38% want to maintain current levels, and 33% want less. #CatoPolls 

Democrats’ views largely account for this shift. Starting around 2008–2010, Democratic support for more immigration rose from about 20% to 47% today. #CatoPolls

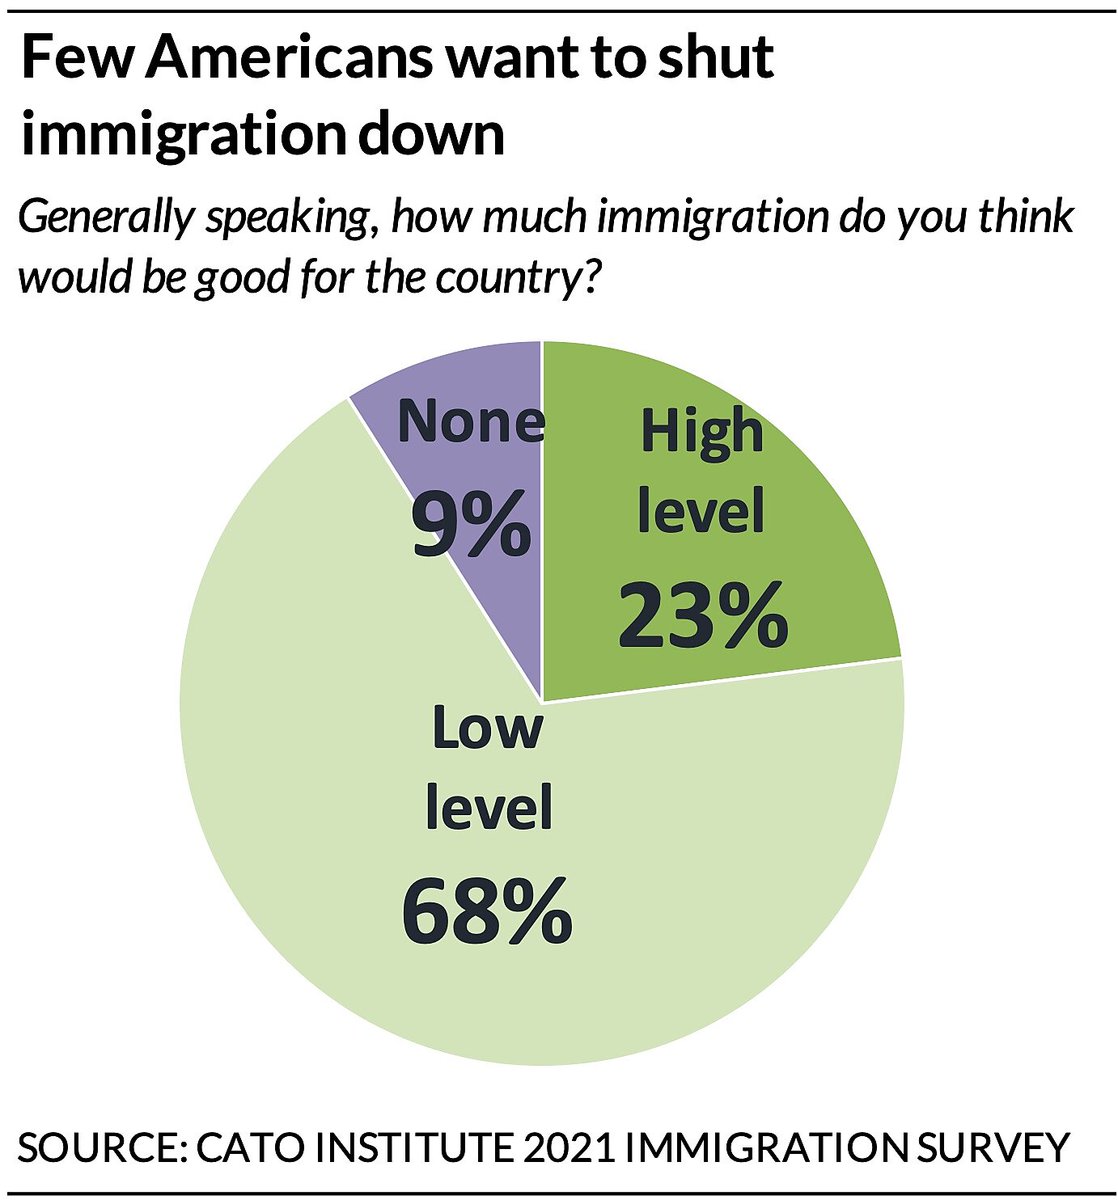
Only 9% of Americans want zero immigration into the United States today. Instead, 91% welcome immigration, including 68% who favor a “low level” and 23% who prefer a “high level” of immigration. #CatoPolls
Fifty‐nine percent (59%) of Republicans say citizens should be able to directly vote on immigration levels and origins. However, two‐thirds (65%) of Democrats disagree. Independents are evenly divided. #CatoPolls

Americans say the better solution to illegal immigration is simplifying the legal immigration process (56%); fewer think increasing border security and a border wall is the better approach (43%). A majority (55%) also favor a pathway to citizenship for unauthorized immigrants.
58% of strong liberals and 49% of liberals have unfavorable views of immigrants if they join the Republican party. In a similar fashion, 72% of strong conservatives and 55% of conservatives have unfavorable views of Democratic immigrants. #CatoPolls

Majorities of Republicans (80%), Democrats (65%), first‐generation immigrants (72%), second‐generation immigrants (63%), and the third generation and higher (71%) favor a “melting pot of cultures” rather than immigrants maintaining distinct cultures in the U.S. #CatoPolls
Majorities of Americans say it is either “extremely” or “very” important to them that immigrants (1) be loyal to Americans and the U.S. (71%), (2) be self‐reliant (69%), and (3) speak English fluently (53%). Democrats and Republicans disagree about assimilation preferences.

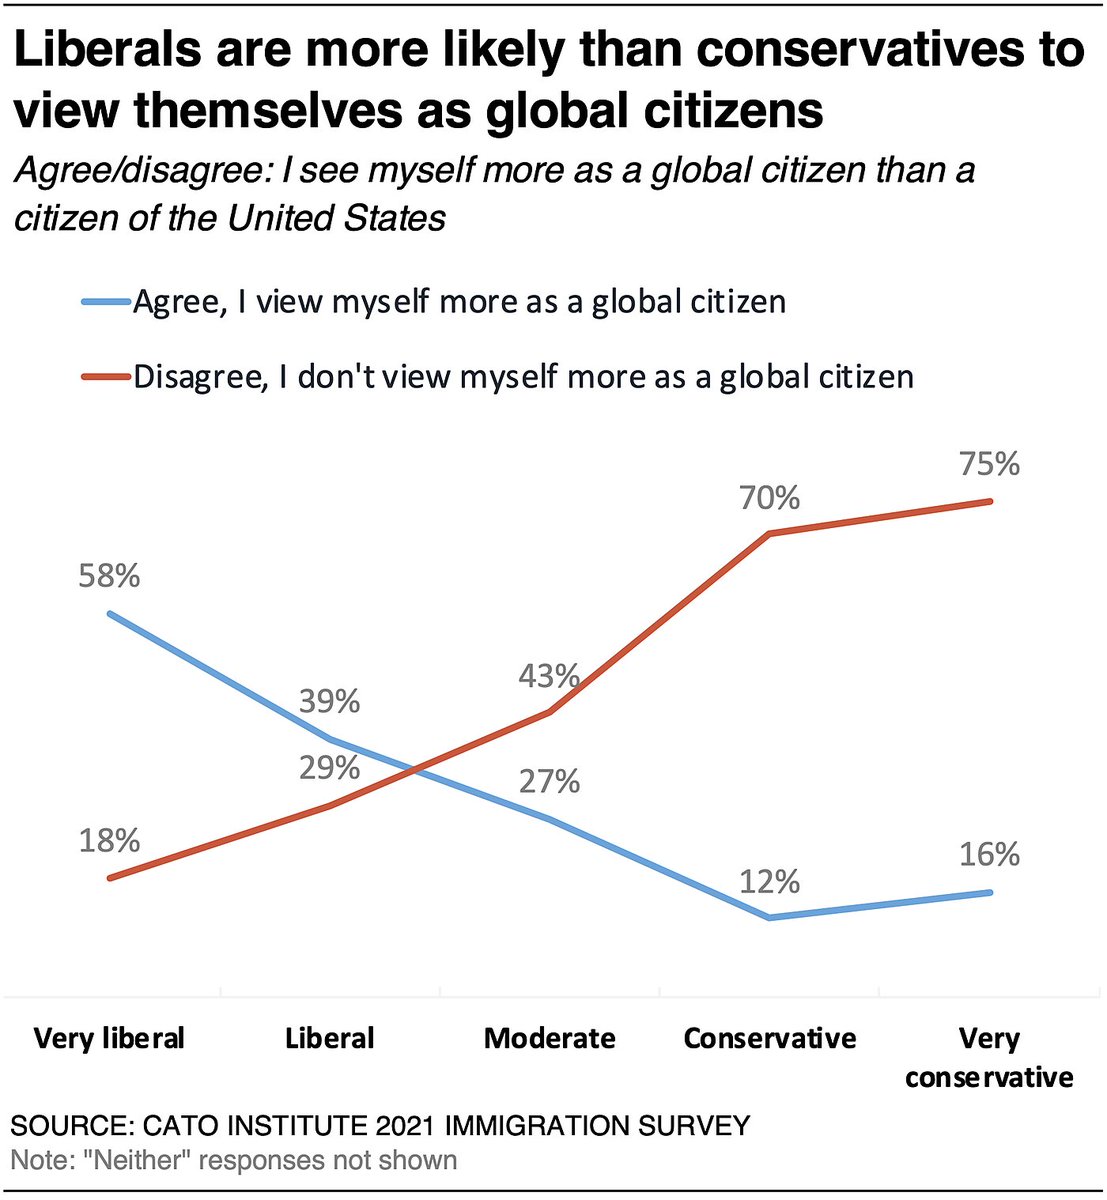
About a quarter (28%) of Americans view themselves more as a “global citizen than as a citizen of the United States,” and 58% of strong liberals agree. In contrast, 71% of strong conservatives view themselves first as U.S. citizens. #CatoPolls
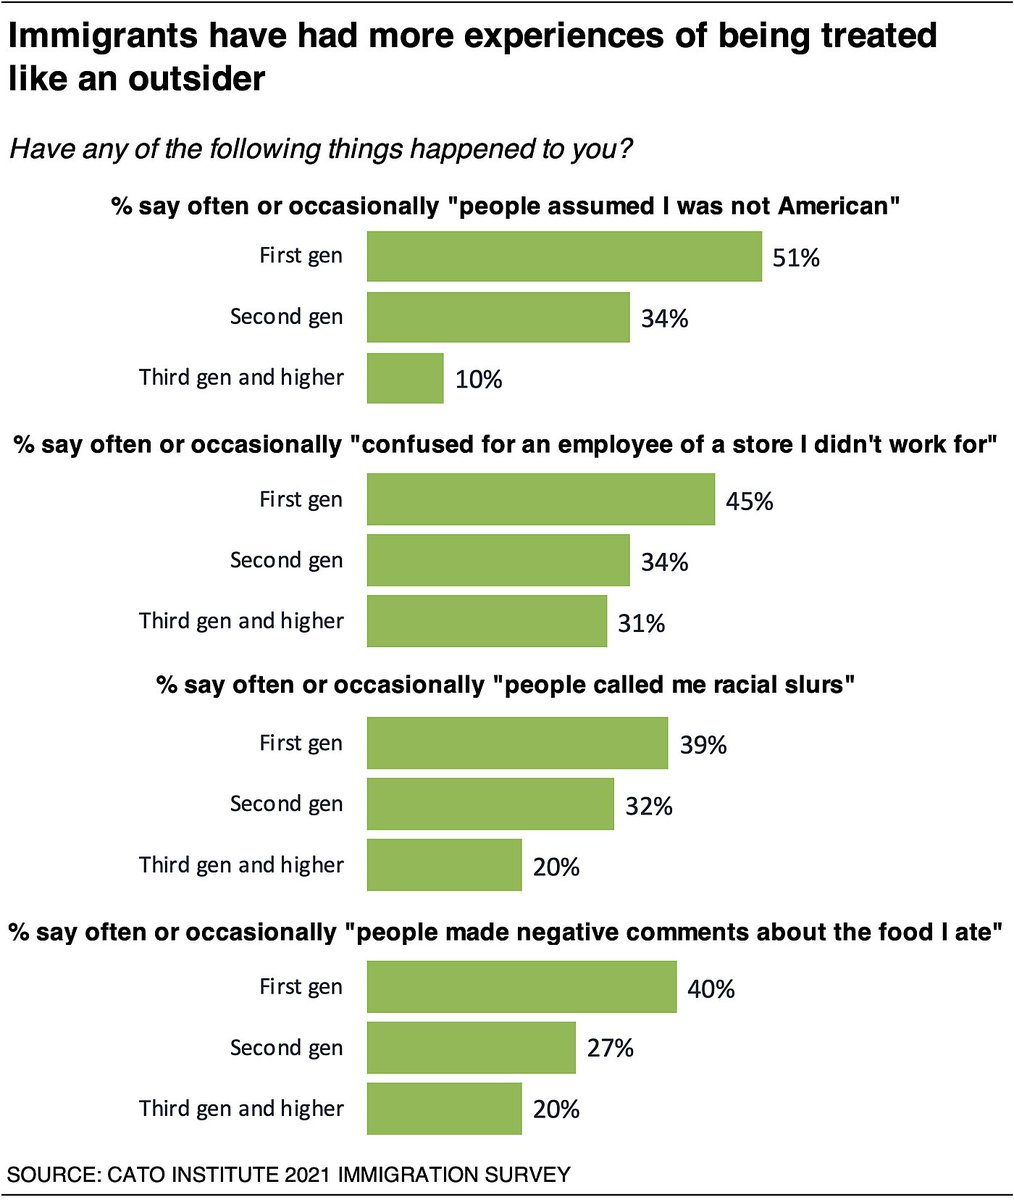
First‐generation immigrants are more likely than the third generation and higher to say that others presumed they were not American, confused them for a store employee where they didn’t work, called them racial slurs, or made negative comments about the food they ate. #CatoPolls
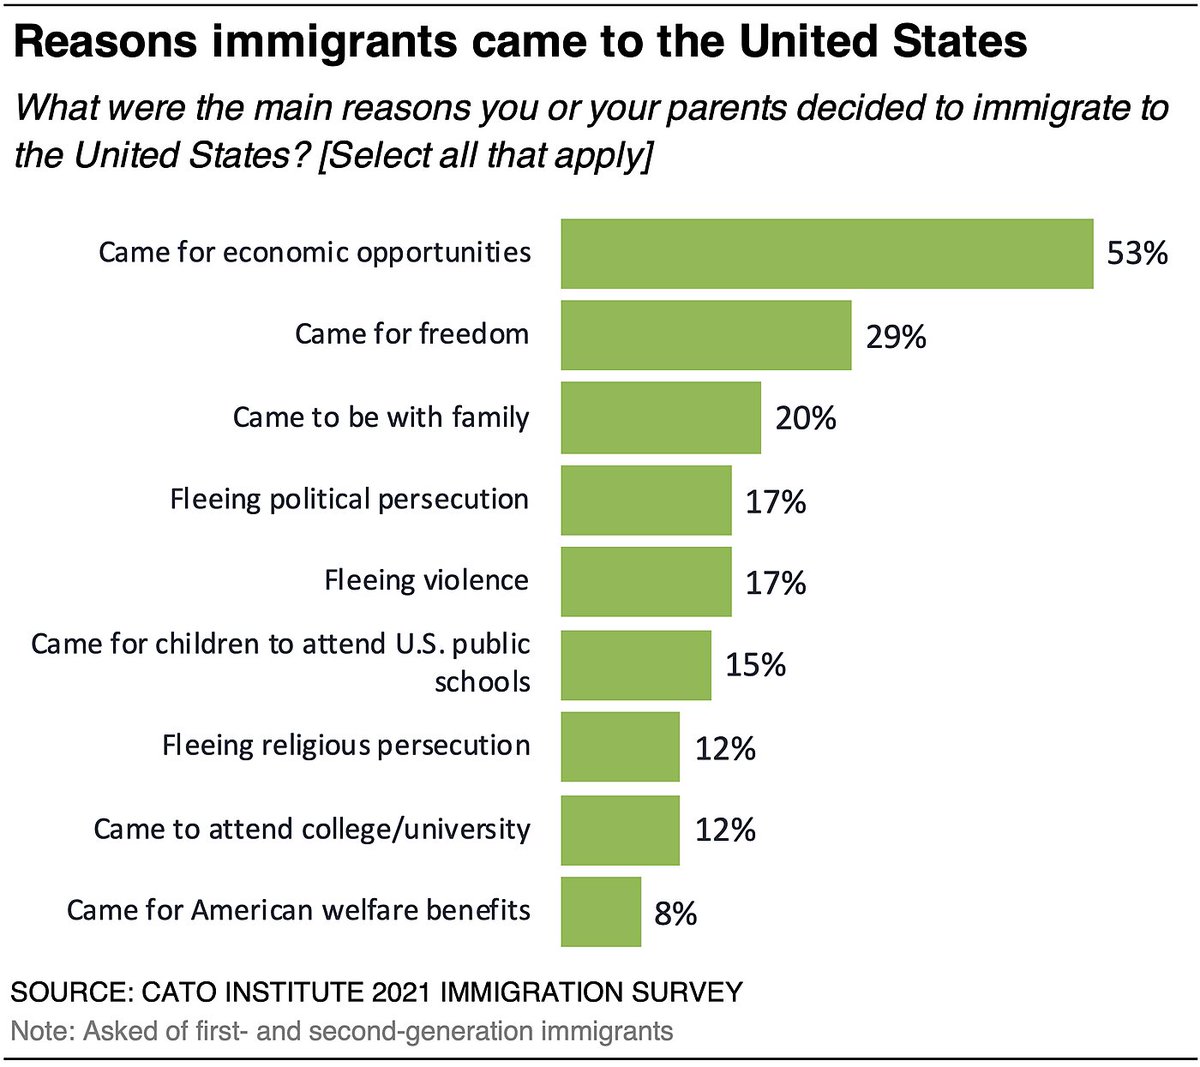
An overwhelming majority (80%) of immigrants say they feel grateful to be Americans. Most first‐ and second‐generation immigrants say their families came to the U.S. for economic opportunities (53%) and freedom (29%). #CatoPolls
• • •
Missing some Tweet in this thread? You can try to
force a refresh


