"Human-caused climate warming stops when humans stop adding CO₂ to the atmosphere, & emissions of other greenhouse gases are declining sufficiently" (text from @KA_Nicholas)
A THREAD on a recent presentation on net-zero emissions...
slideshare.net/GlenPeters_CIC…
A THREAD on a recent presentation on net-zero emissions...
slideshare.net/GlenPeters_CIC…
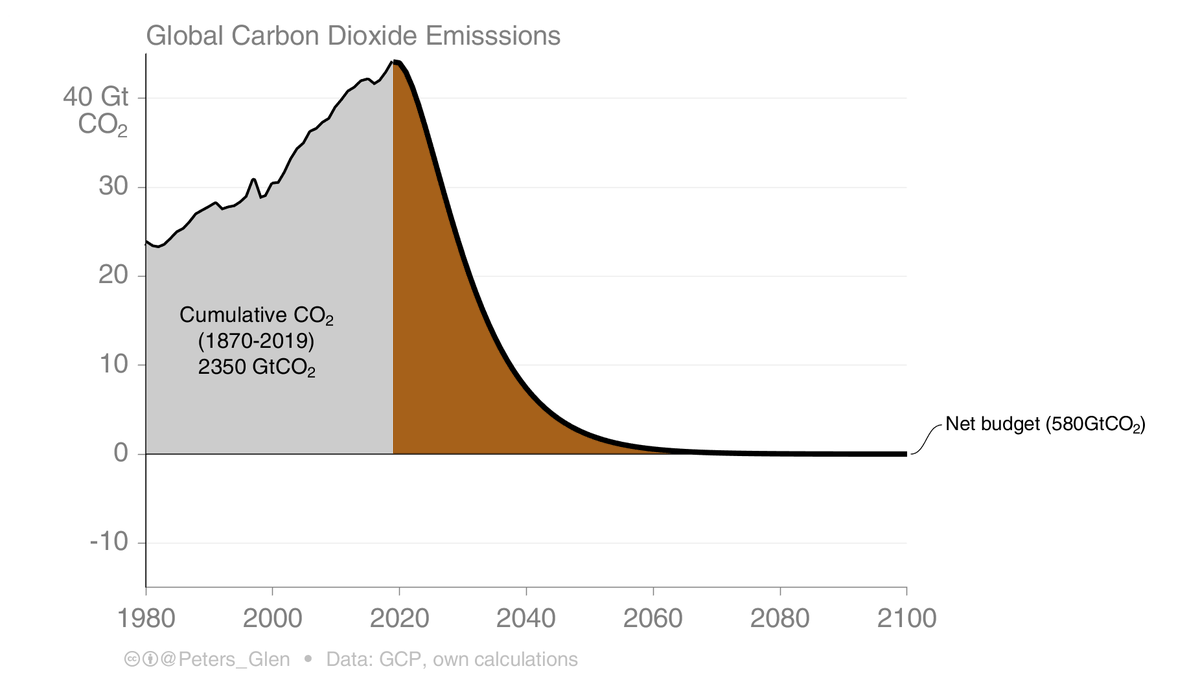
2. The near-linear relationship between global warming & CO₂ emissions allows a remaining carbon budget to be defined.
This remaining carbon budget can be distributed over time in many different ways, leading to different 'net-zero' years.
This remaining carbon budget can be distributed over time in many different ways, leading to different 'net-zero' years.

3. It is possible to distribute the remaining carbon budget in a way that it never goes below zero (the brown area is the remaining carbon budget).
This is a simplification of reality, but a helpful comparison to other pathways.
This is a simplification of reality, but a helpful comparison to other pathways.
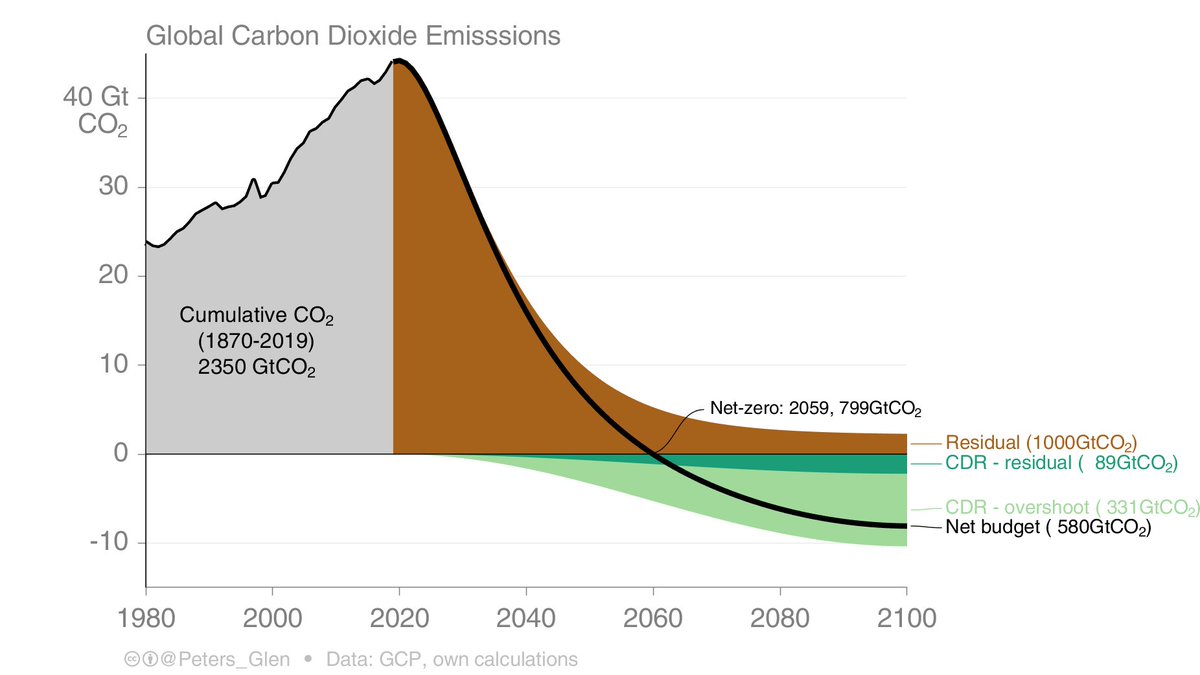
4. It may be too difficult or costly to get all CO₂ emissions to zero, & we may instead use Carbon Dioxide Removal (CDR) to offset some of those emissions, such as through modest afforestation.
This means CO₂ emissions go down 𝐬𝐥𝐢𝐠𝐡𝐭𝐥𝐲 slower in the short-term.
This means CO₂ emissions go down 𝐬𝐥𝐢𝐠𝐡𝐭𝐥𝐲 slower in the short-term.

5. Nearly all cost-optimising emission scenarios, in contrast, have large-scale CDR. This leads to lower CO₂ reductions in the short-term, large-scale CDR, & a peak & decline temperature profile (overshoot).
CO₂ reductions in the short term are only 𝐬𝐥𝐢𝐠𝐡𝐭𝐥𝐲 lower.
CO₂ reductions in the short term are only 𝐬𝐥𝐢𝐠𝐡𝐭𝐥𝐲 lower.
6. These emission profiles have two components:
E) Emissions from sources (e.g., burning fossil fuels)
R) Removals from sinks (e.g., growing a forest)
The "net" is N=E-R, emissions minus removals.
At net-zero, E<R, & since removals are physically constrained, so are emissions.
E) Emissions from sources (e.g., burning fossil fuels)
R) Removals from sinks (e.g., growing a forest)
The "net" is N=E-R, emissions minus removals.
At net-zero, E<R, & since removals are physically constrained, so are emissions.
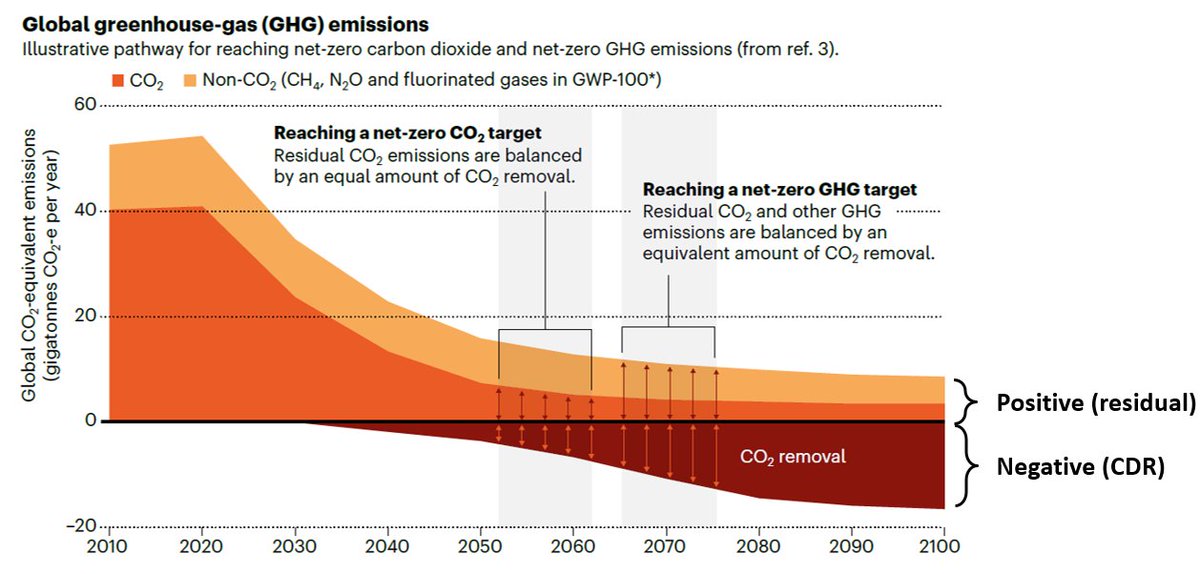
7. There is a lot of debate on net-zero, but this proposal by @KA_Nicholas gets around the issue (& includes non-CO₂ emissions)
"Human-caused climate warming stops when humans stop adding CO₂ to the atmosphere, & emissions of other greenhouse gases are declining sufficiently"
"Human-caused climate warming stops when humans stop adding CO₂ to the atmosphere, & emissions of other greenhouse gases are declining sufficiently"
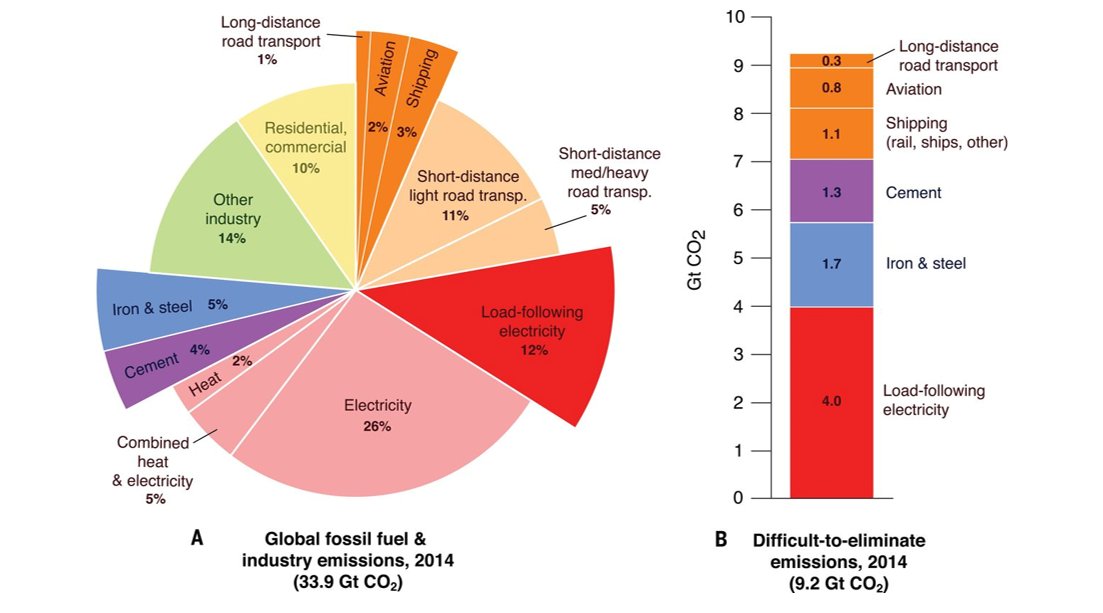
8. Why do we need CDR in the first place? Well, it may be a more effective way to eliminate all emissions from the 'difficult-to-abate' sectors.
science.sciencemag.org/content/360/63…
All tools are needed - efficiency, dematerialisation, technology - CDR wipes up the remaining emissions.
science.sciencemag.org/content/360/63…
All tools are needed - efficiency, dematerialisation, technology - CDR wipes up the remaining emissions.
9. There are also non-CO₂ emissions, such as methane from cows & paddy rice, nitrous oxide from fertilisation, air pollutants (causes a 'cooling')
CDR may be needed to offset some warming from non-CO₂, but since most non-CO₂ emissions are short-lived, CDR may not be needed
CDR may be needed to offset some warming from non-CO₂, but since most non-CO₂ emissions are short-lived, CDR may not be needed

10. There are many CDR options, but all are limited by scale, in most cases maturity, & in most cases permanence.
Therefore, we should be frugal in their use, & not put all our eggs in the CDR basket.
Sort of obviously, it makes sense to reduce emissions first...
Therefore, we should be frugal in their use, & not put all our eggs in the CDR basket.
Sort of obviously, it makes sense to reduce emissions first...

11. Net-zero emissions are the latest rage, but also very confusing:
* Global cost optimal pathways frame the debate
* Net-zero CO₂ & GHG emissions differ
* Loopholes abound
* Ambiguity rules in this space
A good summary of the issues
nature.com/articles/d4158…
* Global cost optimal pathways frame the debate
* Net-zero CO₂ & GHG emissions differ
* Loopholes abound
* Ambiguity rules in this space
A good summary of the issues
nature.com/articles/d4158…
12/12. All this complexity, when there is such a simple solution...
Here is the presentation
slideshare.net/GlenPeters_CIC…
Here is the presentation
slideshare.net/GlenPeters_CIC…

• • •
Missing some Tweet in this thread? You can try to
force a refresh