
1/🧵
Here’s Buffett at 32, when he earned a million per year - or $8.8M per year in today’s dollars.
In this thread, we celebrate #BerkshireHathaway AGM weekend by looking closer at how he did it. We finish with a link to the 152 pages of gold: Buffett Partnership letters.
Here’s Buffett at 32, when he earned a million per year - or $8.8M per year in today’s dollars.
In this thread, we celebrate #BerkshireHathaway AGM weekend by looking closer at how he did it. We finish with a link to the 152 pages of gold: Buffett Partnership letters.
2/🧵
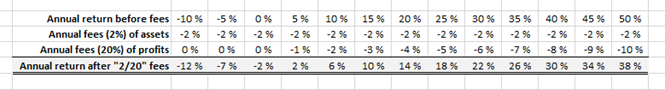
Many hedge fund managers expense so-called “2/20”, meaning that whatever happens with the investments, they get 2% of the assets plus 20% of any profits.
Even though they’d underperform the market, such system would incentivize them for the effort.
“Thanks!”
Many hedge fund managers expense so-called “2/20”, meaning that whatever happens with the investments, they get 2% of the assets plus 20% of any profits.
Even though they’d underperform the market, such system would incentivize them for the effort.
“Thanks!”
3/🧵
Here’s the outcome for the investors in this typical 2/20 model. See how 5% returns before fees leave investors with only 2% returns after fees (40% of the total).
But Buffett was different.
Here’s the outcome for the investors in this typical 2/20 model. See how 5% returns before fees leave investors with only 2% returns after fees (40% of the total).
But Buffett was different.
4/🧵
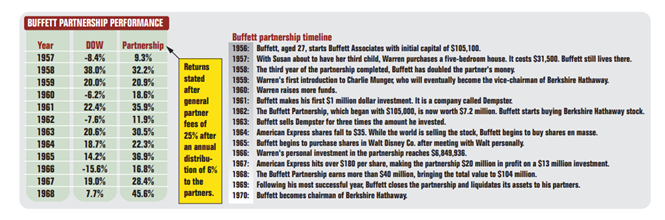
Buffett, aged 26, started Buffett Associates (later to be consolidated to Buffett Partnership) with initial capital of $105,100.
In total he raised $105,000 in capital and put in $100 himself. As he put it: “there's no prize for guessing who put in the $100”.
Buffett, aged 26, started Buffett Associates (later to be consolidated to Buffett Partnership) with initial capital of $105,100.
In total he raised $105,000 in capital and put in $100 himself. As he put it: “there's no prize for guessing who put in the $100”.
5/🧵
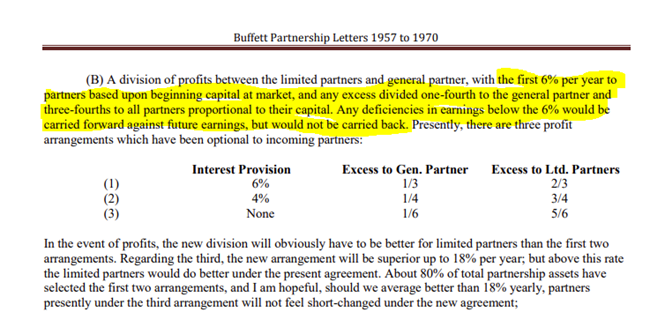
He was no fan of getting paid for nothing. The partnership had various fee structures (see pic below) but mainly the approach was:
- Investors are first paid 6% hurdle rate
- 25% of any excess profits to Buffett, remaining 75% to investors
He was no fan of getting paid for nothing. The partnership had various fee structures (see pic below) but mainly the approach was:
- Investors are first paid 6% hurdle rate
- 25% of any excess profits to Buffett, remaining 75% to investors
6/🧵
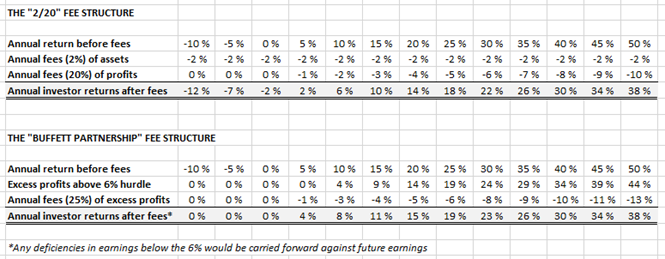
The Buffett Partnership fee structure was a thing of wonder (albeit only for superior investors).
See attached how his approach protected his Limited Partners from downside, while providing himself with great upside potential.
Oh, did he make his time worthwhile.
The Buffett Partnership fee structure was a thing of wonder (albeit only for superior investors).
See attached how his approach protected his Limited Partners from downside, while providing himself with great upside potential.
Oh, did he make his time worthwhile.
7/🧵
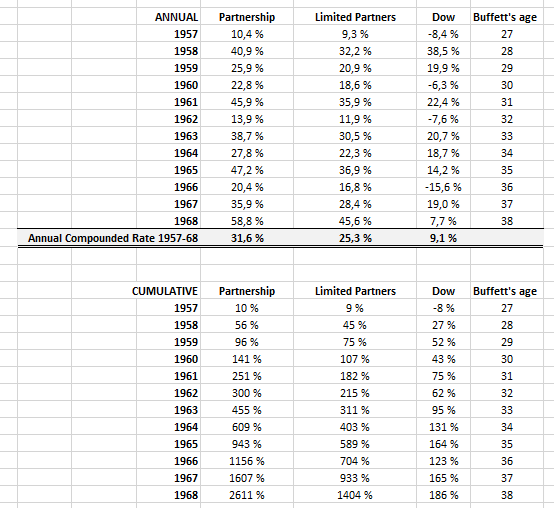
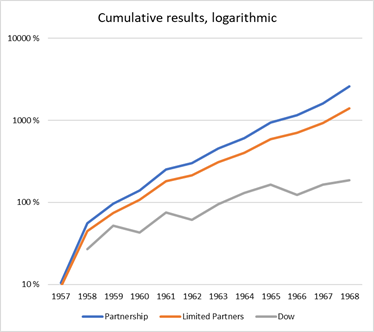
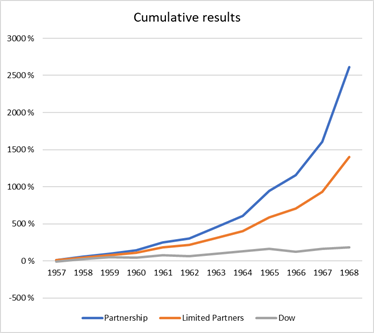
The Buffett Partnership quickly left all major indices in the dust. Its overperformance was staggering despite the fund manager’s relatively young age.
You can imagine what kind of an impact this had on Buffett’s wealth.
The Buffett Partnership quickly left all major indices in the dust. Its overperformance was staggering despite the fund manager’s relatively young age.
You can imagine what kind of an impact this had on Buffett’s wealth.
8/🧵
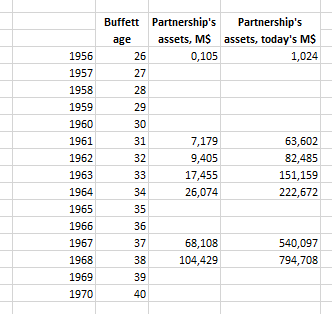
At inception in 1956, Buffett had put in $100.
In 1961, Warren and his wife Susie already had a net worth of $1.025M in the partnership. That’s roughly $200k per year ($1.5M per year in today’s dollars) for the Buffetts in 1956-1961.
But that was only the start.
At inception in 1956, Buffett had put in $100.
In 1961, Warren and his wife Susie already had a net worth of $1.025M in the partnership. That’s roughly $200k per year ($1.5M per year in today’s dollars) for the Buffetts in 1956-1961.
But that was only the start.
9/🧵
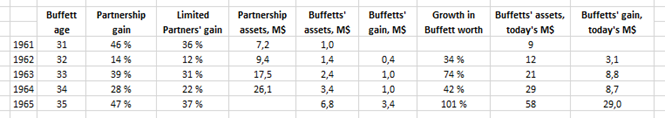
In 1961-1965, Buffett’s worth grew 34-101% per year with the success of the partnership, well exceeding the partnership gains of 14-47% per year.
At the age of 35, Buffett’s annual gains, in today’s dollars, reached a stunning $29M.
In 1961-1965, Buffett’s worth grew 34-101% per year with the success of the partnership, well exceeding the partnership gains of 14-47% per year.
At the age of 35, Buffett’s annual gains, in today’s dollars, reached a stunning $29M.
10/🧵
The partnership ended up growing from $105,100 in 1956 to $7.2M in 1961, only to exceed $100M in size by 1968.
After finding no more attractive buying opportunities in 1969, Buffett liquidated the partnership and started to focus on a company called Berkshire Hathaway.
The partnership ended up growing from $105,100 in 1956 to $7.2M in 1961, only to exceed $100M in size by 1968.
After finding no more attractive buying opportunities in 1969, Buffett liquidated the partnership and started to focus on a company called Berkshire Hathaway.
11/🧵
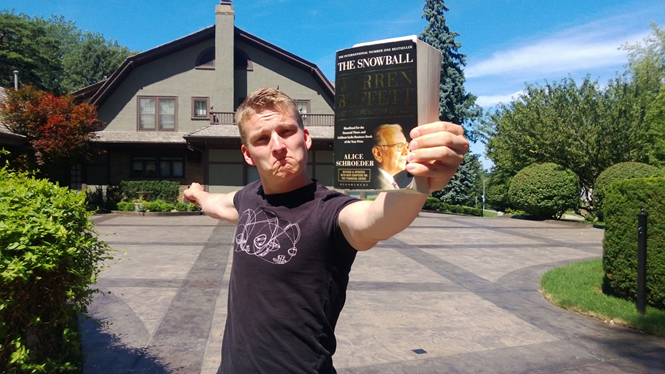
Here’s me on my pilgrimage to Buffett’s house in Omaha almost a decade ago. Can’t wait for the coronavirus to pass and visit the Annual General Meeting in person.
Hope to meet as many of you there.
Here’s me on my pilgrimage to Buffett’s house in Omaha almost a decade ago. Can’t wait for the coronavirus to pass and visit the Annual General Meeting in person.
Hope to meet as many of you there.
12/🧵
Highly recommend reading the amazing partnership letters (152p) from csinvesting.org/wp-content/upl…
Thank you for making it this far with me 😊 Remember to enjoy the meeting today from finance.yahoo.com/brklivestream/
Have a nice weekend!
Highly recommend reading the amazing partnership letters (152p) from csinvesting.org/wp-content/upl…
Thank you for making it this far with me 😊 Remember to enjoy the meeting today from finance.yahoo.com/brklivestream/
Have a nice weekend!
• • •
Missing some Tweet in this thread? You can try to
force a refresh


