Where does the plastic in the ocean come from?
A new study published in @ScienceAdvances updates our understanding.
My latest @OurWorldInData article looks at the global picture of plastic pollution: ourworldindata.org/ocean-plastics
Thread of key points 👇
A new study published in @ScienceAdvances updates our understanding.
My latest @OurWorldInData article looks at the global picture of plastic pollution: ourworldindata.org/ocean-plastics
Thread of key points 👇
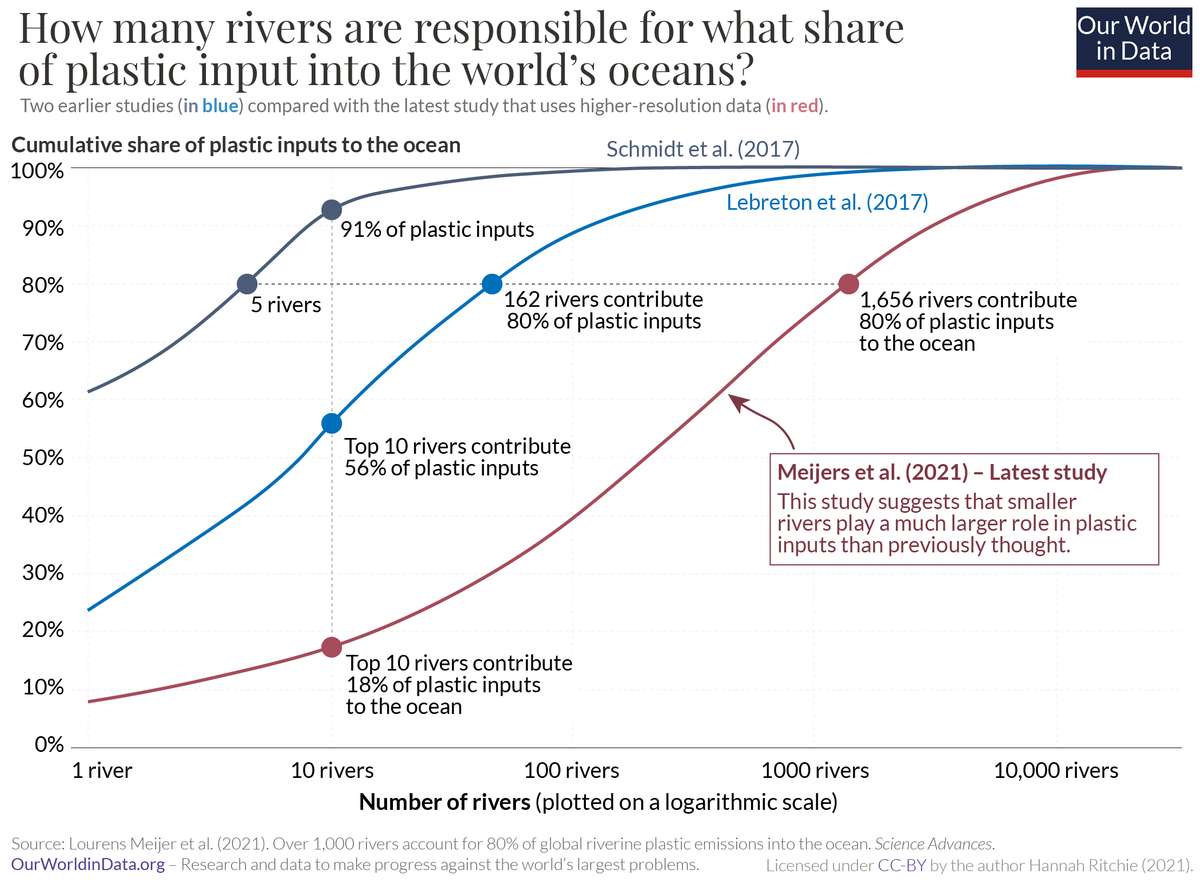
Previous studies suggested a small number of big rivers accounted for most of ocean plastics.
But higher-resolution data suggests many more small rivers play a big role.
To cover 80% of plastic inputs you need to tackle > 1,000 rivers.
1/
But higher-resolution data suggests many more small rivers play a big role.
To cover 80% of plastic inputs you need to tackle > 1,000 rivers.
1/
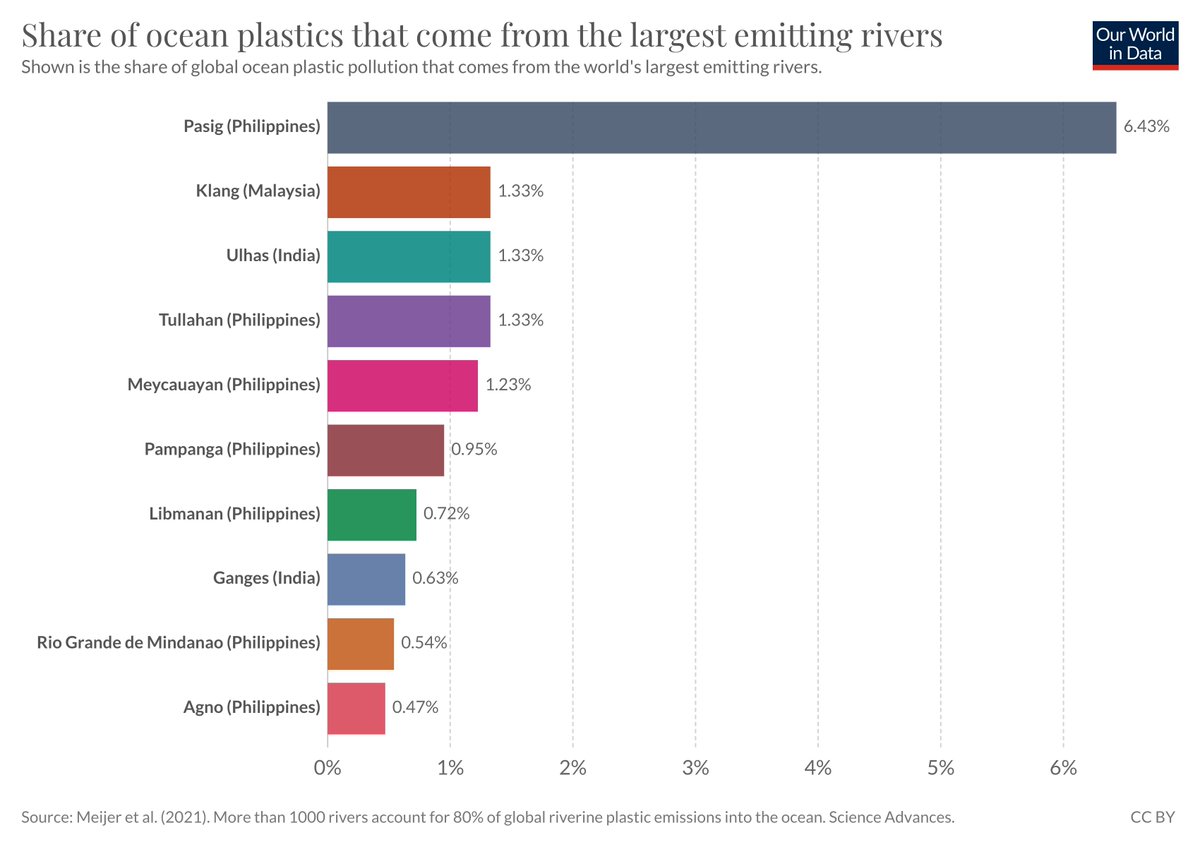
Factors that matter a lot for a river's plastic inputs:
– waste management practices
– distance to coast
– cities nearby
– precipitation rates
– slope of terrain
Here are the top 10 rivers 👇
(most are small rivers in the Philippines)
2/
– waste management practices
– distance to coast
– cities nearby
– precipitation rates
– slope of terrain
Here are the top 10 rivers 👇
(most are small rivers in the Philippines)
2/
Previous modelling did not have such high-resolution data on topography, terrain, climate etc.
Therefore put more emphasis on the *size* of the river basin. So it assumed: large river basin = lots of plastic inputs.
That's why the latest results are markedly different
3/
Therefore put more emphasis on the *size* of the river basin. So it assumed: large river basin = lots of plastic inputs.
That's why the latest results are markedly different
3/
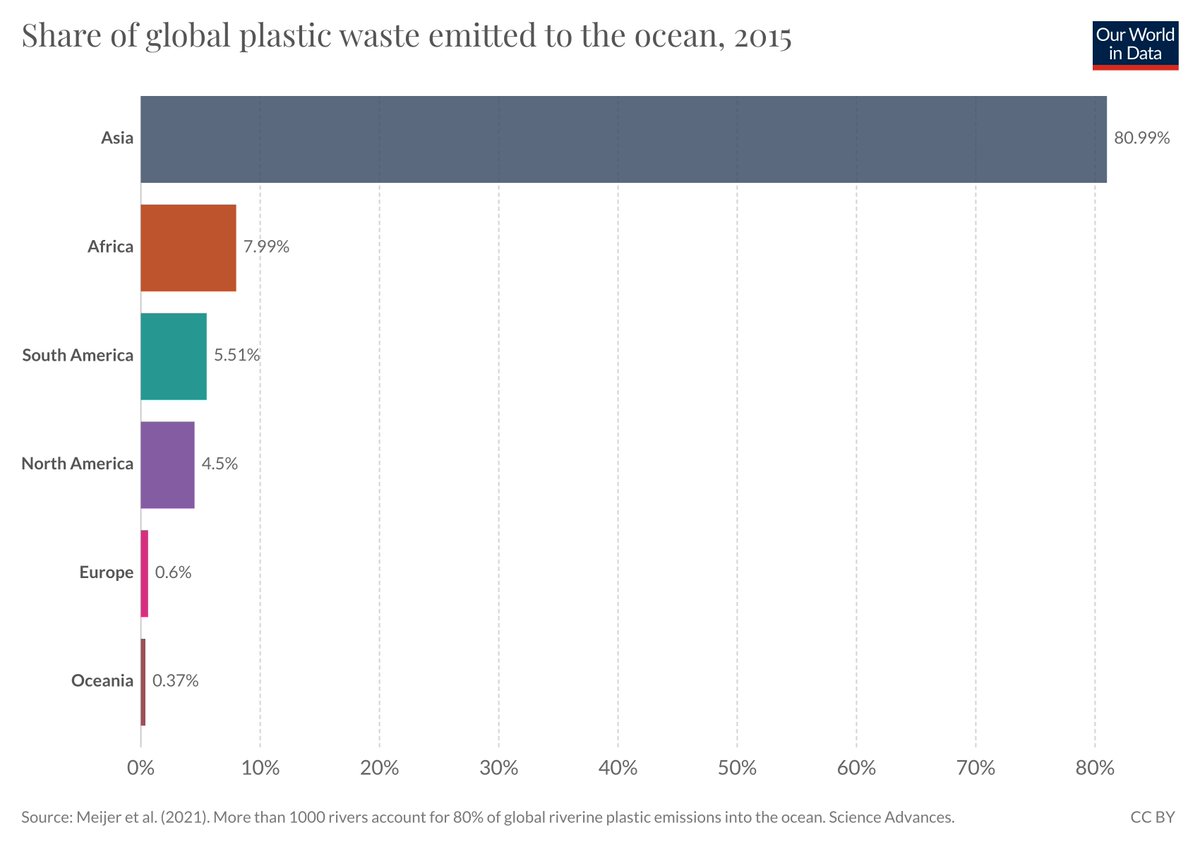
The regional distribution of plastic inputs is similar to previous studies.
Most plastic inputs come from rivers in Asia (81%).
4/
Most plastic inputs come from rivers in Asia (81%).
4/
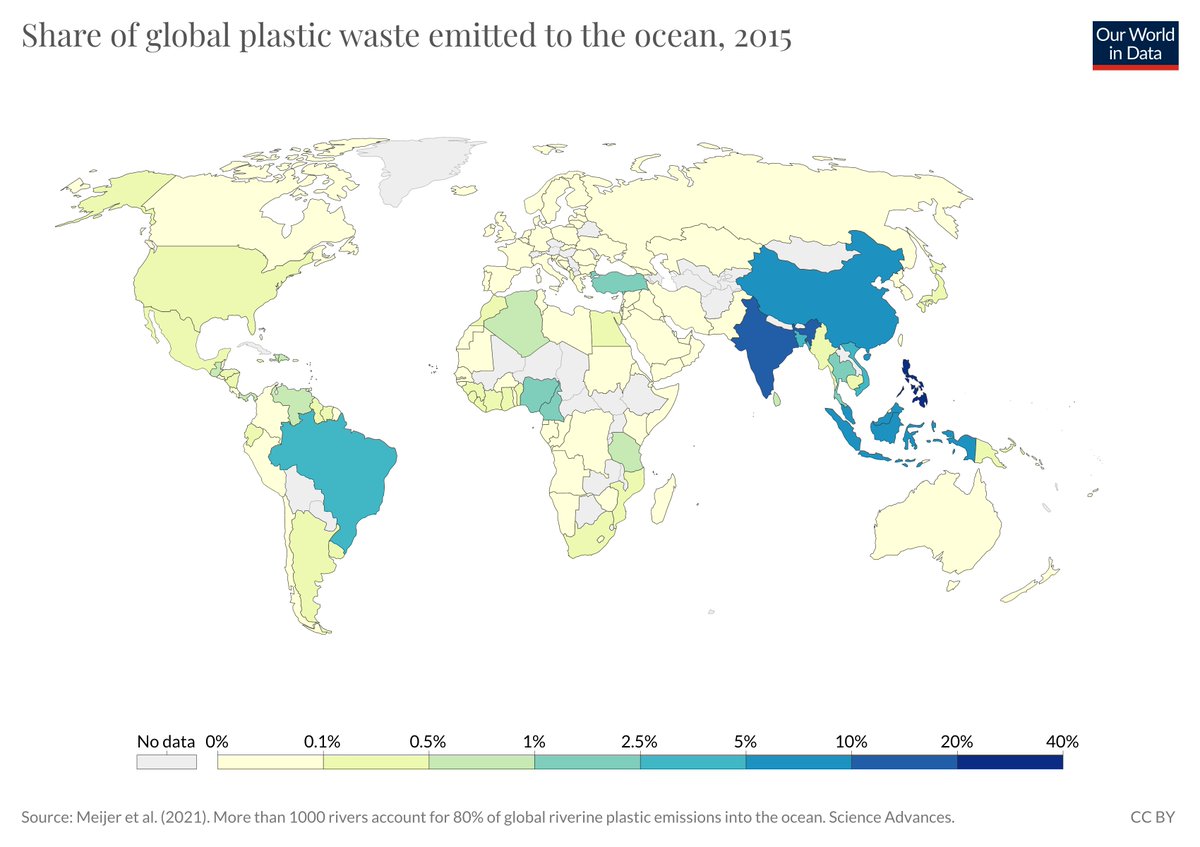
But some of the smaller countries in Asia play a larger role.
One-third comes from the Phillippines. It has a lot of small rivers with cities close to the coast.
5/
One-third comes from the Phillippines. It has a lot of small rivers with cities close to the coast.
5/
What people often get wrong about plastic pollution:
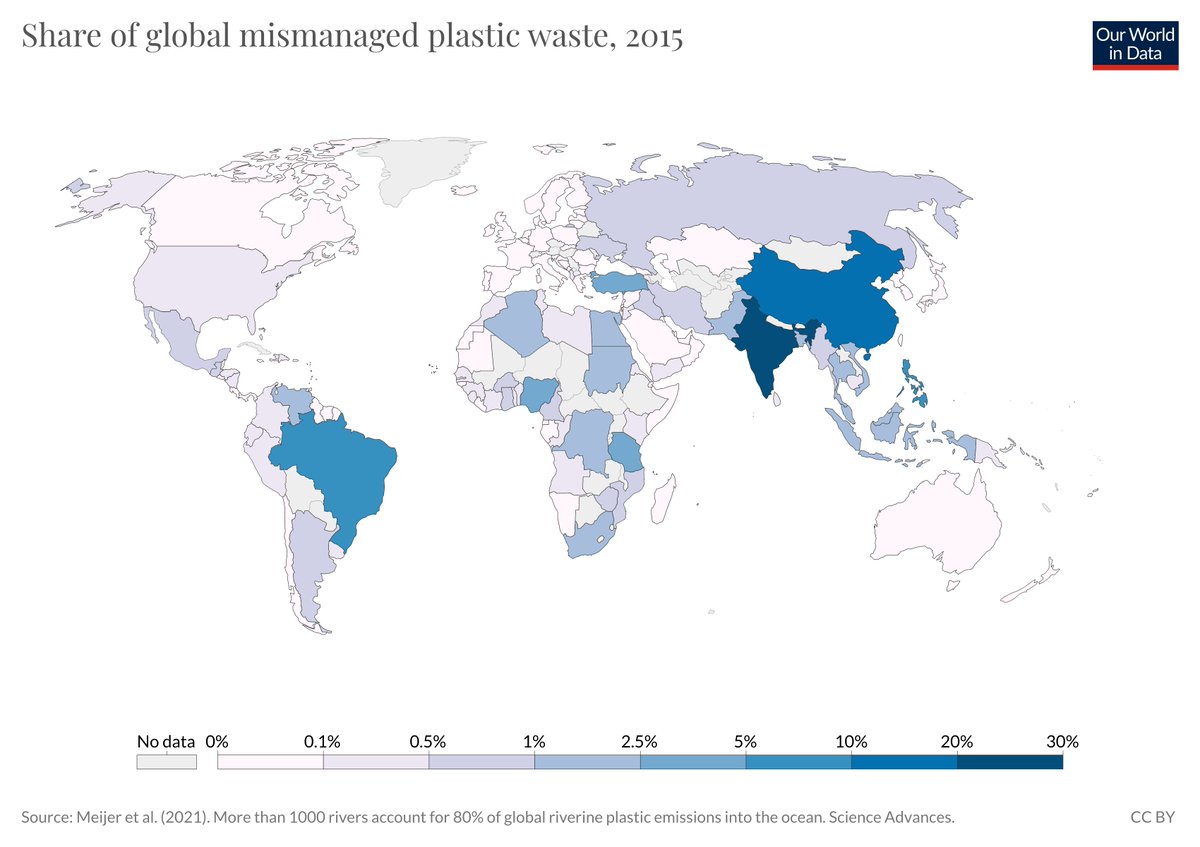
They underestimate how important waste management is.
It's not the case that using more plastic use = more pollution.
Most rich countries contribute very little because they manage the waste.
6/
They underestimate how important waste management is.
It's not the case that using more plastic use = more pollution.
Most rich countries contribute very little because they manage the waste.
6/
Improving waste management is not a sexy solution. Most people find it boring.
But if you're serious about tackling plastic pollution, this is where to put your focus and investment.
7/
But if you're serious about tackling plastic pollution, this is where to put your focus and investment.
7/
This recent paper is from @LourensWater & colleagues in @ScienceAdvances.
You can check it out here: advances.sciencemag.org/content/7/18/e…
8/
You can check it out here: advances.sciencemag.org/content/7/18/e…
8/
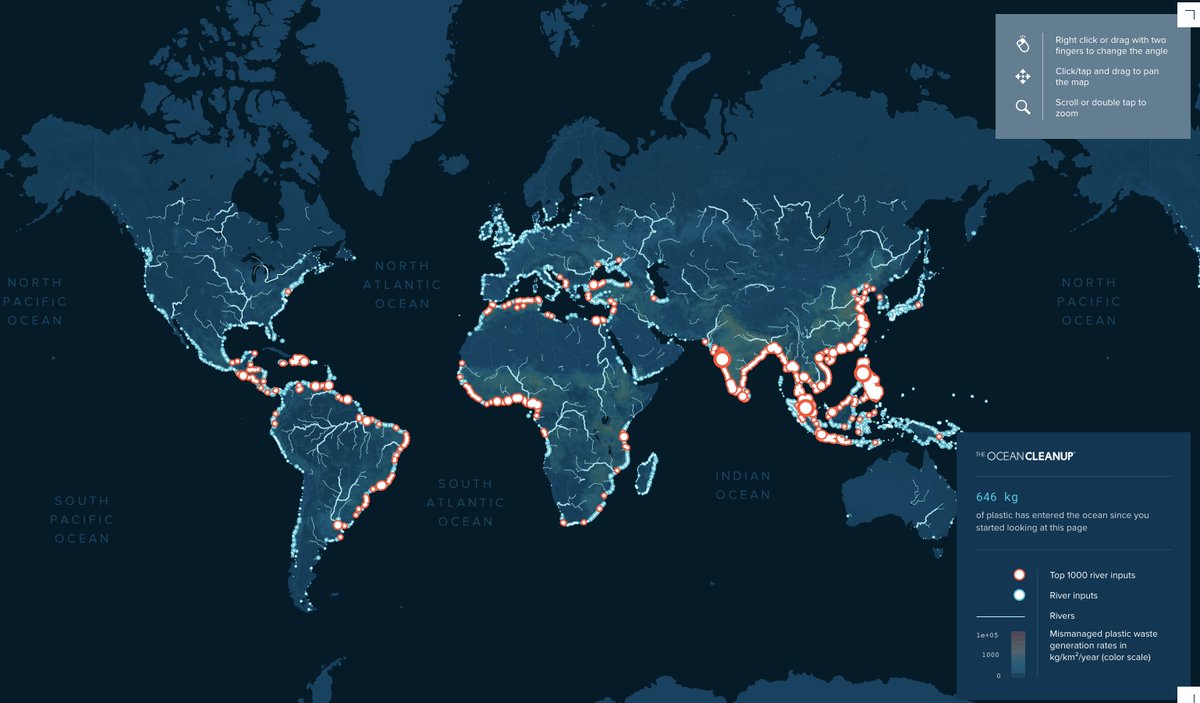
And @TheOceanCleanup has a beautiful high-resolution map with all the rivers that I recommend you check out: theoceancleanup.com/rivers/
/end
/end
• • •
Missing some Tweet in this thread? You can try to
force a refresh


