The Great Big Canadian Pandemic Summary Thread (2nd edition)
Since the first summary a month ago, much of Canada has experienced a 3rd wave of cases which has since crested.
There will be 2 parts: 1 summarizing each part of the country, and the other looking at determinants.
Since the first summary a month ago, much of Canada has experienced a 3rd wave of cases which has since crested.
There will be 2 parts: 1 summarizing each part of the country, and the other looking at determinants.
https://twitter.com/WilsonKM2/status/1378384597390659591
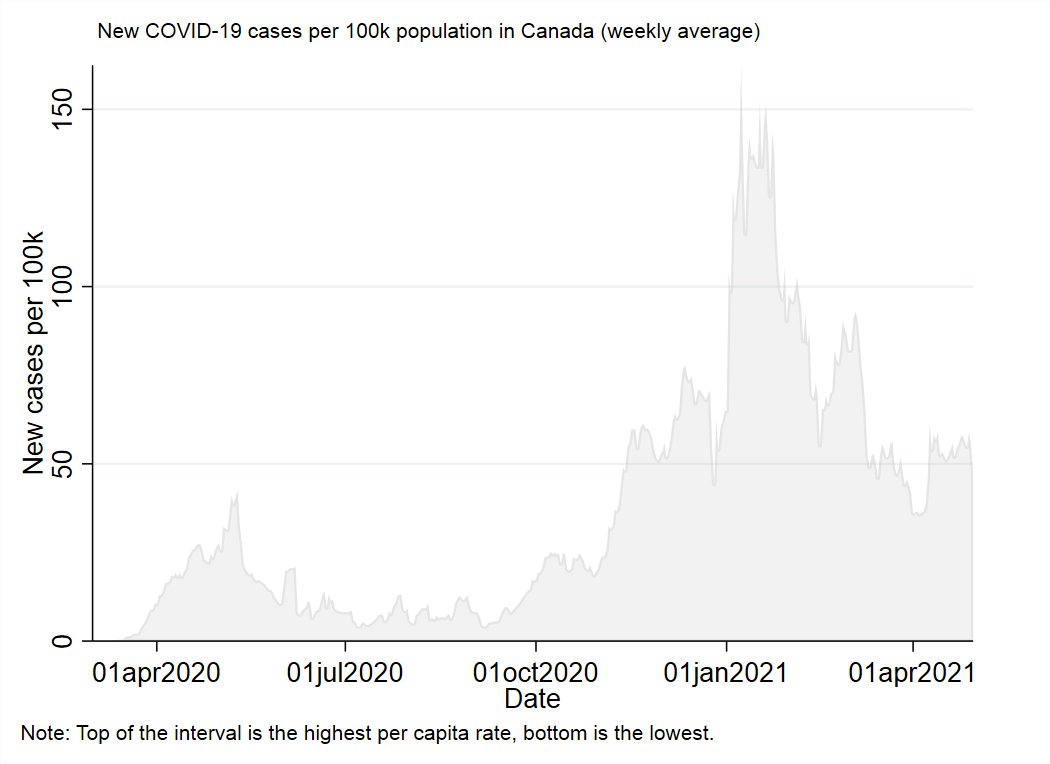
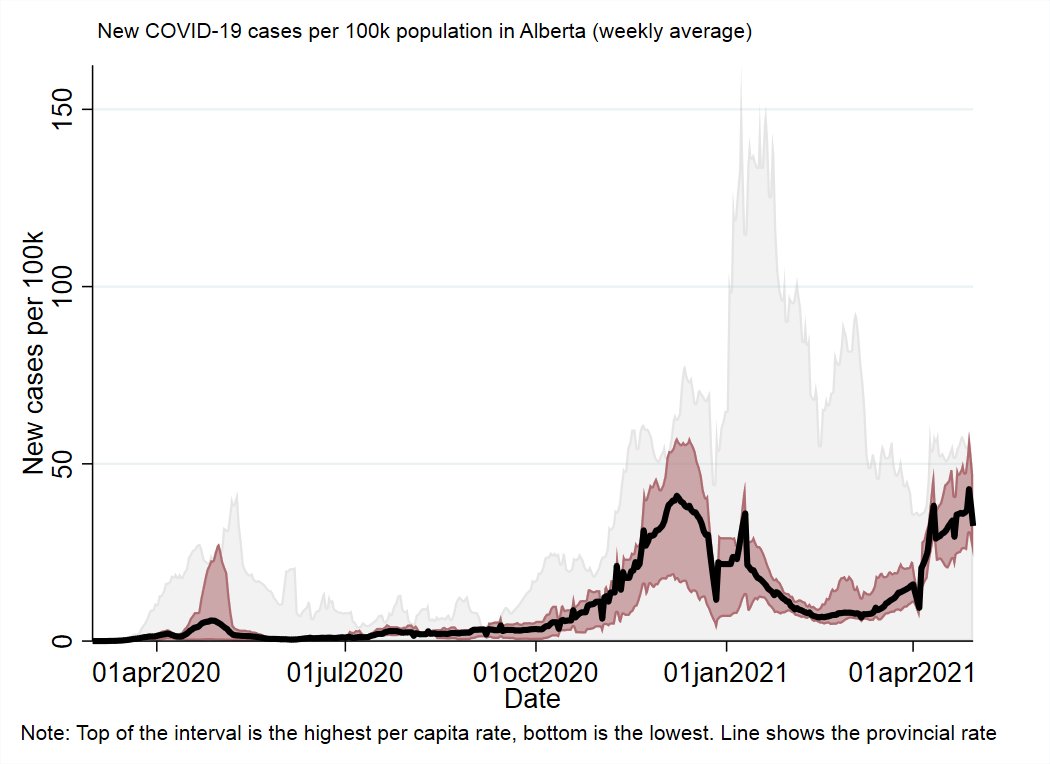
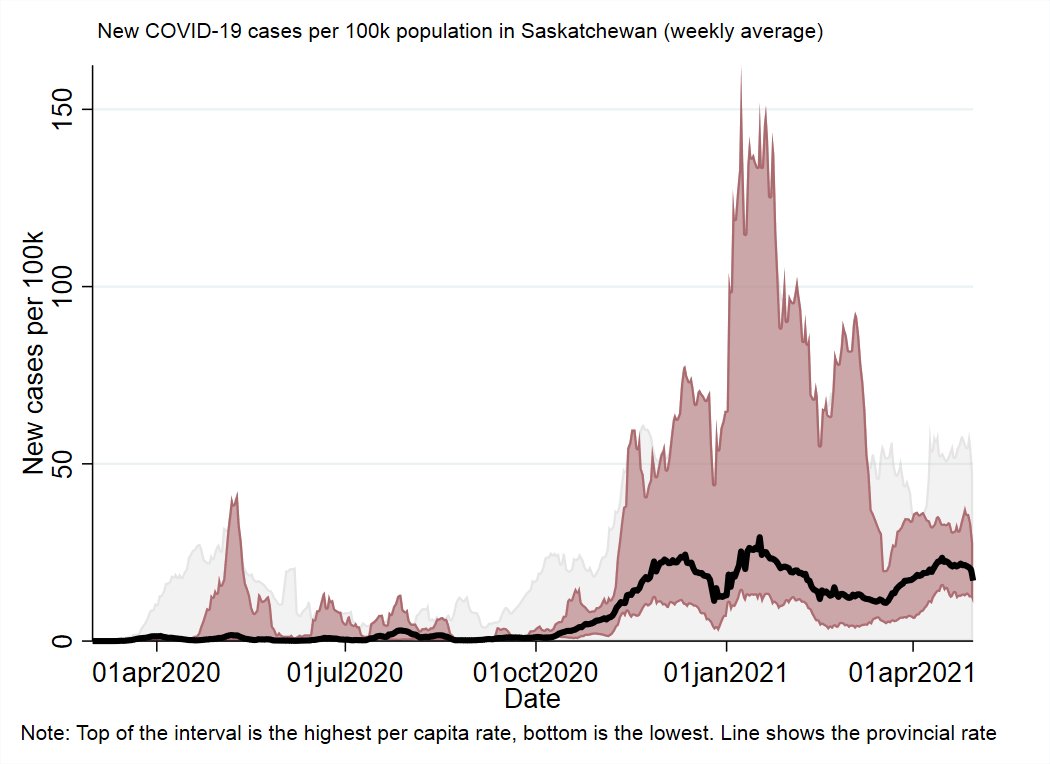
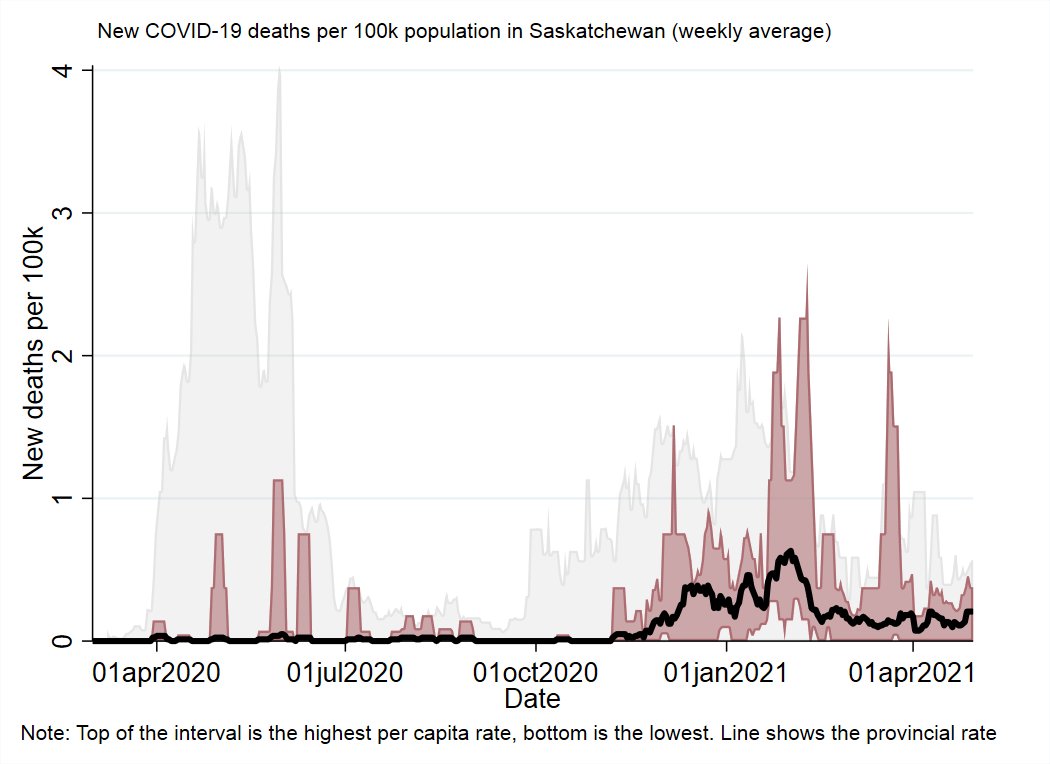
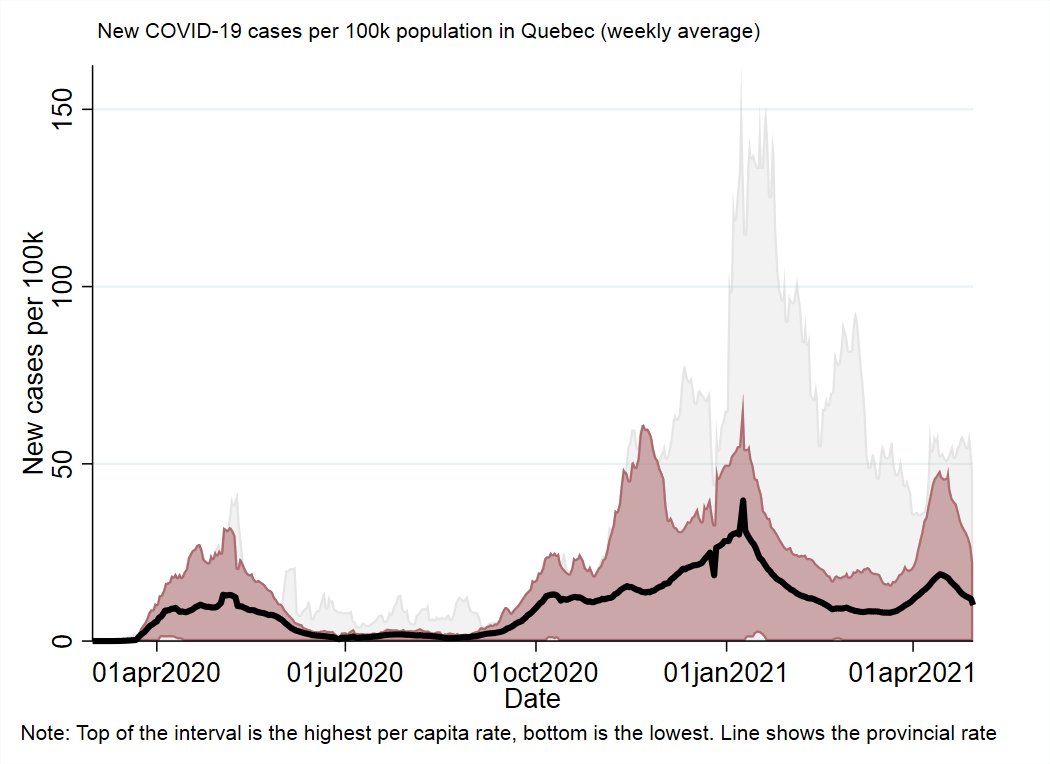
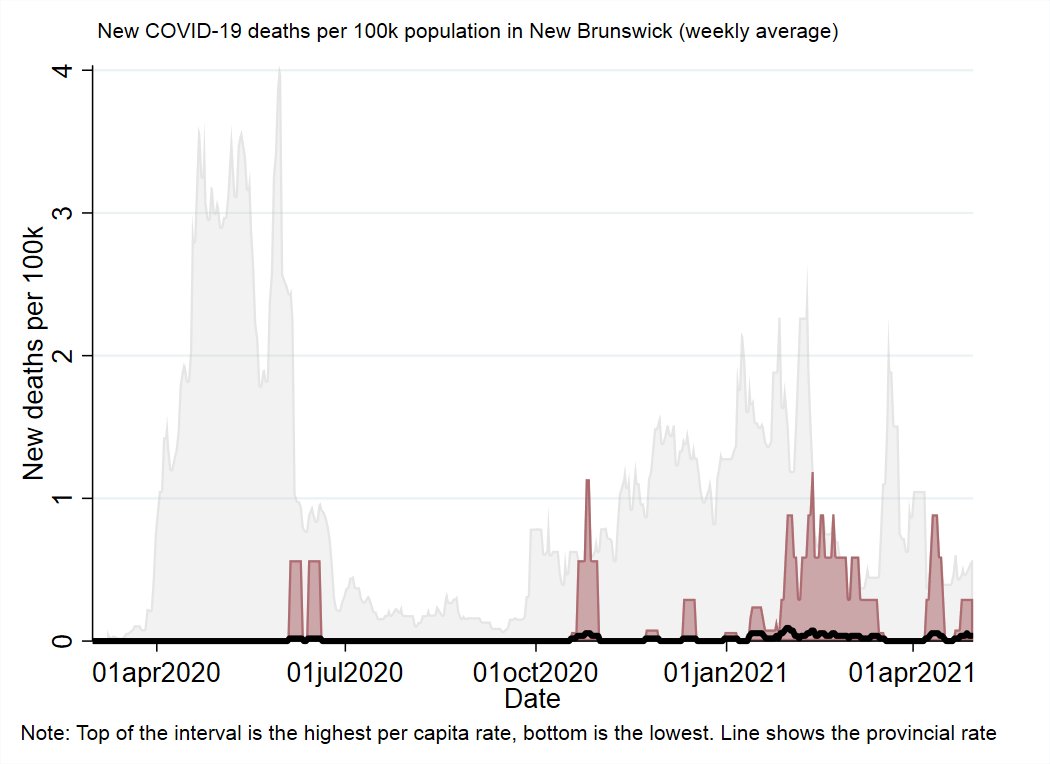
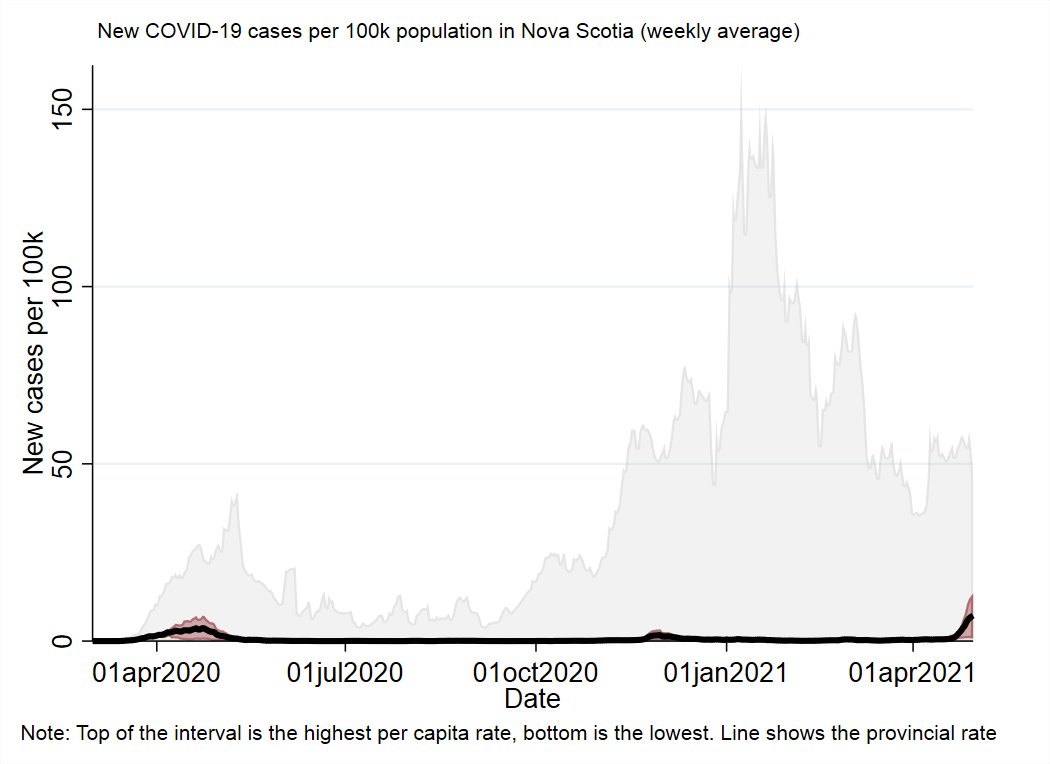
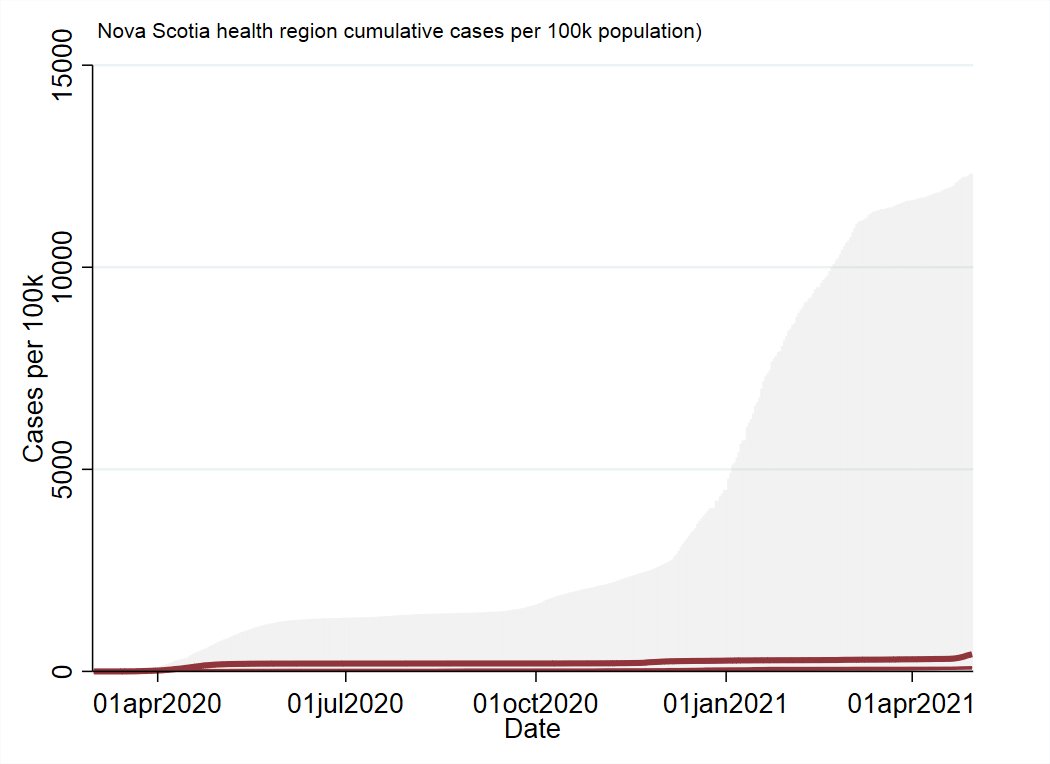
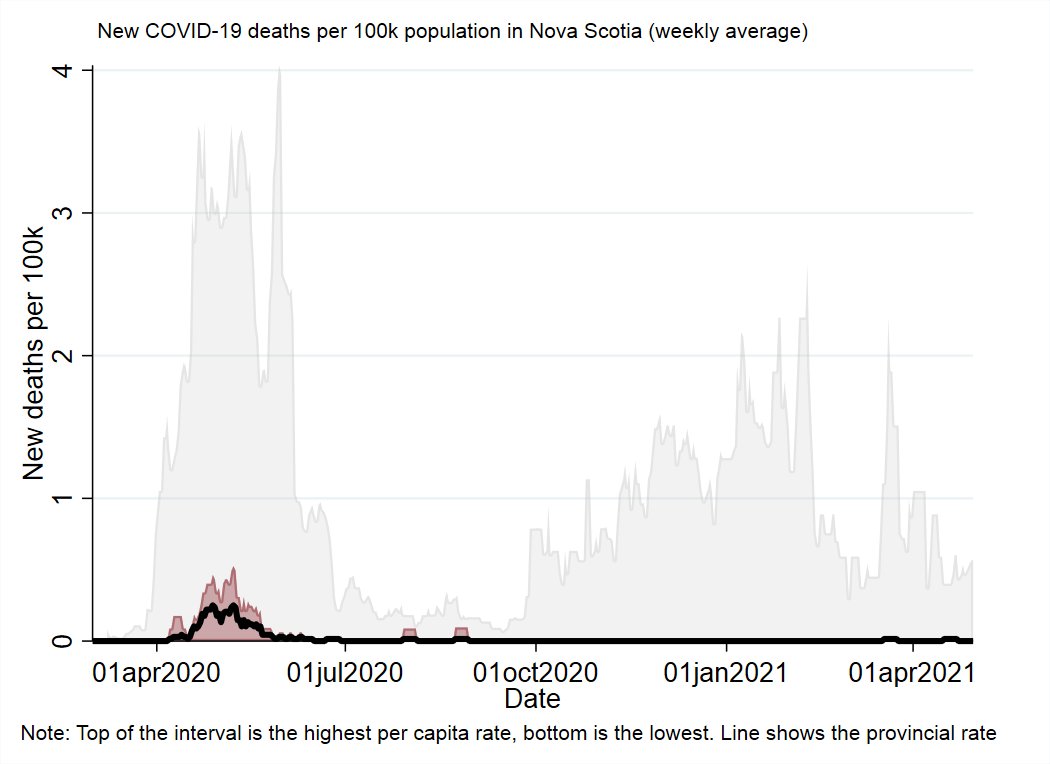
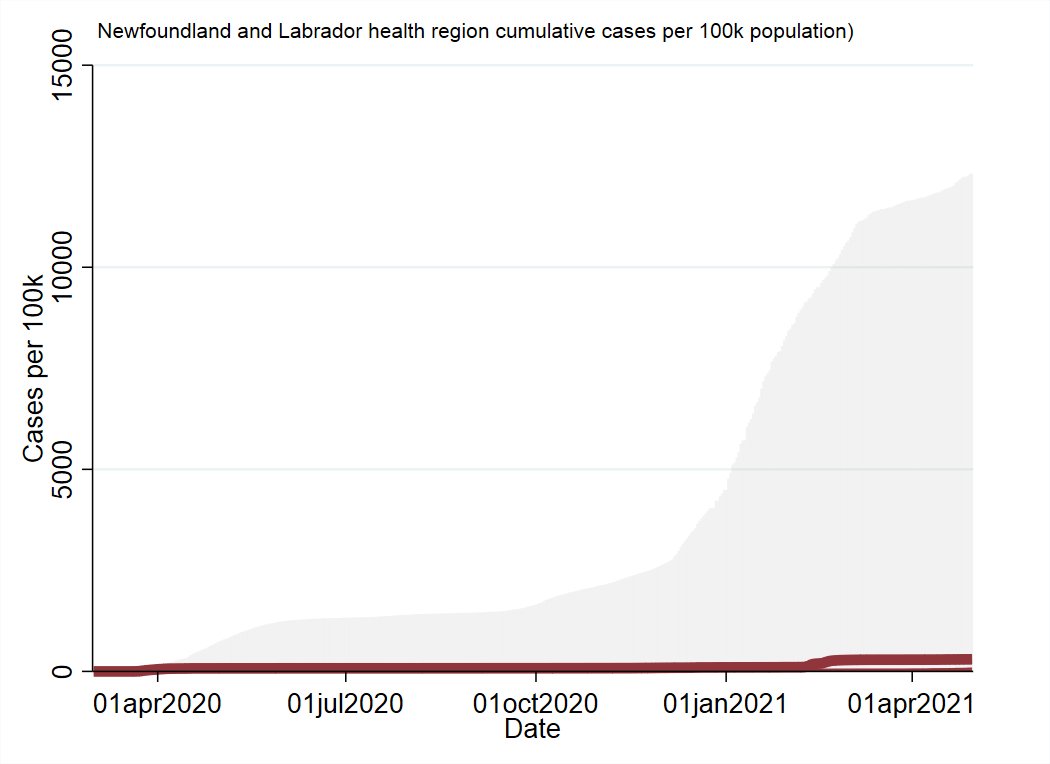
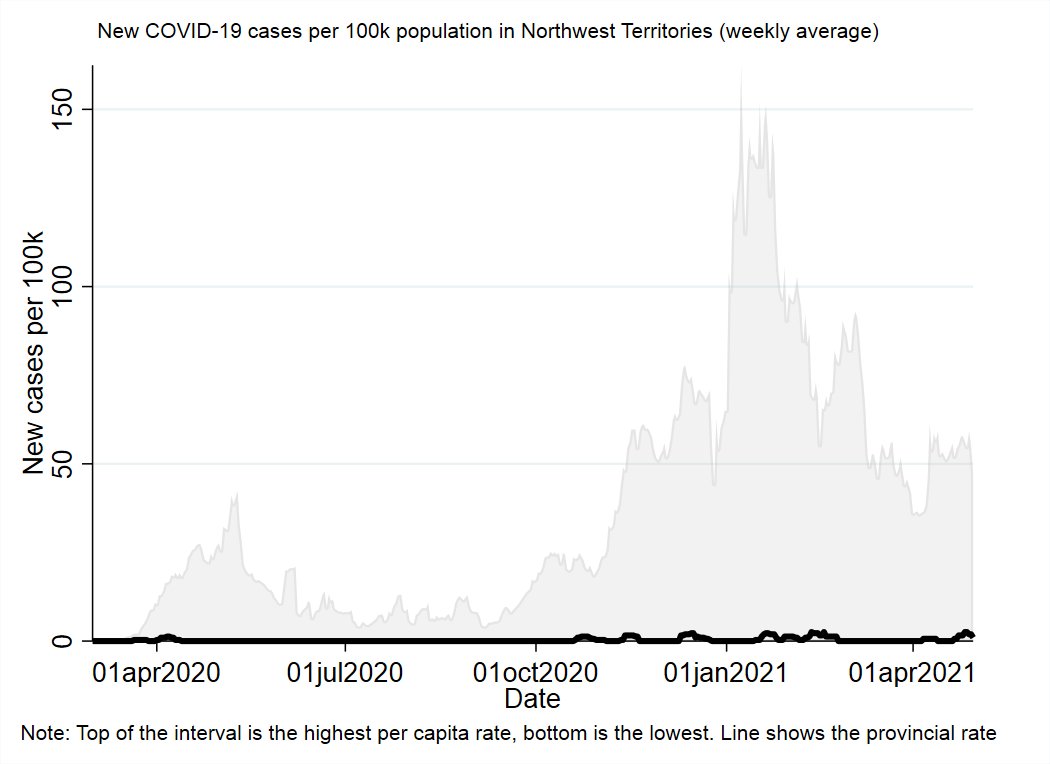
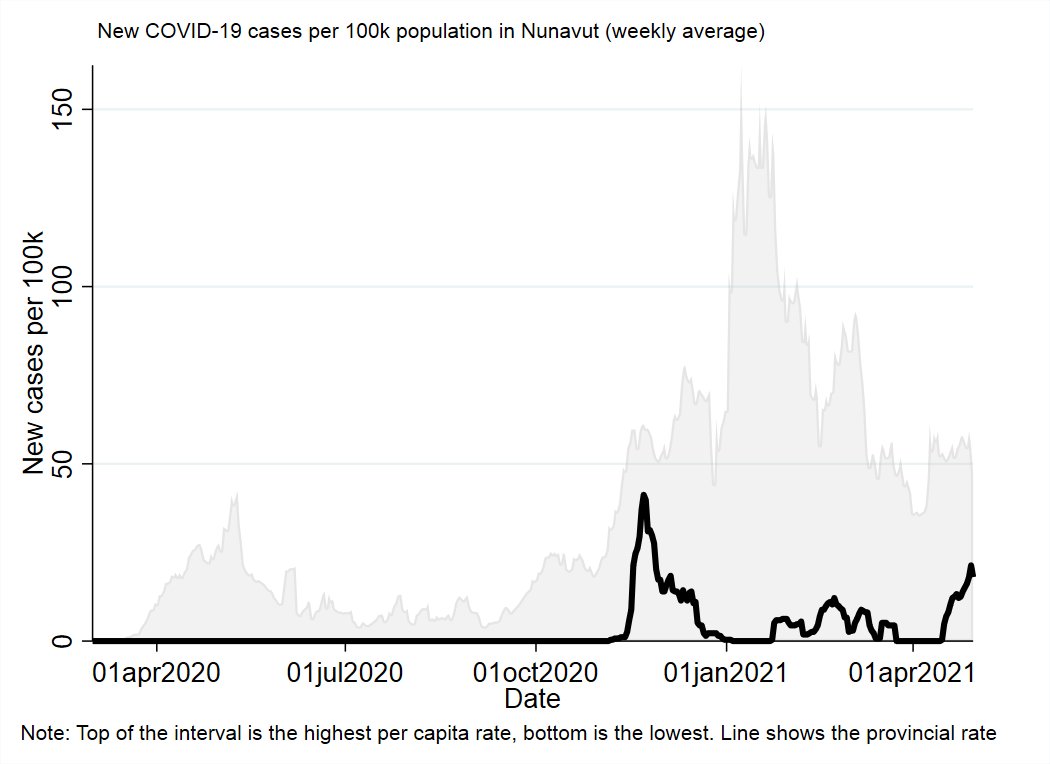
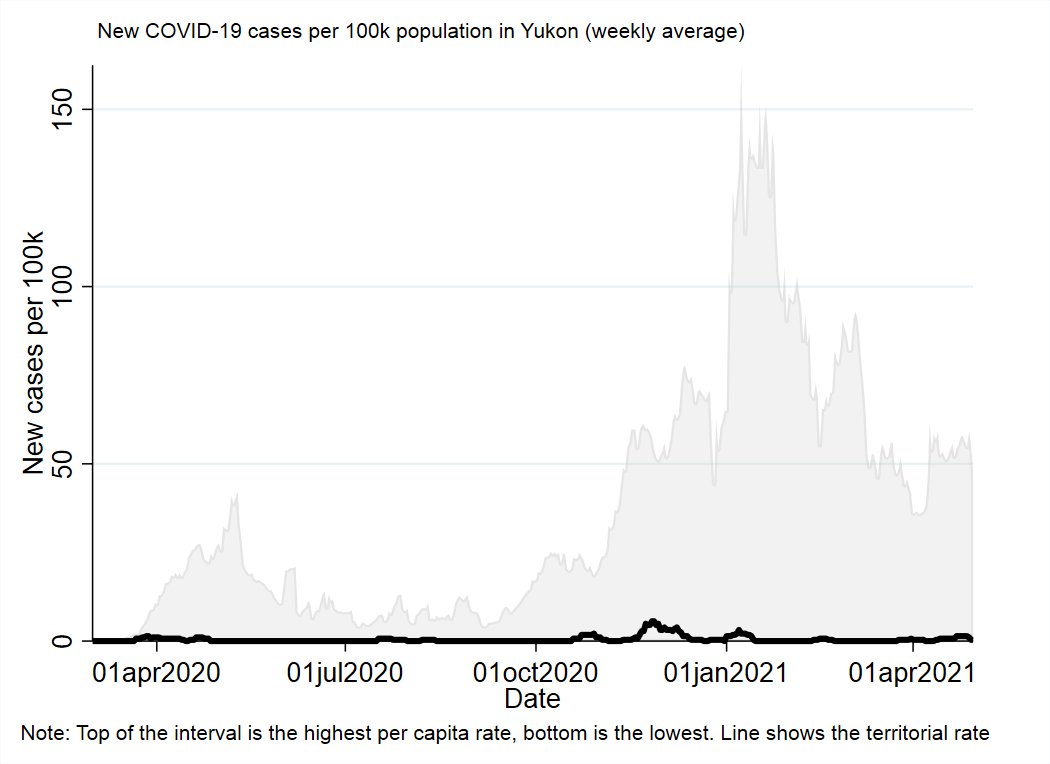
For all the graphs, I have the national range in the background in grey: the bottom is the lowest per capita rate by any health region and the top is the highest per capita rate.
So everything will be visible on the same scale.
Examples:
So everything will be visible on the same scale.
Examples:

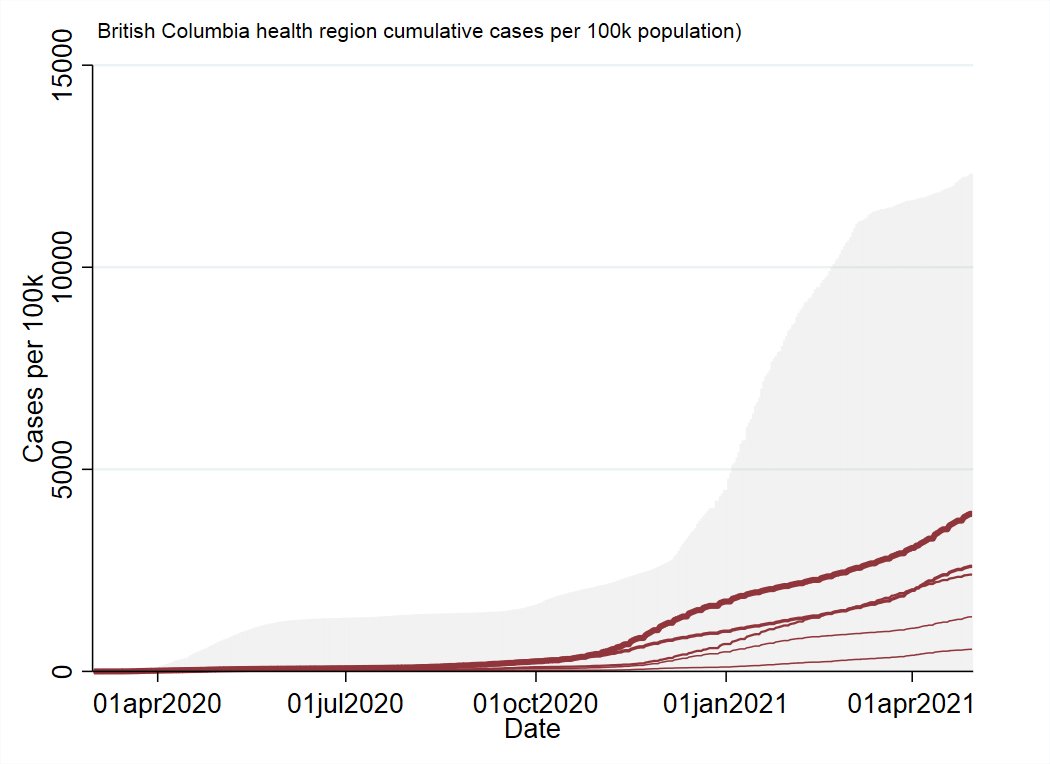
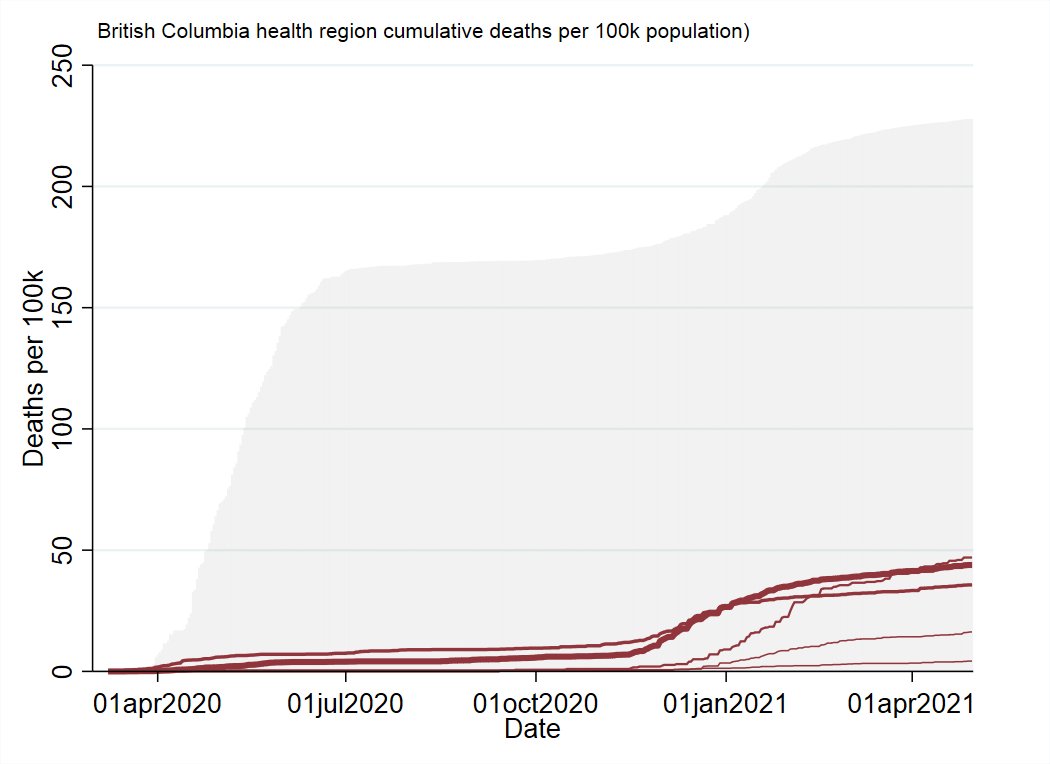
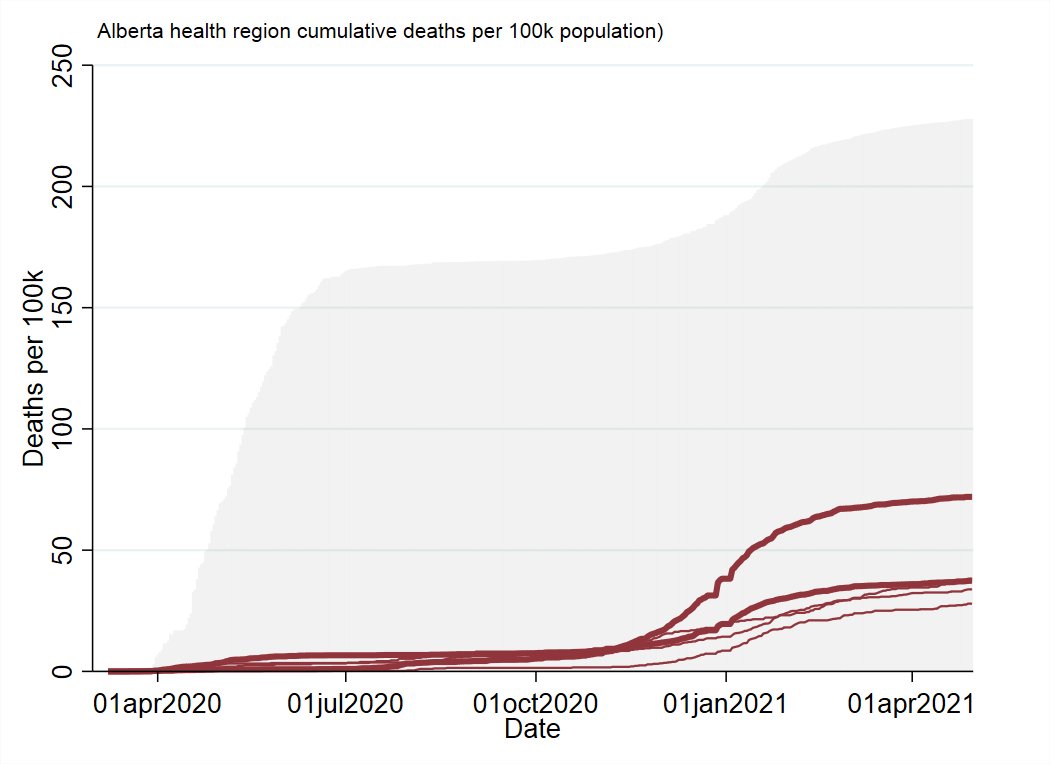
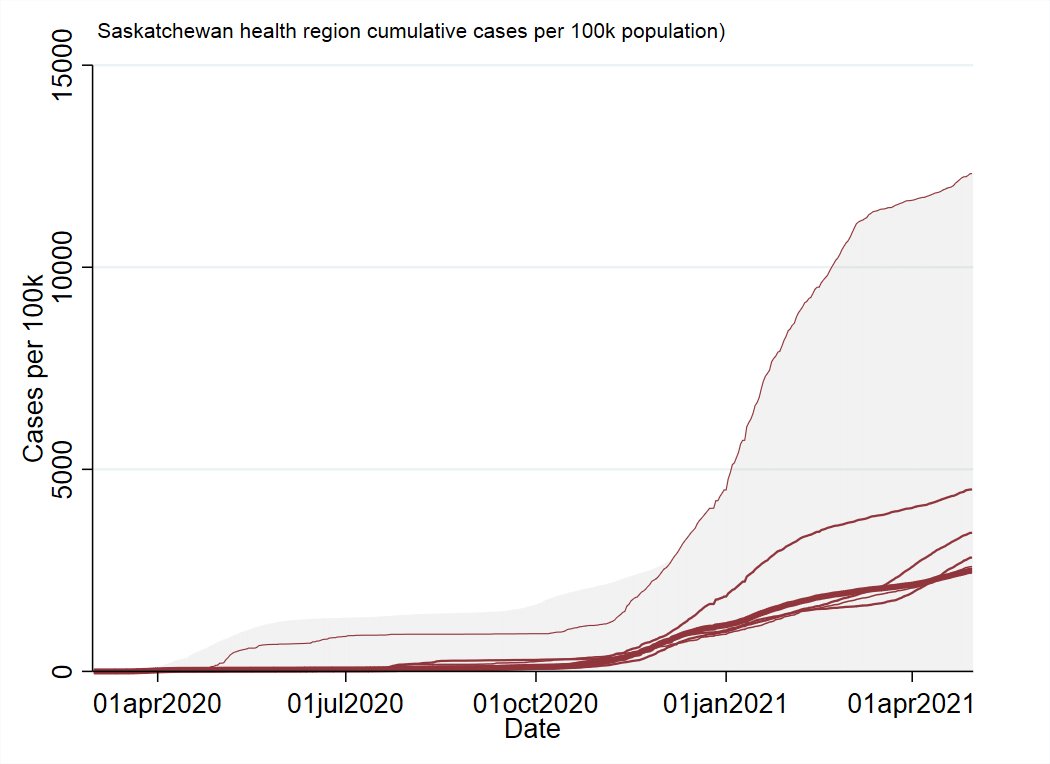
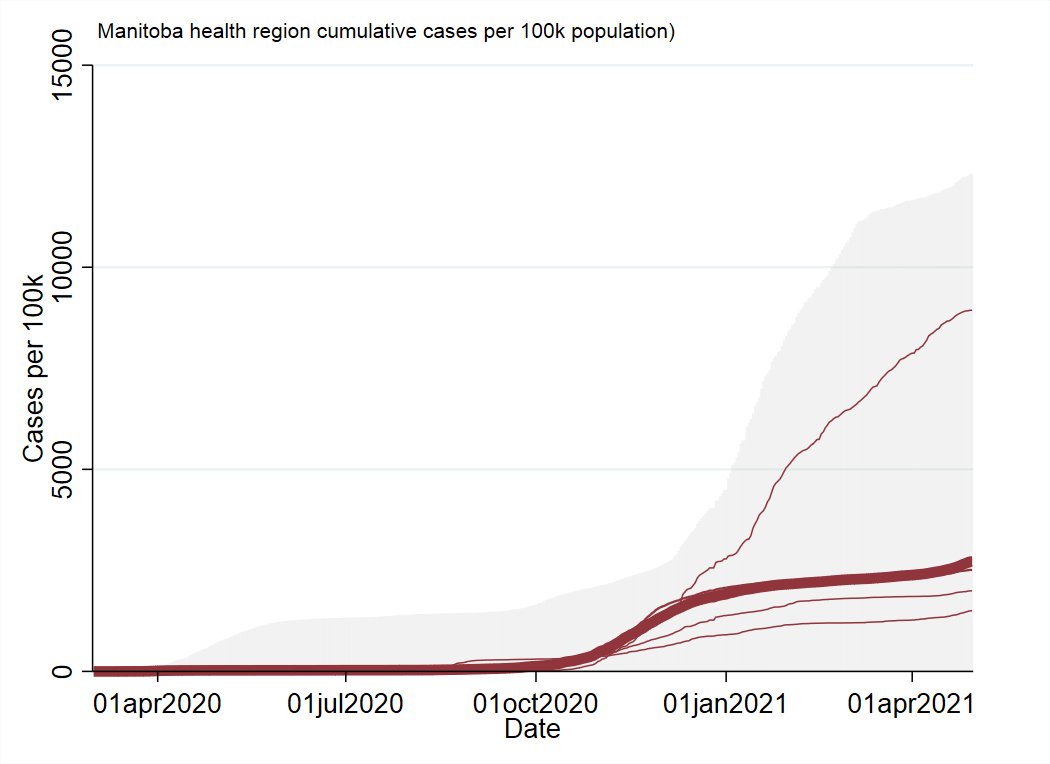
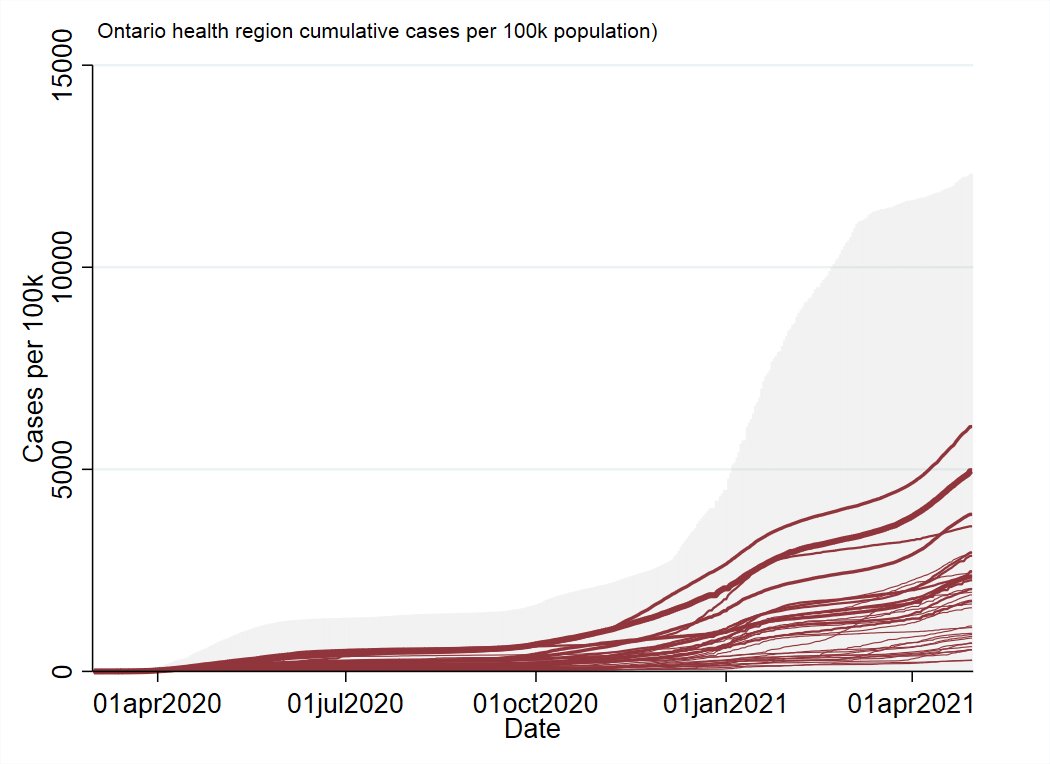
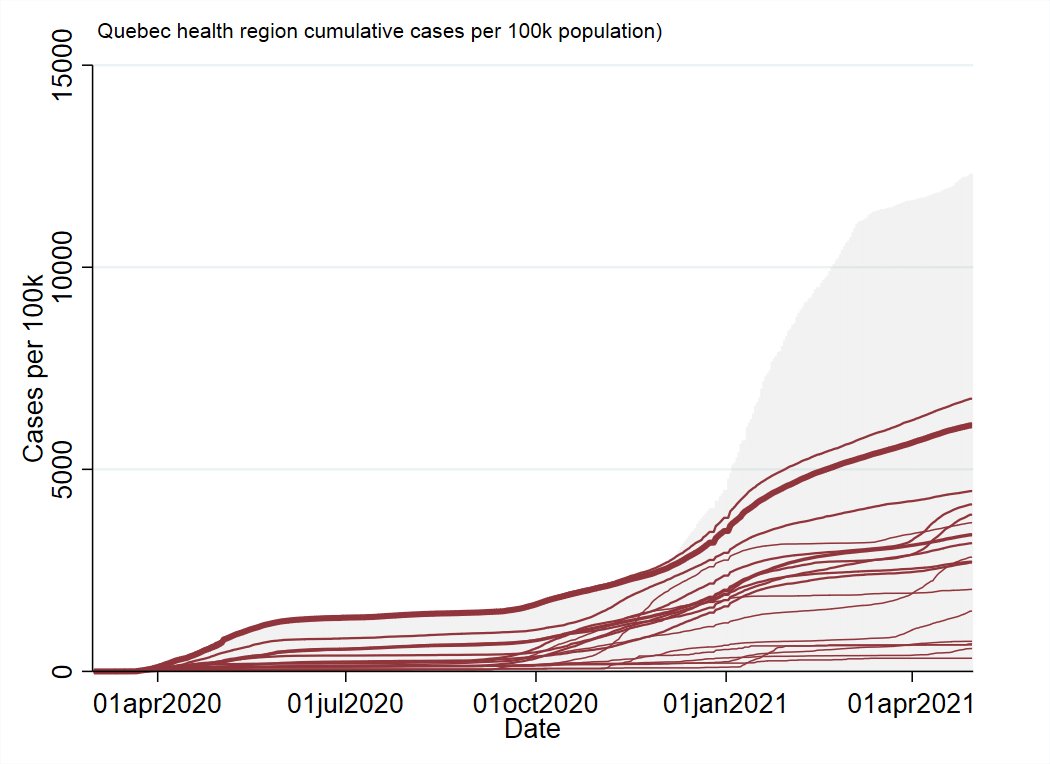
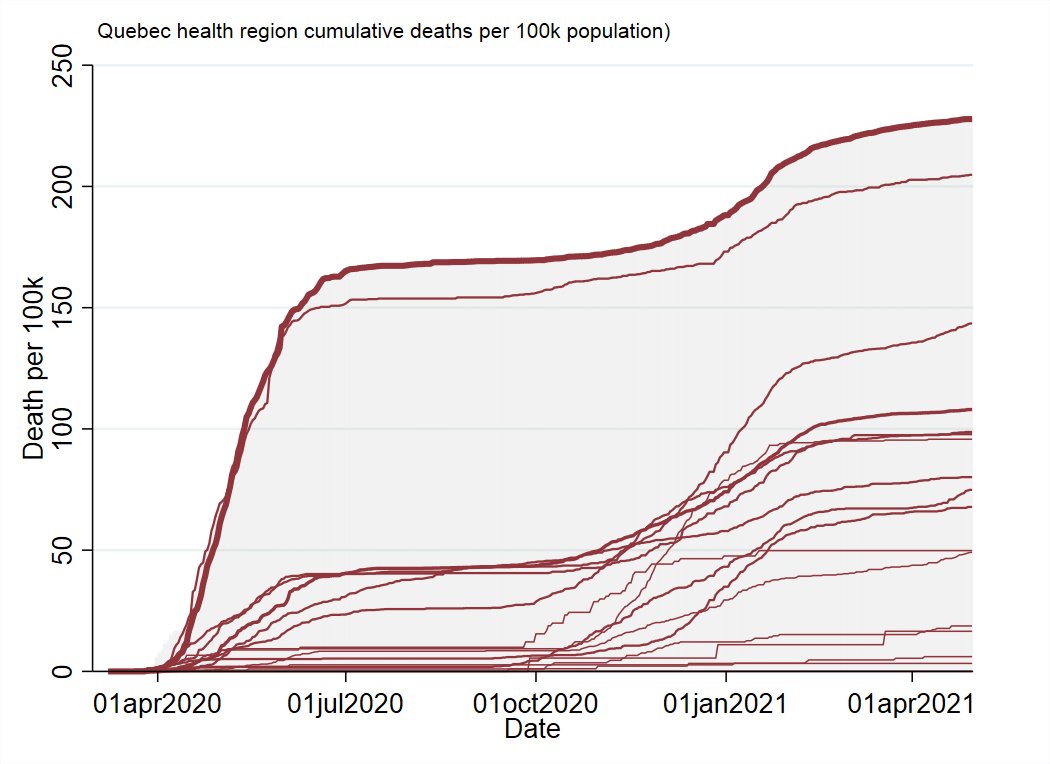
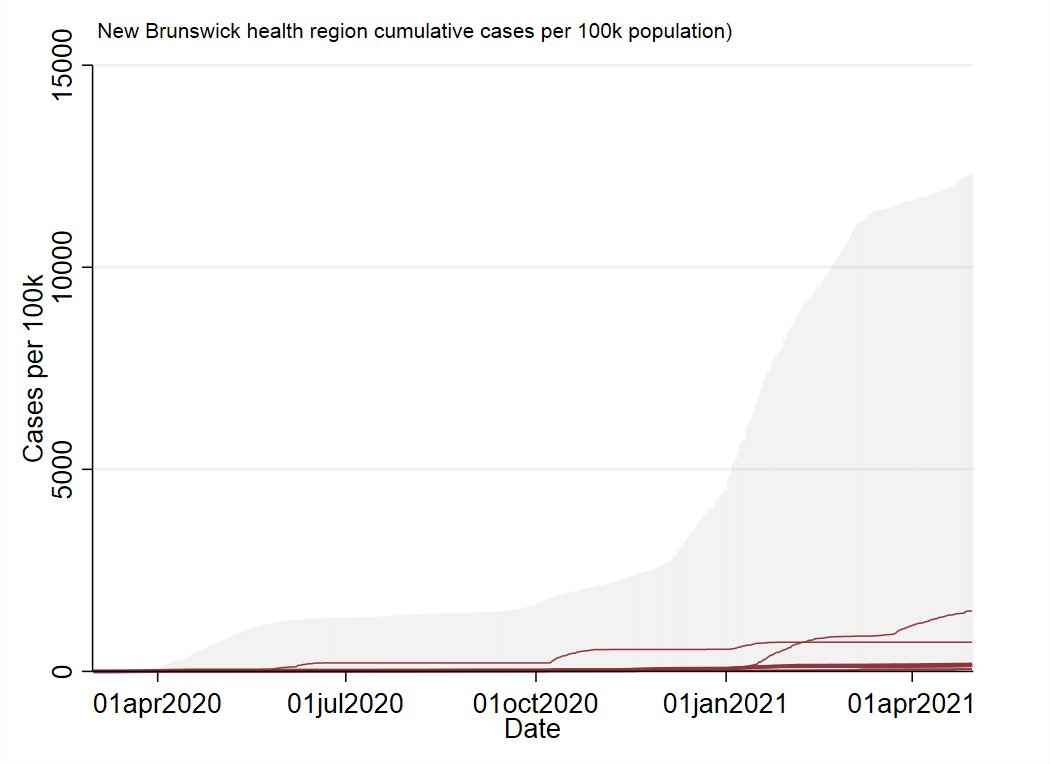
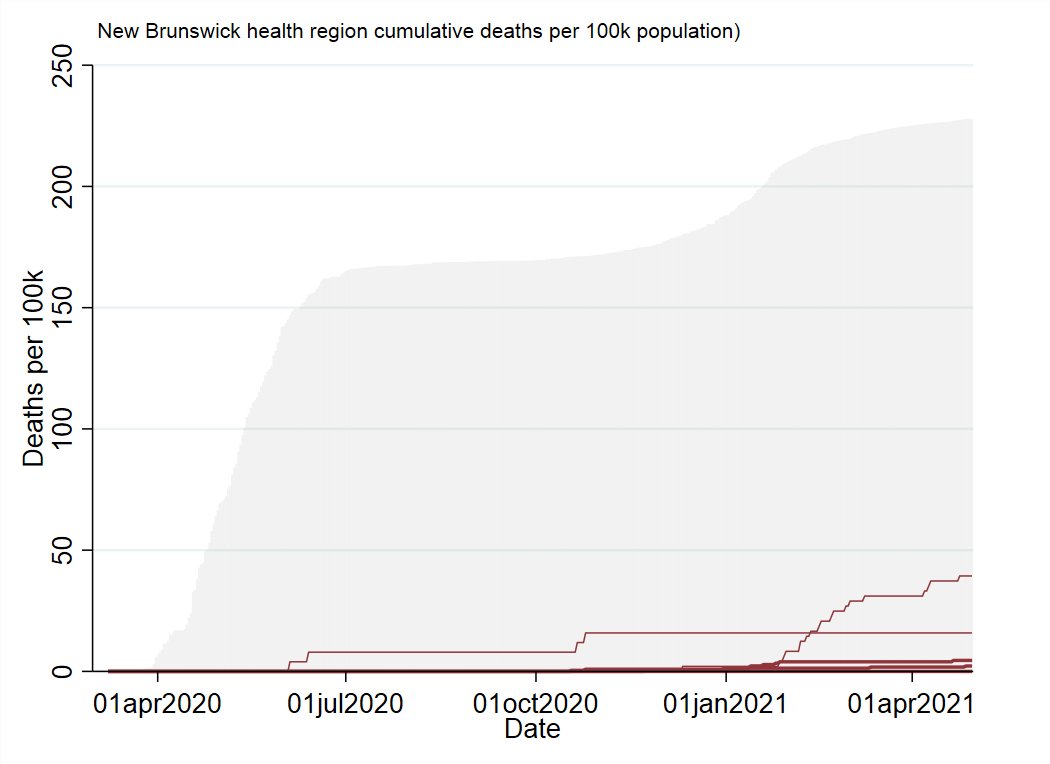
For the cumulative graphs, I've tinkered with the size of the lines so that health regions that make up a larger share of their province's population will be larger/more prominent, although not quite to scale.
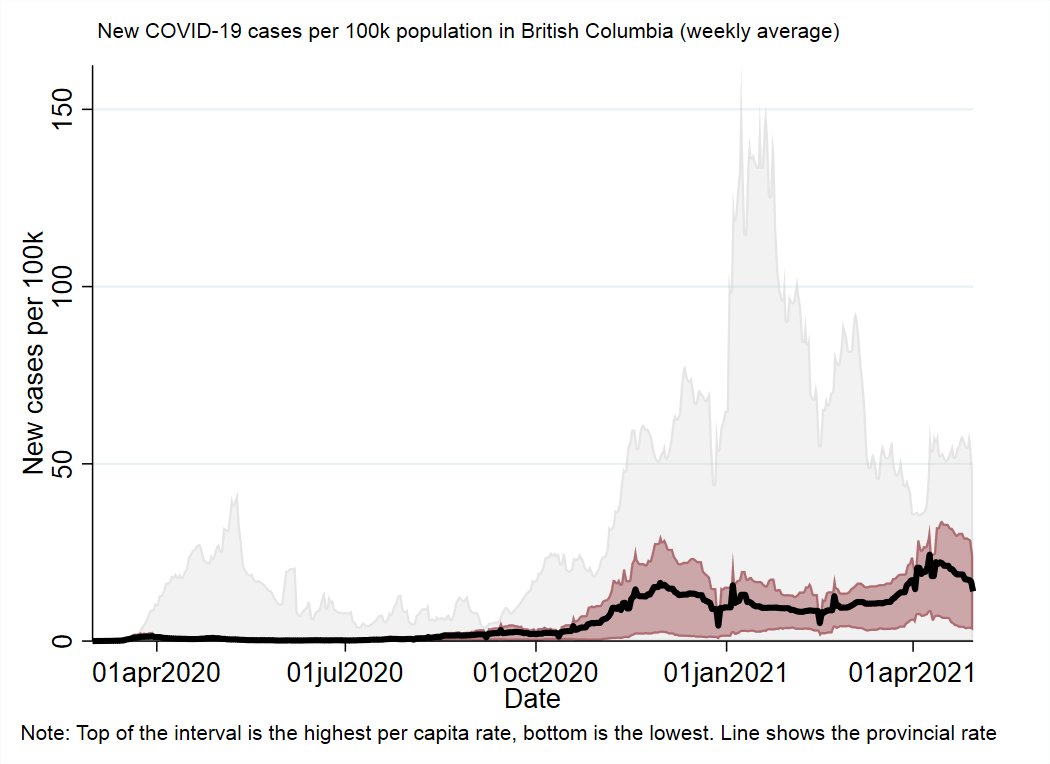
BC
The 3rd wave in BC looked a lot like the Fall wave.
The Fraser Valley region was hardest hit in terms of case numbers.
It's too soon to say, but it looks like this most recent wave of cases will end up being at least somewhat less lethal than the previous one.
The 3rd wave in BC looked a lot like the Fall wave.
The Fraser Valley region was hardest hit in terms of case numbers.
It's too soon to say, but it looks like this most recent wave of cases will end up being at least somewhat less lethal than the previous one.

Alberta
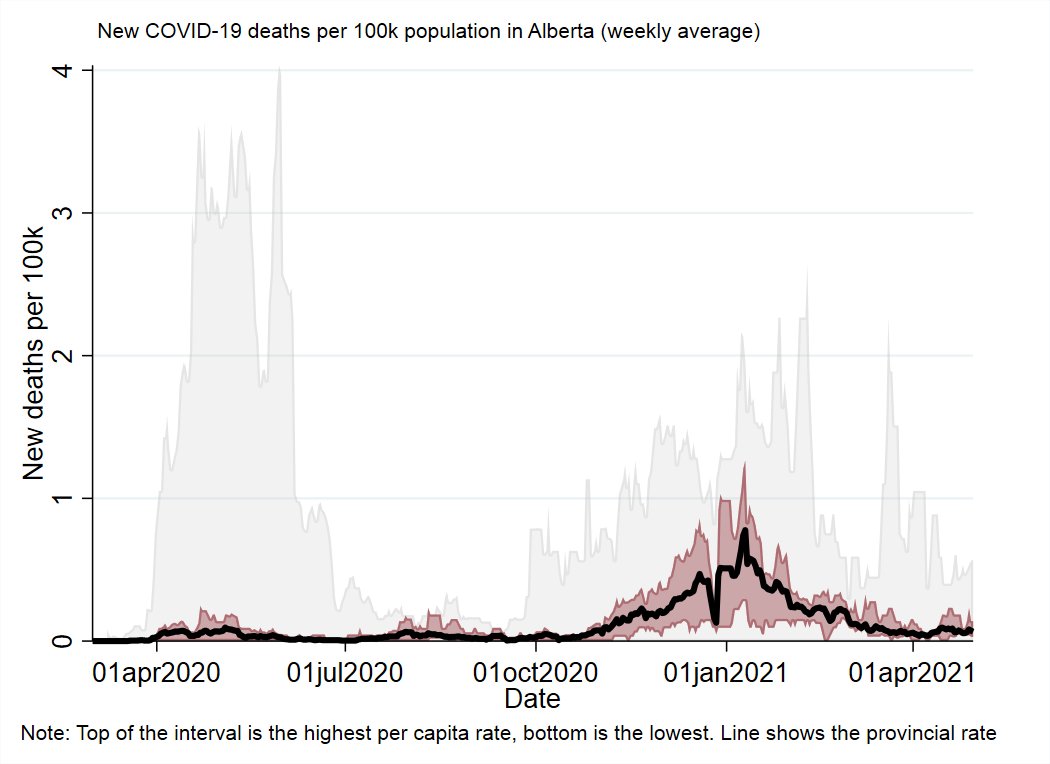
One of the provinces where the 3rd wave has not slowed.
As with the previous wave, basically all of AB's health regions, rural and urban, move up and down together.
One of the provinces where the 3rd wave has not slowed.
As with the previous wave, basically all of AB's health regions, rural and urban, move up and down together.

Saskatchewan
Overall provincial case numbers are comparable to the Fall/Winter wave, only shifted more towards the urban health regions, and away from the more rural areas of the province.
Overall provincial case numbers are comparable to the Fall/Winter wave, only shifted more towards the urban health regions, and away from the more rural areas of the province.

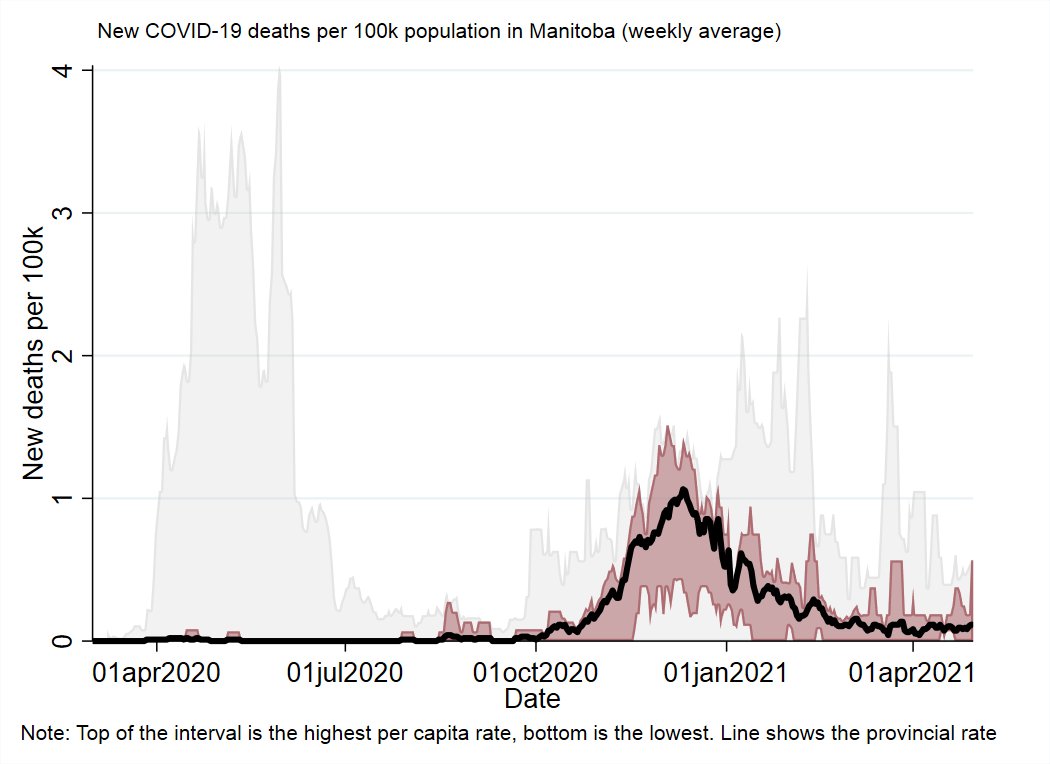
Manitoba
The other province still searching for the peak of it's 3rd wave.
Seems to have an ongoing, massive rural outbreak in it's northern health regions.
The other province still searching for the peak of it's 3rd wave.
Seems to have an ongoing, massive rural outbreak in it's northern health regions.


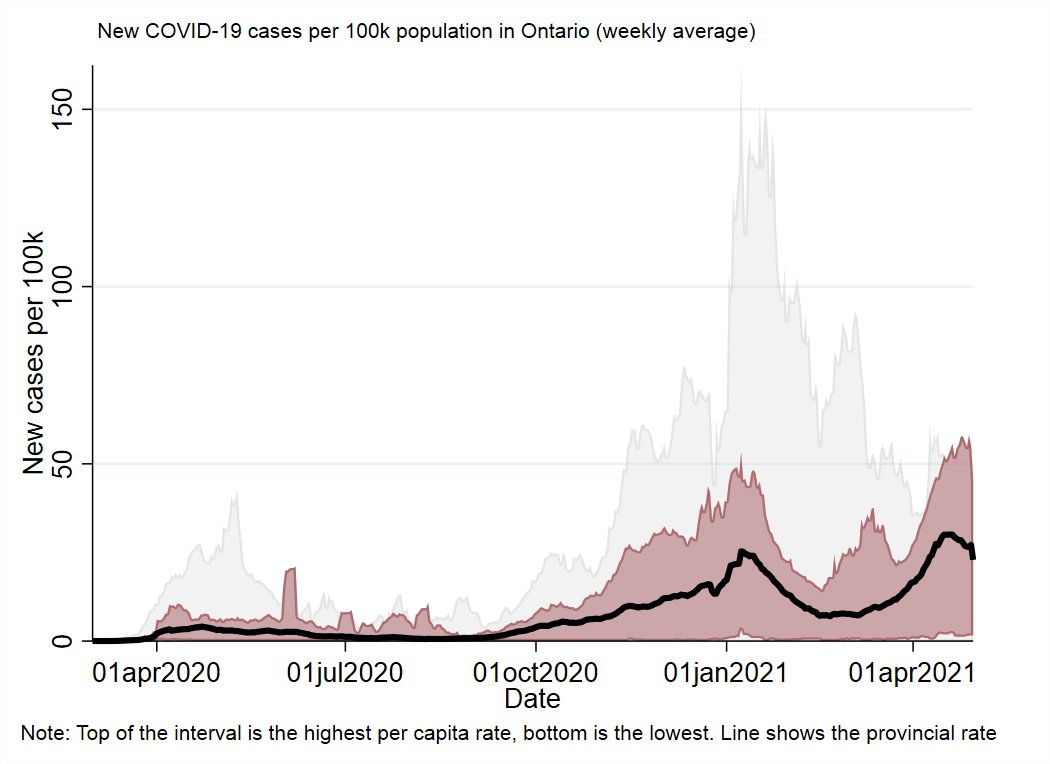
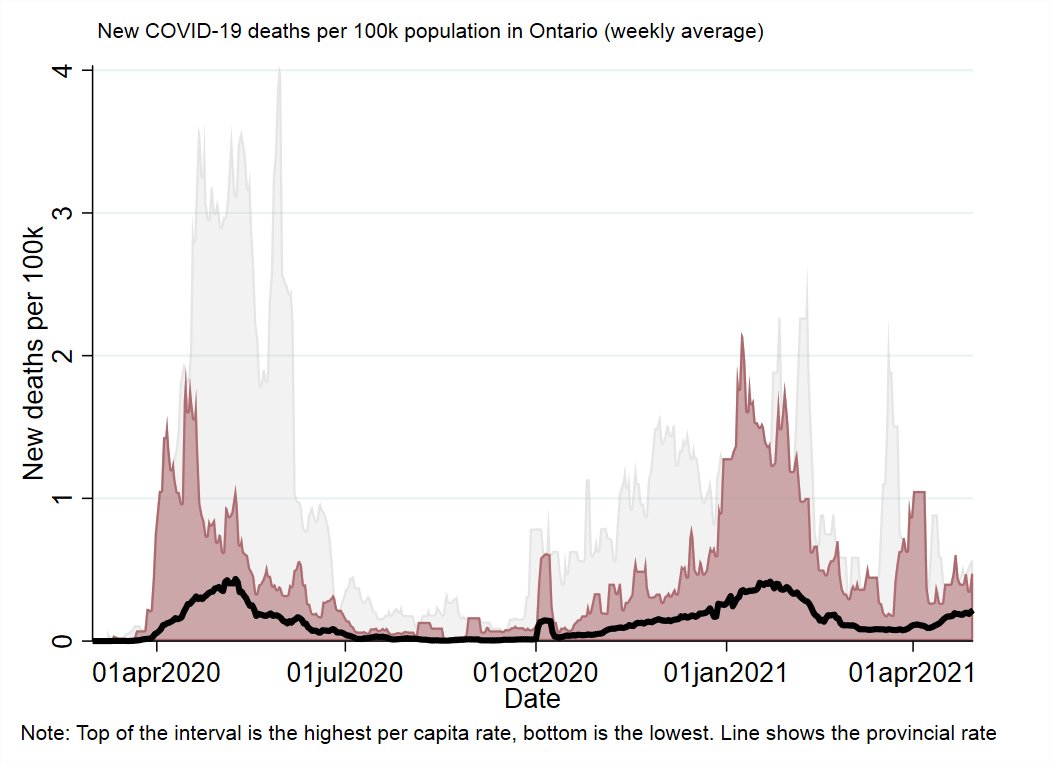
Ontario
Hardest hit during the current wave. Case numbers at the provincial level have started to come down, but remain high in the worst-off parts of the province.
Noticeable uptick in deaths from the 3rd wave, though not on the same scale as the 2nd.
Hardest hit during the current wave. Case numbers at the provincial level have started to come down, but remain high in the worst-off parts of the province.
Noticeable uptick in deaths from the 3rd wave, though not on the same scale as the 2nd.

Quebec
The most recent wave of cases was a bit shallower than the previous one and seems to have been more active in the less populated health regions of the province.
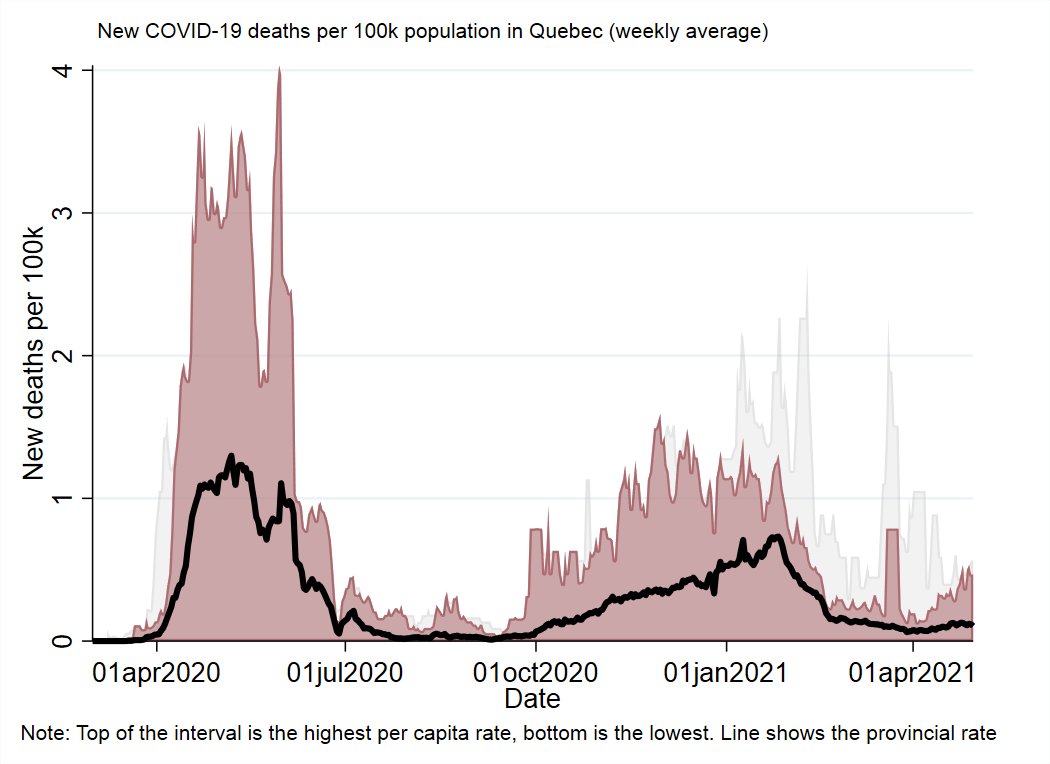
Similar increase in deaths as Ontario, albeit smaller and more rural-centered.
The most recent wave of cases was a bit shallower than the previous one and seems to have been more active in the less populated health regions of the province.
Similar increase in deaths as Ontario, albeit smaller and more rural-centered.
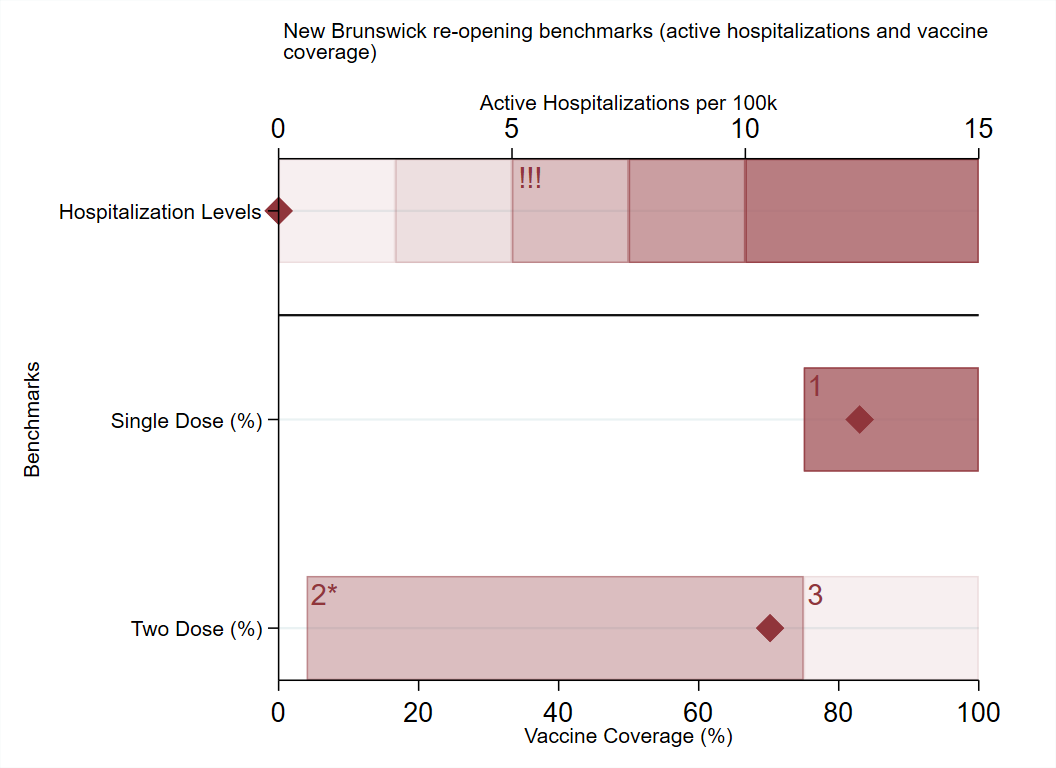
New Brunswick
Made significant progress in winding down the outbreak in the Edmundston region (some restrictions have been lifted).
Current outbreak in Fredericton, but it's so small it's not visible on the graphs. Seems well contained.
Made significant progress in winding down the outbreak in the Edmundston region (some restrictions have been lifted).
Current outbreak in Fredericton, but it's so small it's not visible on the graphs. Seems well contained.

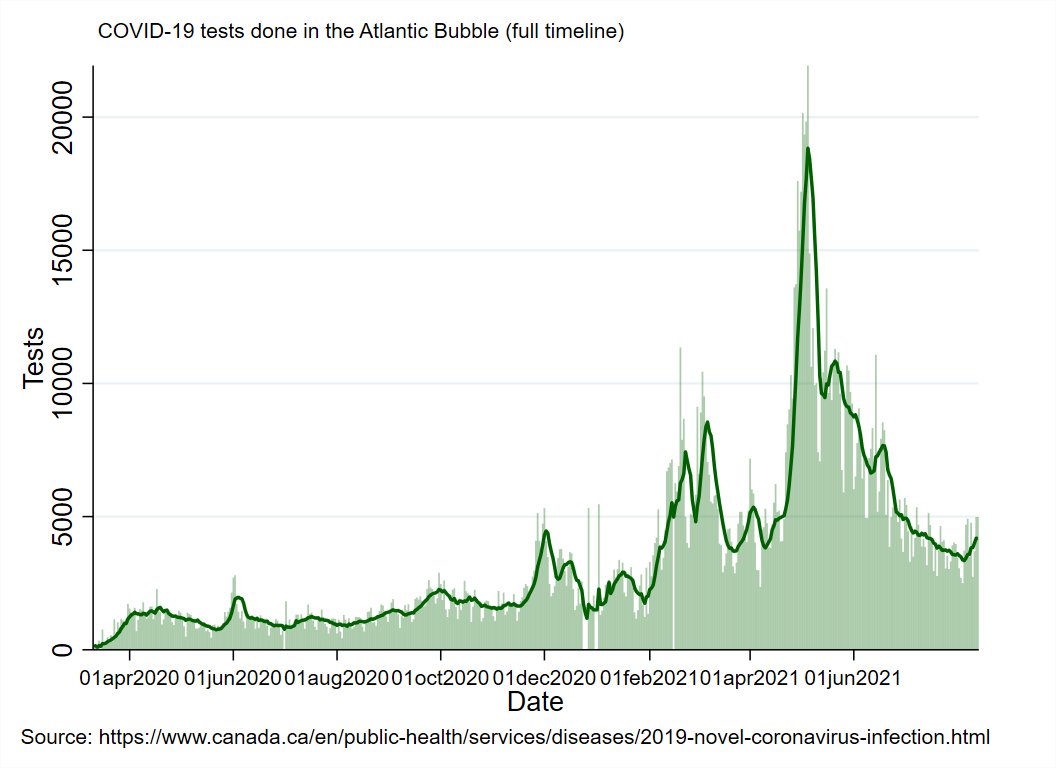
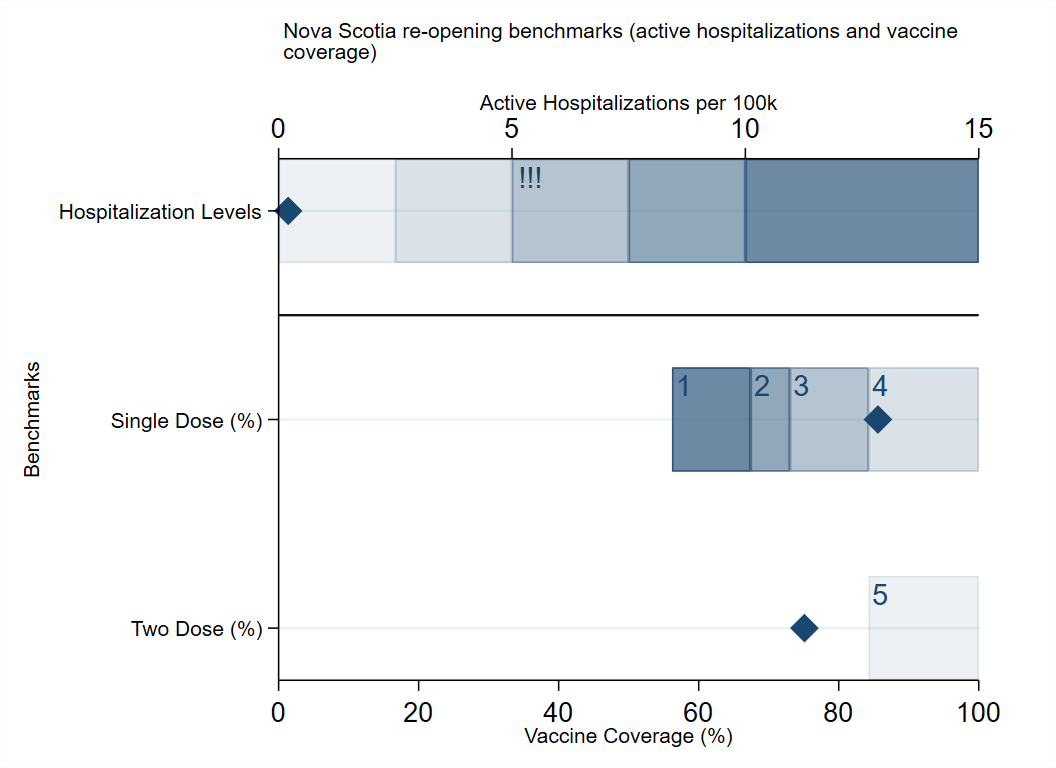
Nova Scotia
Currently facing it's largest-ever outbreak, centered on the Halifax area (about 1-2 weeks into it).
Has effectively closed borders to the non-Atlantic provinces at this point (quarantine not sufficient due to compliance issues, high rates among travelers)
Currently facing it's largest-ever outbreak, centered on the Halifax area (about 1-2 weeks into it).
Has effectively closed borders to the non-Atlantic provinces at this point (quarantine not sufficient due to compliance issues, high rates among travelers)

PEI
Had it's first hospitalization of the pandemic this month.
PEI has also closed borders with the non-Atlantic provinces this month, with similar logic to NS (actually did so first).
Otherwise, a relatively quiet month.
Had it's first hospitalization of the pandemic this month.
PEI has also closed borders with the non-Atlantic provinces this month, with similar logic to NS (actually did so first).
Otherwise, a relatively quiet month.


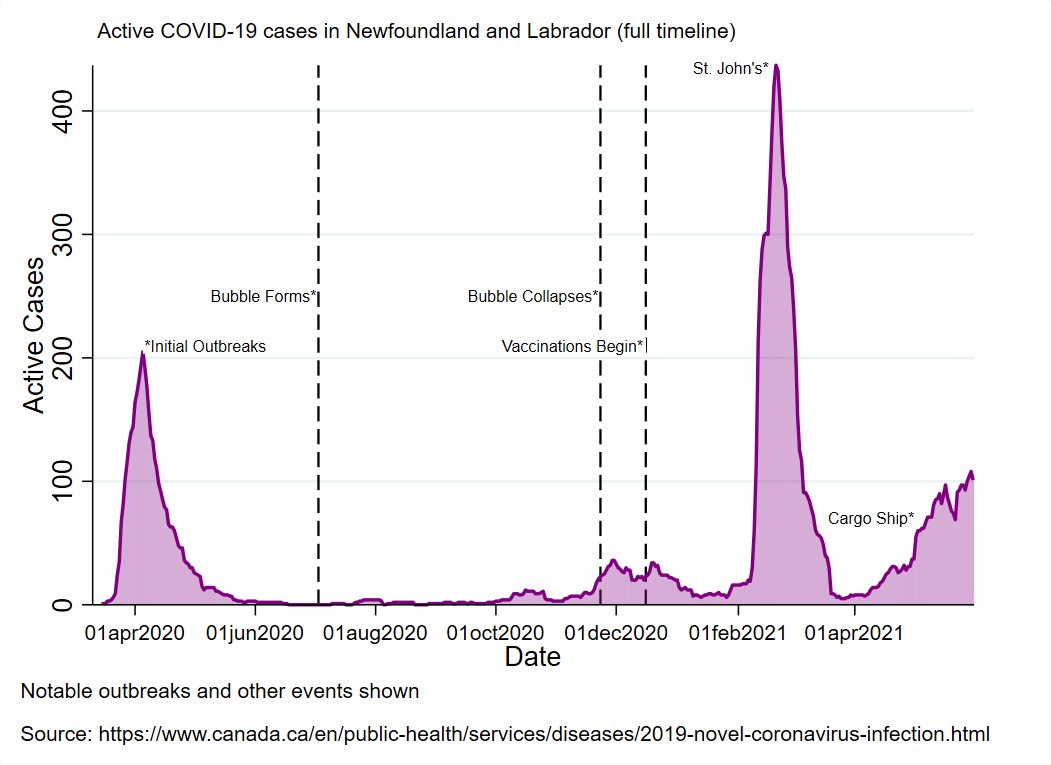
Newfoundland and Labrador
Had a brief scare from untraced cases in the Western health region, but otherwise had an uneventful month.
Had a brief scare from untraced cases in the Western health region, but otherwise had an uneventful month.


The Territories
Mostly a quiet month.
Nunavut is currently experiencing a small-scale outbreak, but the vaccination rate there is extremely high, so hopefully there will be a low risk of serious outcomes.
Mostly a quiet month.
Nunavut is currently experiencing a small-scale outbreak, but the vaccination rate there is extremely high, so hopefully there will be a low risk of serious outcomes.
Part 2: Population, density, borders, and pandemic outcomes
https://twitter.com/WilsonKM2/status/1378407146765836291
Last time I did this thread I looked at whether population size at the health region level explained Atlantic Canada's relative success in the pandemic.
TLDR: population matters but they do much better than you would expect given their population size/structure.
TLDR: population matters but they do much better than you would expect given their population size/structure.
Some of the responses I got suspected other factors were at play, namely:
1) Low initial seeding in the first wave made Atlantic region look artificially successful.
2) It's population density that matters, not size.
3) It's airports, borders with US that matters.
1) Low initial seeding in the first wave made Atlantic region look artificially successful.
2) It's population density that matters, not size.
3) It's airports, borders with US that matters.
To address all this, I've added the following features to the analysis:
1) Re-run limited to 01SEP2020 and forward. Most of the country had reset to ~0 by then. Testing was in place, everyone knew how this stuff worked.
2) Included data on density, airports and border crossings
1) Re-run limited to 01SEP2020 and forward. Most of the country had reset to ~0 by then. Testing was in place, everyone knew how this stuff worked.
2) Included data on density, airports and border crossings
The outcomes I look at (at the health region level) are:
Cumulative cases per capita
Cumulative deaths per capita
Cumulative days COVID-free
Cumulative days in active outbreak
Cumulative cases per capita
Cumulative deaths per capita
Cumulative days COVID-free
Cumulative days in active outbreak
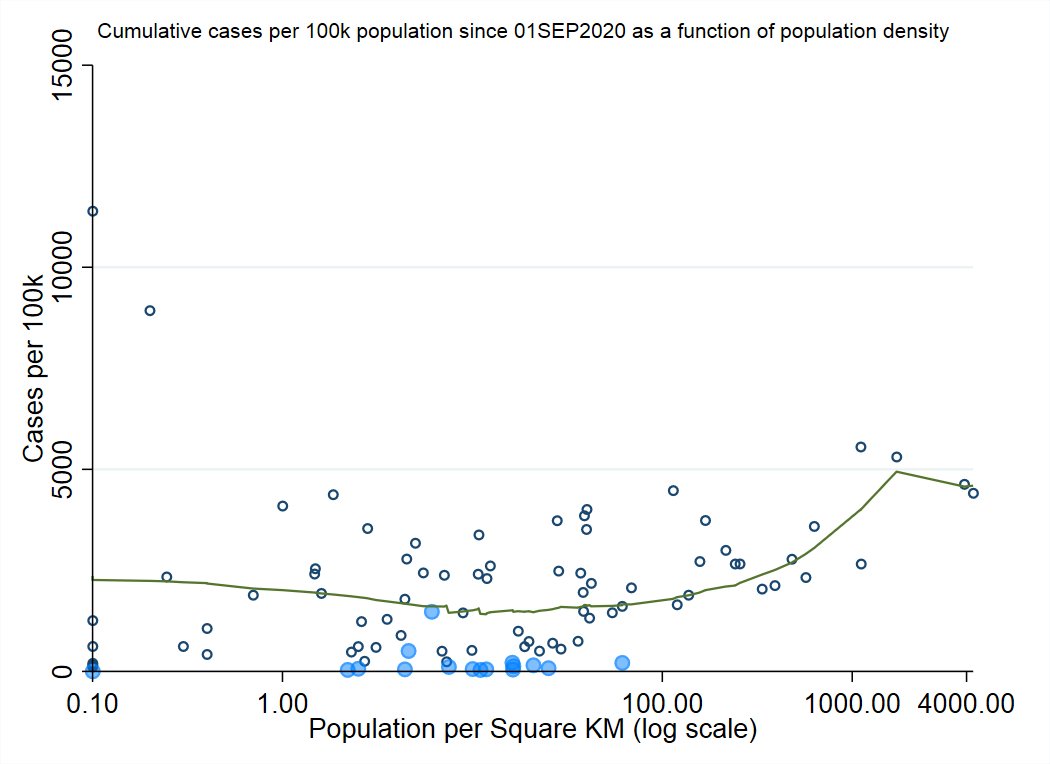
For all of the graphs, Atlantic health regions are highlighted in blue.
Looking at cumulative case numbers, population density plays a roll, just like total population size does, especially at the higher end.
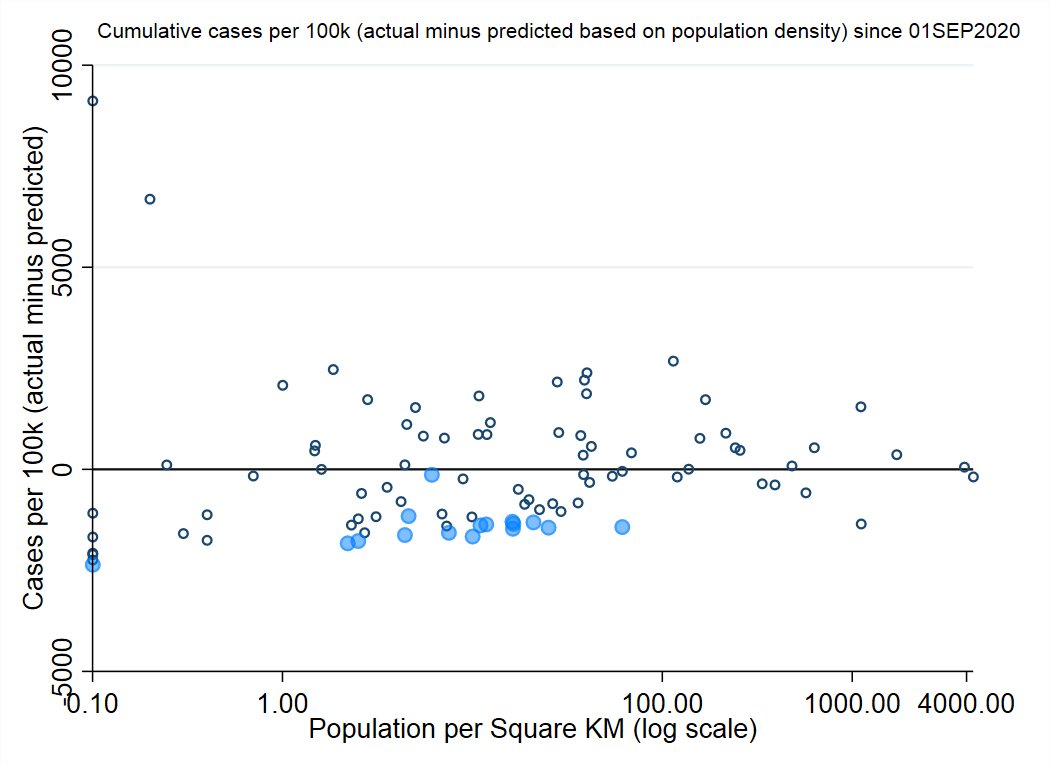
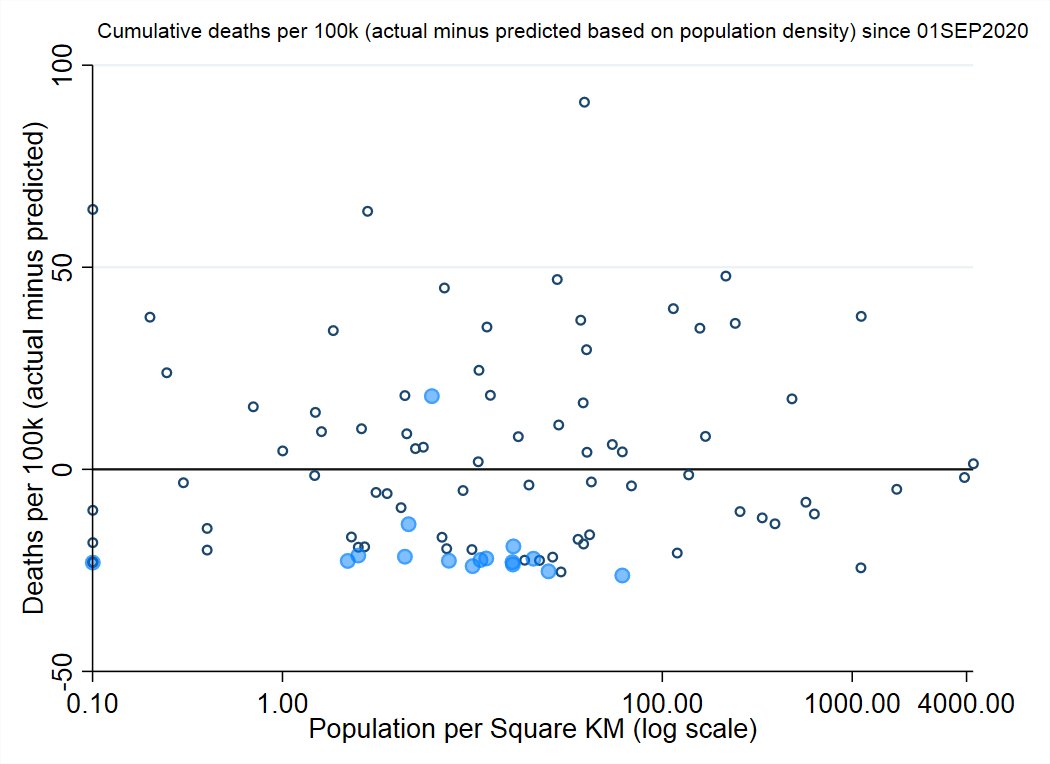
Despite this, Atlantic health regions reliably beat expectations based on population density (2nd graph)
Despite this, Atlantic health regions reliably beat expectations based on population density (2nd graph)
Deaths are a bit more variable between health regions, but the same pattern emerges: population density matters, but all by 1 Atlantic health regions (Edmundston) essentially defines the floor for their population density level.
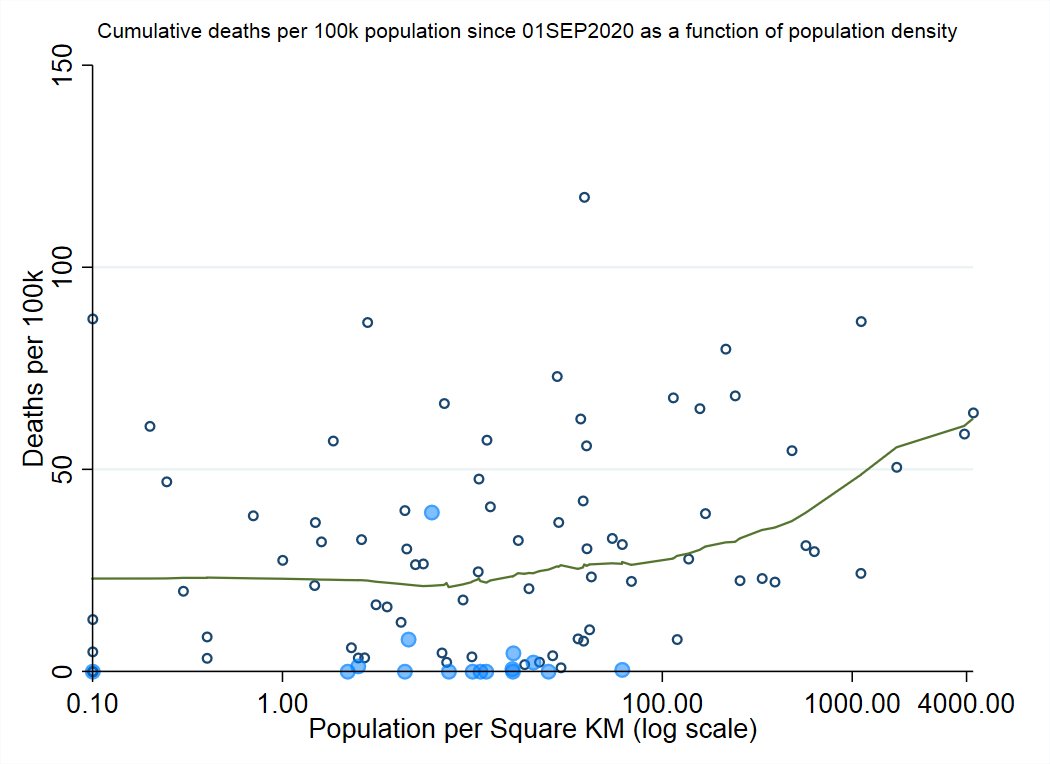
The difference is probably most stark when looking at number of days COVID-free.
That health regions in the Atlantic provinces have virtually no peers at their level of density for this metric.
That health regions in the Atlantic provinces have virtually no peers at their level of density for this metric.


Here's what it looks like scaled to percent of days (since 01SEP2020), and with separate trend-lines for the two groups.
Population density matters for both, but the scale is completely different.
Population density matters for both, but the scale is completely different.

A similar, if somewhat less pronounced trend can be seen when looking at number of days in active outbreak (defined as >5 cases per 100k population running average.


And as with the first summary, you can get a better overall all sense by putting to outcomes together in a matrix.
Here, the further from the center a health region is, the more it defies expectations based on population density: top left, more time COVID-free, fewer, deaths.
Here, the further from the center a health region is, the more it defies expectations based on population density: top left, more time COVID-free, fewer, deaths.

The same matrix is useful for summarizing whether airports or land-based points of entry.
First image shows airports rated for passengers/crew greater than 100 (blue for Atlantic, red for non-Atlantic)
2nd graph is the same but for NEXUS border points.
First image shows airports rated for passengers/crew greater than 100 (blue for Atlantic, red for non-Atlantic)
2nd graph is the same but for NEXUS border points.


Neither airports nor border points are obviously associated with over/under-performance due to population density.
Airports tend to be in larger, more densely populated health regions for a province, but then you're just modeling density with extra steps.
Airports tend to be in larger, more densely populated health regions for a province, but then you're just modeling density with extra steps.
Results are the same as the first round: things like population size and density matter, but deviation from that trend, even by a really wide degree, is very achievable.
There is a larger gap in outcomes between Halifax and Toronto than between Toronto and northern Saskatechewan
There is a larger gap in outcomes between Halifax and Toronto than between Toronto and northern Saskatechewan
That's it for this monthly update.
• • •
Missing some Tweet in this thread? You can try to
force a refresh