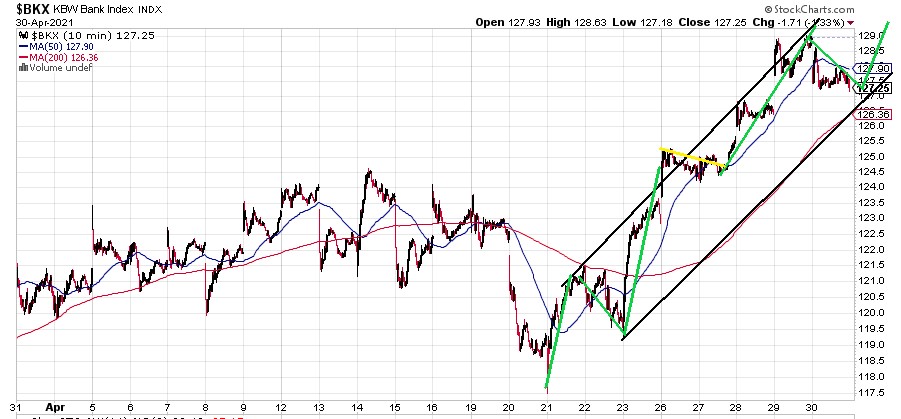
1/ Chart study from the Dragon's Den. Bank index first. $BKX
2/ Weekly. Major RSI spikes catch significant highs and lows leading to pauses or more likely, reversal. Large ABC pattern looks complete. B wave classic flat. 

3/ $BKX ABC-X-ABC zigzag since Oct is pretty clean. B waves channel perfectly for textbook structure. Not much more to go. 

4/ $BKX short term. Final leg since Apr 21 also looks like an ABC-X-ABC with B in perfect channel. Missing on more up move and that's it. 

5/ Commodities red hot lately. But we al know parabolas don't last forever. Perfect channel tag which lines up exact with 2009 low. Brief inflationary spike here to be follow by deflationary collapse. Kondratieff winter around the corner. 

6/ Sorry $GOLD bugs. Kondratieff winter is a deflationary collapse across the board and this has probably already topped. No safe haven. Wedge in process for next down leg to come. 

7/ Eventually $GOLD will in fact shine, but not for a while. Major ABC corrective and we have only just begun the C. 

9/ On a weekly basis, MACD hasn't been this high since 2000 and the current one is giving us a warning that momentum is dying. 

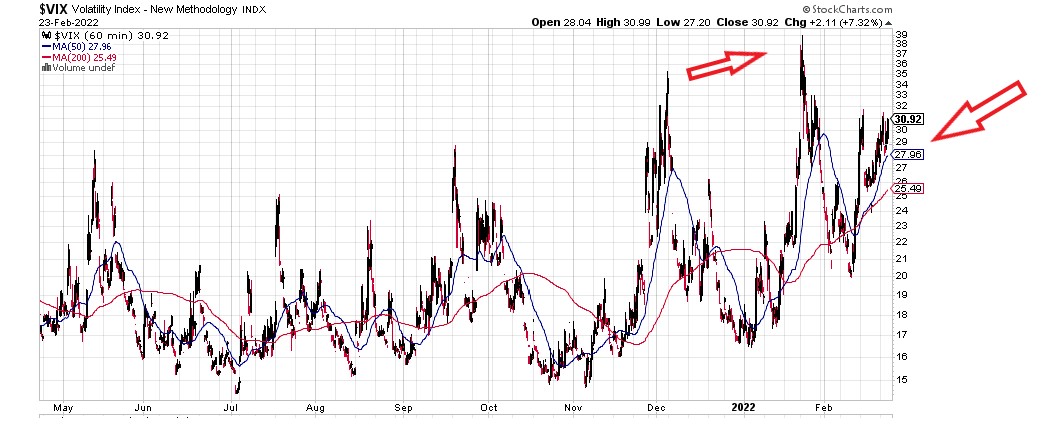
10/ $VIX Bottomed a few years ago and has been showing higher lows since. If next is at hand, it correlates to one more VIX crush to the trendline and thus, one more surge or 5th higher for indices. 

11/ In the big picture, the Value Line Index really gives a clear picture of what has been going on for last 20 years. Giant corrective flat with B almost done. C down will wipe out a lot. See the red 'c' down in the first A? The coming C down is 1 degree higher form. 

12/ I have said it before. People should be running from this one. The ARKK is going to sink major. This is classic bear triangle and I have proprietary data analysis that is 100% in agreement. Needs just a little more slosh to finish before it dumps. 

13/ Target for $ARKK is about $85-90, the center point of the prior rally consolidation. Note volume spike on reversal and now dramatic falling volume on the triangle. All textbook correlation. Cathy got cocky and is now going to get smacked for it. 

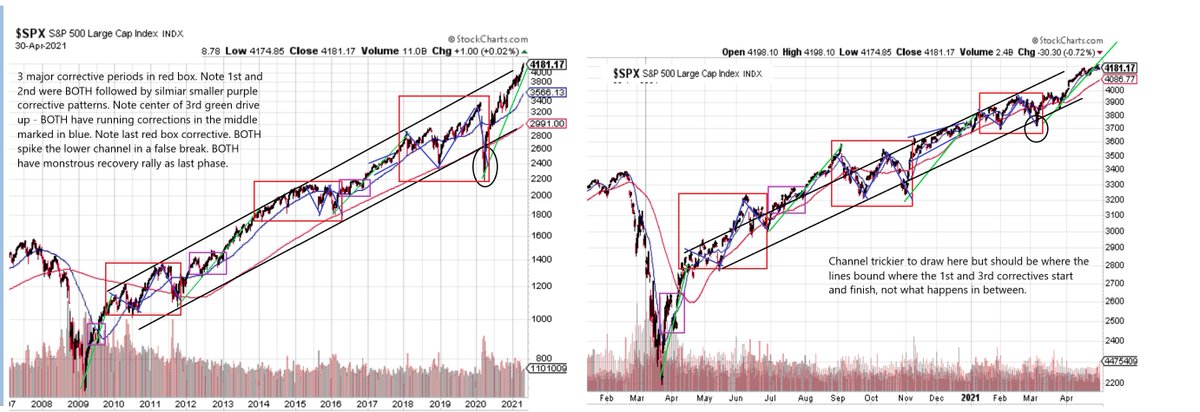
14/ How do we know we are in the end game in the BIG picture? We are nesting. This is almost spooky to look at. The market from 1929 to now looks EXACTLY like 2009 to now. 

15/ If nesting holds, let's look at market from 2009 to now and from Mar 2021 to now. Keep in mind, the smaller the time frame, the more "noise" is introduced so we're looking for similar structural elements. Result? WHOA!! 

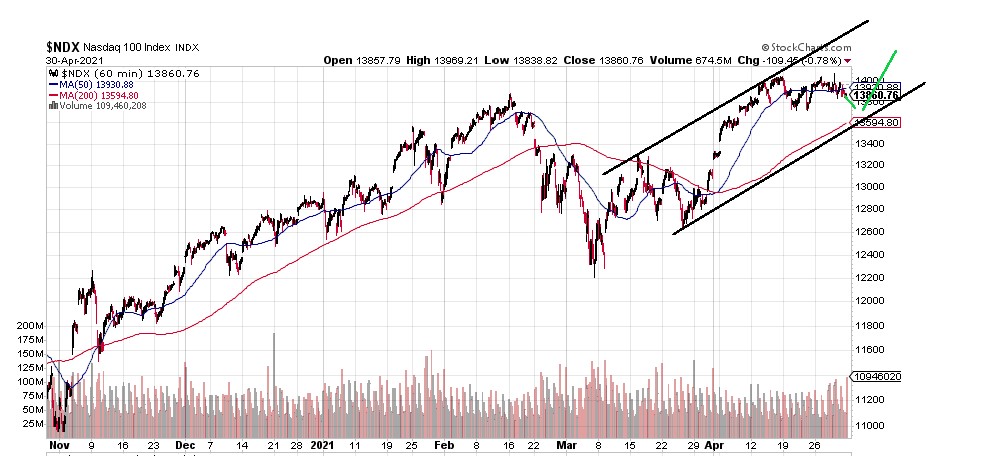
16/ So, assuming nesting continues, early Mar to now should ALSO be the same pattern. Remember, smaller time frame, more NOISE, so it starts to look hazy. I *think* we are in the midst of the last red box phase which means we have a fast steep drop ahead, and then final surge 

17/ Interestingly, this all correlates highly to many individual stocks looking like they are in 4th wave and still need a 5th.
18/ The final surge to come should also look like the larger nested patterns but even more noise so it will look sloppy. As time frame drops, the middle red box becomes less prominent. It was almost gone in the last time frame just shown and looks more like 5 waves, not ABC-X-ABC
19/ Within the ABC-X-ABC the "C-X-A" part is all really a 3rd wave anyway, just split with a pause in the middle and this pause seems to be disappearing in smaller time frames. Safe to say we are out of time for any smaller nests after the next one
20/ If we are where I think we are, we should see a fast 5 wave decline that punctures the lower black channel, but recovers to new highs, ~4250-4300, over the next 1-2 weeks to finish it all. 

21/ If the decline is smaller, doesn't reach the lower channel, and slower overall and looking like it ill unfold in 3 waves, then we are more likely in the middle red box region of the nested structure and have an extra few weeks to go.
22/ China looking rather interesting too here. Also in a 4th of a wedge with final 5th before drop to an even larger triangle boundary. Question is, does the boundary hold or is wedge the C wave of a corrective between 2016 and now? 

23/ That's all for the chart study for now
• • •
Missing some Tweet in this thread? You can try to
force a refresh


