In our course, we spend a couple of lectures talking about how tell whether scientific research is legit.
callingbullshit.org/tools/tools_le…
callingbullshit.org/tools/tools_le…
Appearing in a journal from a reputable scientific publisher is a good start. But it's no guarantee.
@lastpositivist pointed us a paper from a journal produced by the largest scientific publisher, Elsevier.
sciencedirect.com/science/articl…
@lastpositivist pointed us a paper from a journal produced by the largest scientific publisher, Elsevier.
sciencedirect.com/science/articl…
The study looks for the genetic basis of psychic ability.
Yes, you read that right.
To do that, I suppose you have to start with psychics. And they did.
"Candidate cases were vetted for their psychic claims."
Yes, you read that right.
To do that, I suppose you have to start with psychics. And they did.
"Candidate cases were vetted for their psychic claims."
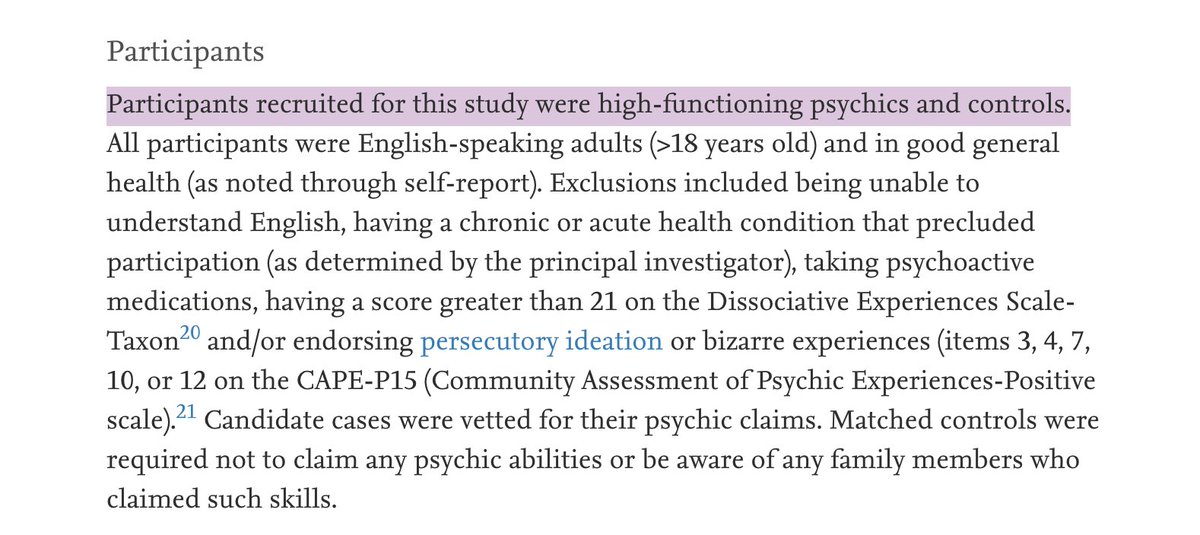
Vetted? How?
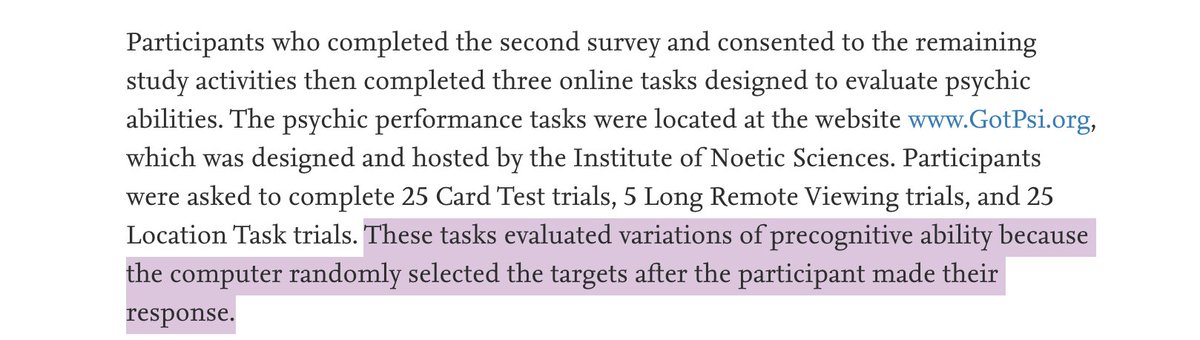
By self-report, followed by a couple of "tests"
(Interesting twist: the main test involved "precognitive ability" to guess a random number that a computer hadn't selected yet.)
By self-report, followed by a couple of "tests"
(Interesting twist: the main test involved "precognitive ability" to guess a random number that a computer hadn't selected yet.)


Of course any good study needs a control group, and so they created one. Fair enough.
Interesting that all "vetted psychics" were Caucasian women over 37.
We are not told the demographics of the full 3000+ who filled out the original survey. Any guesses?
Interesting that all "vetted psychics" were Caucasian women over 37.
We are not told the demographics of the full 3000+ who filled out the original survey. Any guesses?

The control group then completed the same tests of psychic ability.
Here's the thing.
They did just as well as the group of "vetted psychics" did!
Here's the thing.
They did just as well as the group of "vetted psychics" did!
But wait! The text says they did better on the the Remote Viewing test. Maybe that's the one that really matters, and the other tests aren't good tests.

Nope. Read the fine print under the table.
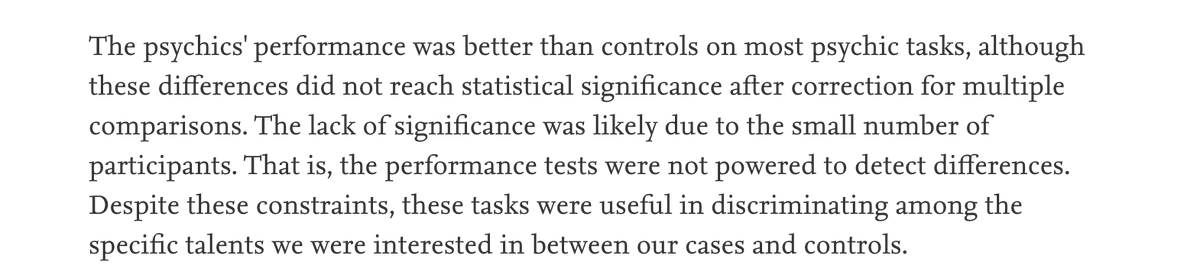
The authors *claim* the difference reached statistical significance in the text, but in the fine print note that it didn't actually reach significance once you account for multiple comparisons.
The authors *claim* the difference reached statistical significance in the text, but in the fine print note that it didn't actually reach significance once you account for multiple comparisons.

If you ever see these sort of thing in a paper—either their claims that that "most Xs are bigger than Ys, even though it's not significant", or worse yet a claim in the text that a difference is significant coupled fine print in a table saying that it is not—be very wary!
Let's take stock where we are: We've got a group of "vetted psychics" and a control group of random non-psychics, who have scored the same on the researchers' own test of psychic ability.
And where we're going: We want to find genetic differences associated with the differences in psychic ability THAT WE DIDN'T FIND BETWEEN OUR CASE AND CONTROL GROUPS.
How would you proceed at this point? I sure wouldn't waste the genetic tests. But the authors are bolder than I.
How would you proceed at this point? I sure wouldn't waste the genetic tests. But the authors are bolder than I.
They went ahead and collected some sort of unspecified DNA sequence data. Whole genome sequence I would guess? Remarkably, I don't think the paper ever tells us.
And what did they find?
No differences between vetted psychics and controls in protein coding regions.
And what did they find?
No differences between vetted psychics and controls in protein coding regions.
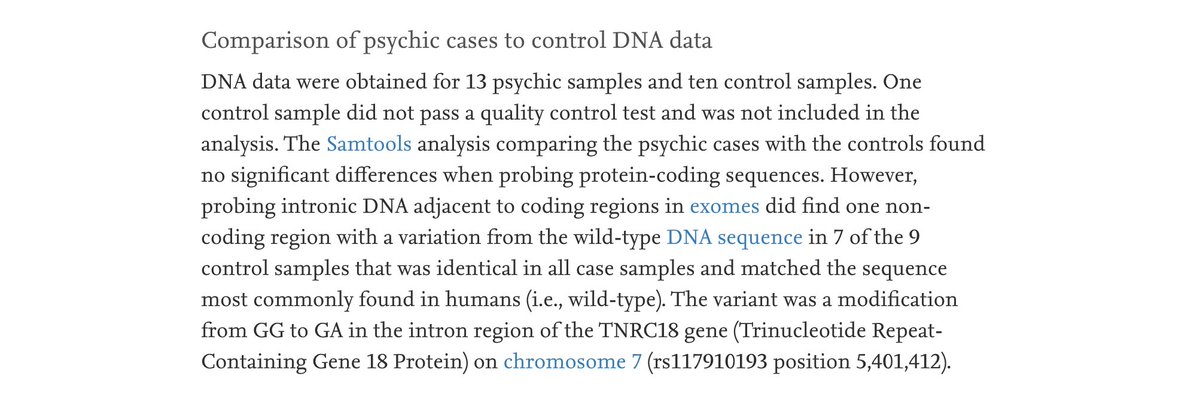
Nope, all they found was that all of the case samples but only two of the control samples had an A instead of a G in an intron, a part of the gene that is cut out before it is used to code for a protein. Such differences are generally expected to have no physiology effect.
Let's take stock again.
Now we've got a group of vetted psychics and a group controls who have
(1) no differences in psychic ability on the researchers' own choice of tests and
(2) no genetic differences.
Should be a pretty open and closed case, right?
Now we've got a group of vetted psychics and a group controls who have
(1) no differences in psychic ability on the researchers' own choice of tests and
(2) no genetic differences.
Should be a pretty open and closed case, right?
Well, not according to the Discussion section of the paper.
The authors argue that the reason they didn't see any statistical difference in ability was not because there was none, but rather "likely due to the small number of participants".
The authors argue that the reason they didn't see any statistical difference in ability was not because there was none, but rather "likely due to the small number of participants".
A couple of observations here.
First, if I look for difference in flying ability between penguins and ostriches and find none, there's more likely hypothesis than "the small number of participants".
First, if I look for difference in flying ability between penguins and ostriches and find none, there's more likely hypothesis than "the small number of participants".
Second, sample size is under the control of the investigators, let these investigators argue that "the performance tests were not powered to detect differences."
Why on earth would you run a study you knew was not powered to detect the differences you were looking for?
Why on earth would you run a study you knew was not powered to detect the differences you were looking for?
But we shouldn't make too much of those tests anyway, the authors tell us. The psychics reported that the "tasks did not adequately capture their particular set of skills."
That's what I told Mrs. McClellan after I failed seventh grade social studies.
She gave me an F anyway.
That's what I told Mrs. McClellan after I failed seventh grade social studies.
She gave me an F anyway.
Here I pause simply to note that the authors must travel in different circles than I do.

Besides, the authors note, there were some differences between cases (psychics) and controls.
Cases were more likely to believe in paranormal phenomena.
No kidding. You just screened them for *believing they were psychic.*
Cases were more likely to believe in paranormal phenomena.
No kidding. You just screened them for *believing they were psychic.*

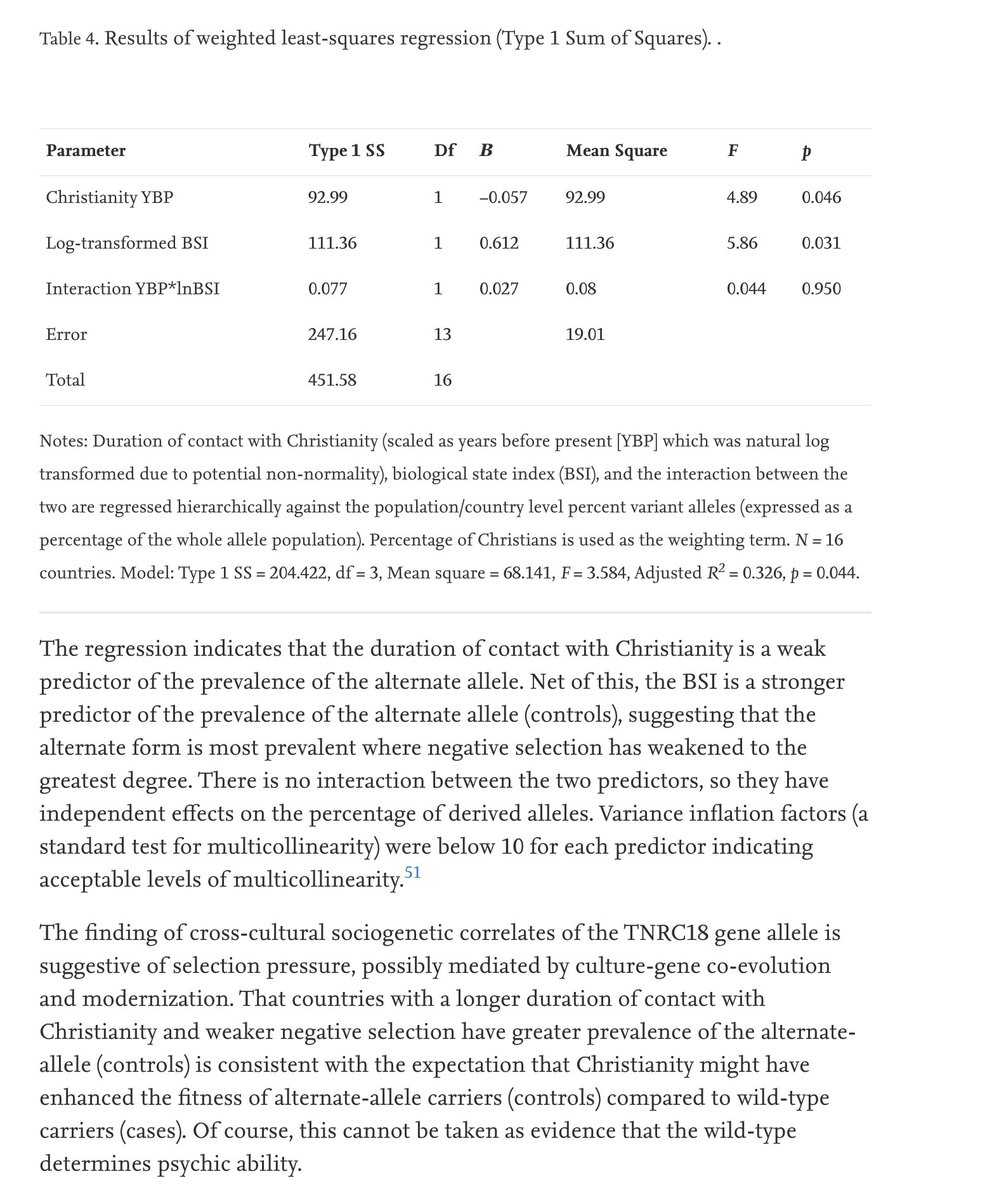
Next we get detailed cross-cultural sociogenetic analysis.
Wow. That sound like some serious science.
No. Actually it's a term that's appeared only once before—in a different paper by one of this study's authors.
Don't be intimidated by jargon! Or least make sure it's real.
Wow. That sound like some serious science.
No. Actually it's a term that's appeared only once before—in a different paper by one of this study's authors.
Don't be intimidated by jargon! Or least make sure it's real.
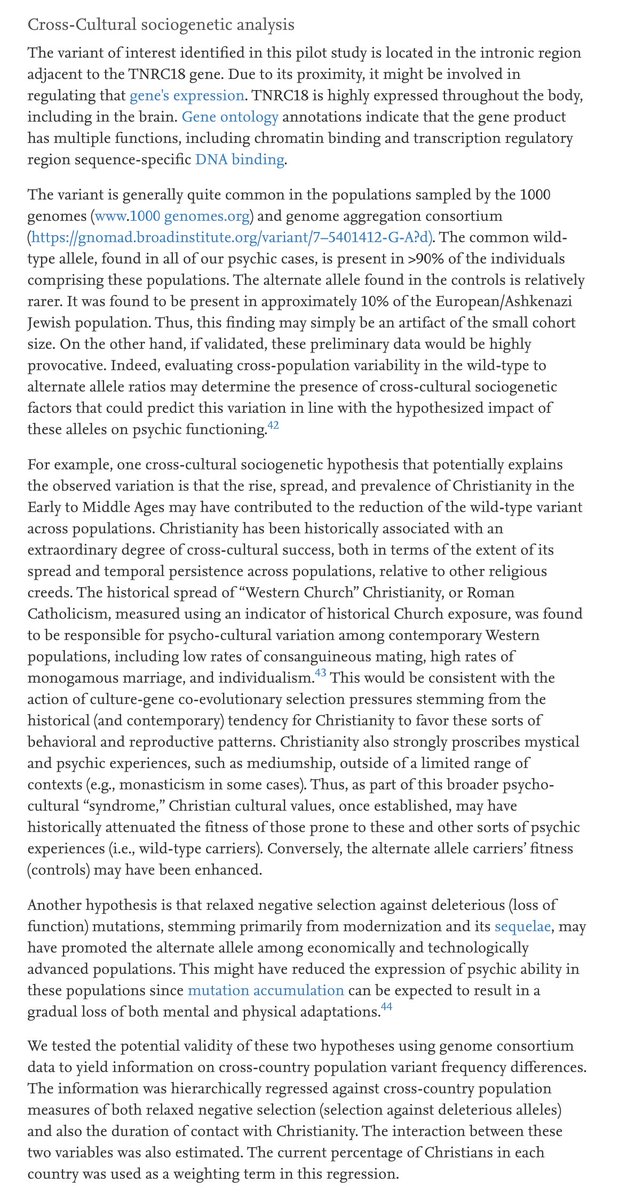

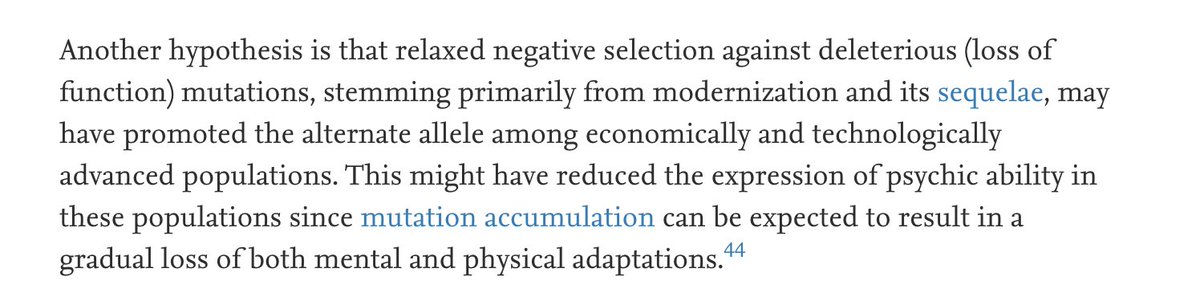
Anyone with a bit of background in population should read the above. It's wild. To summarize, the authors find a single base pair difference in a non-coding genomes of a very small sample of people who don't differ in psychic ability, and from this posit a selective explanation.
Namely, modernization led to relaxed selection on psychic ability (which, I remind you, is determined by this single base-pair difference in a non-coding region and not manifested in the phenotypes of the study subjects), and this is driving a shift in allele frequencies.
Another tip: the extraordinary amount of effort here put into the analysis of a complete non-result should itself be a red flag, even if you don't know enough population genetics to realize that GPT-3 could have written something more convincing.

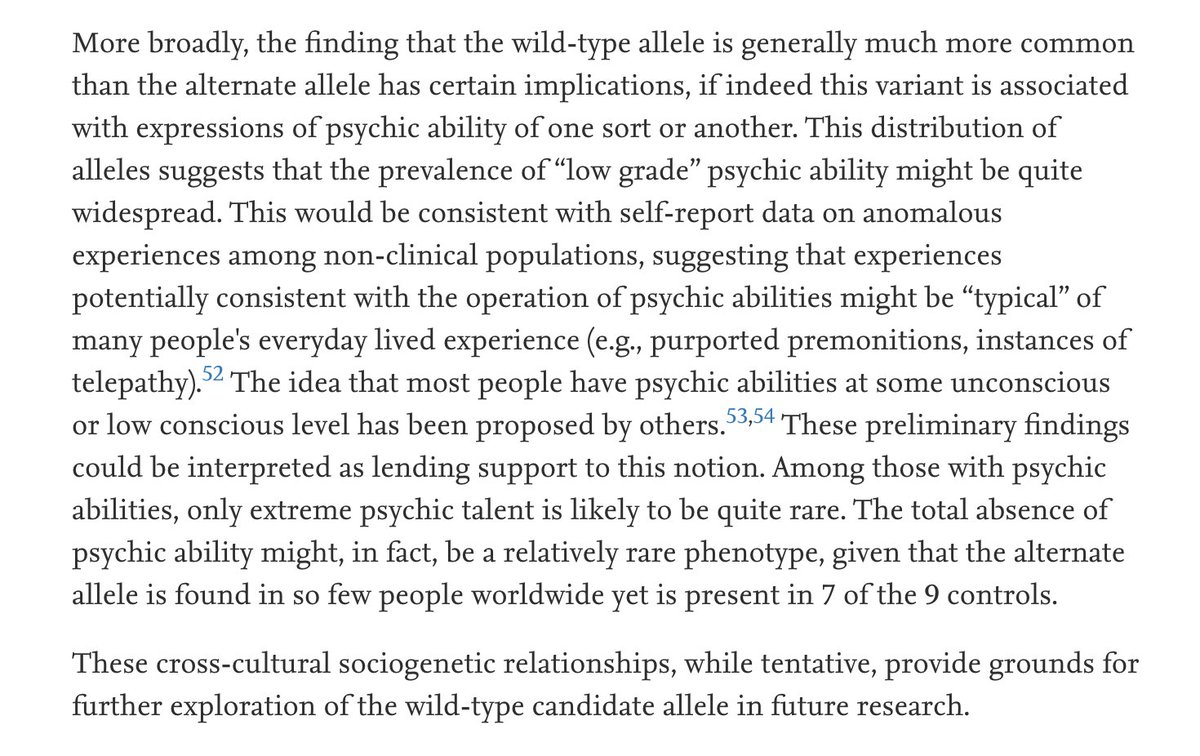
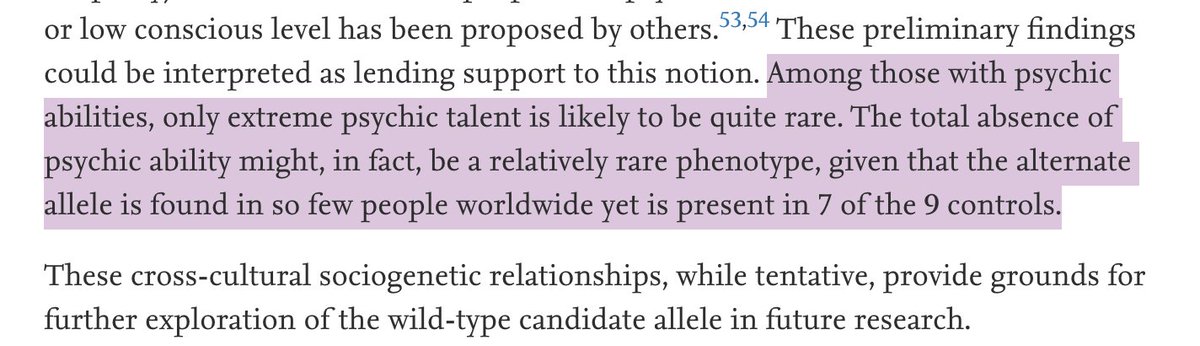
Next the authors note that the more common allele in their controls is less common in the population at large. They forget that the controls are just that—random controls—and not people selected for lack of psychic ability.
So they conclude that psychic ability must be common!
So they conclude that psychic ability must be common!
Honestly I'm a bit exhausted at this point and feel like I just finished watching Inception backward, stoned. I'll leave you with the conclusion of the paper and remind you that it is based on finding no genetic differences between two small groups with no phenotypic differences.

• • •
Missing some Tweet in this thread? You can try to
force a refresh