Prof. Christina Pagel Profile picture
May 4, 2021 7 tweets 3 min read Read on X
THREAD on B1617 from COG data:

Yesterday I did some tweets about the growth of B1617 ("India") and its subtypes in the community using data from the Sanger Inst (England only).


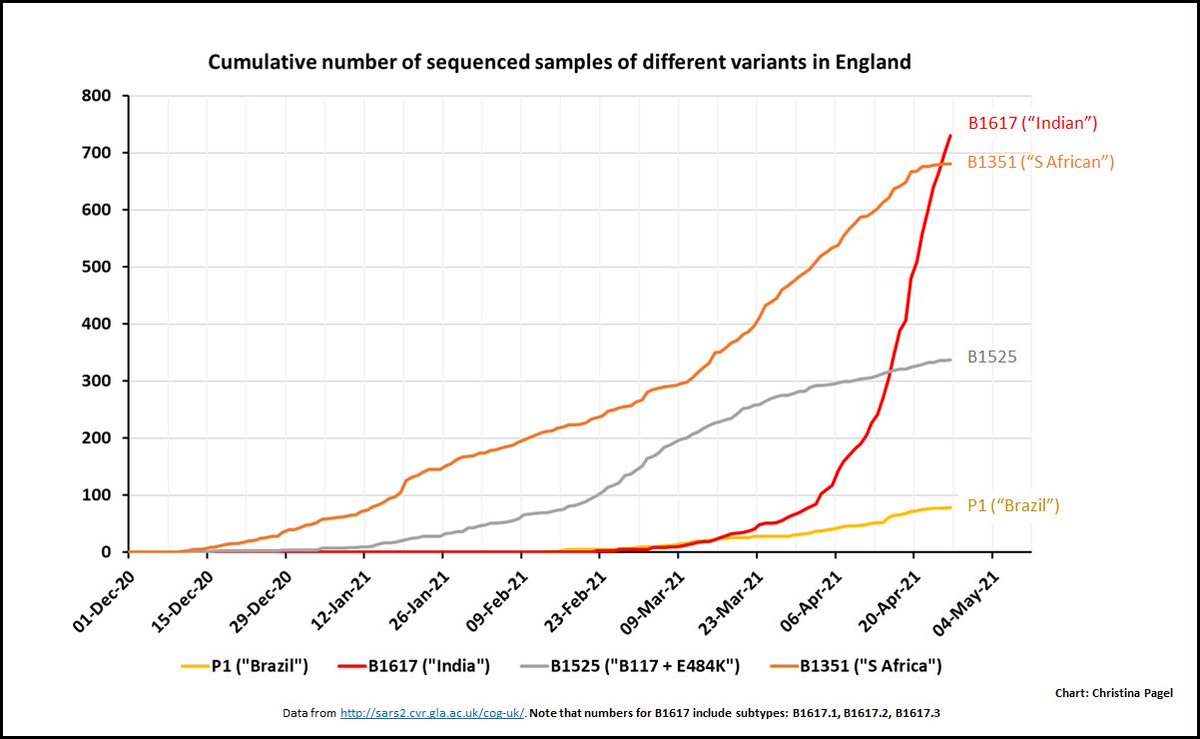
Here is the recent data from England from COG (genetics consortium for covid)
2.This includes data from travellers & surge testing

BUT overall picture is the same as for community cases from Sanger yesterday.

B1617 growing very fast & has overtaken all other variants of concern / under investigation (except B117 ("Kent") which is still >90% of cases). Image
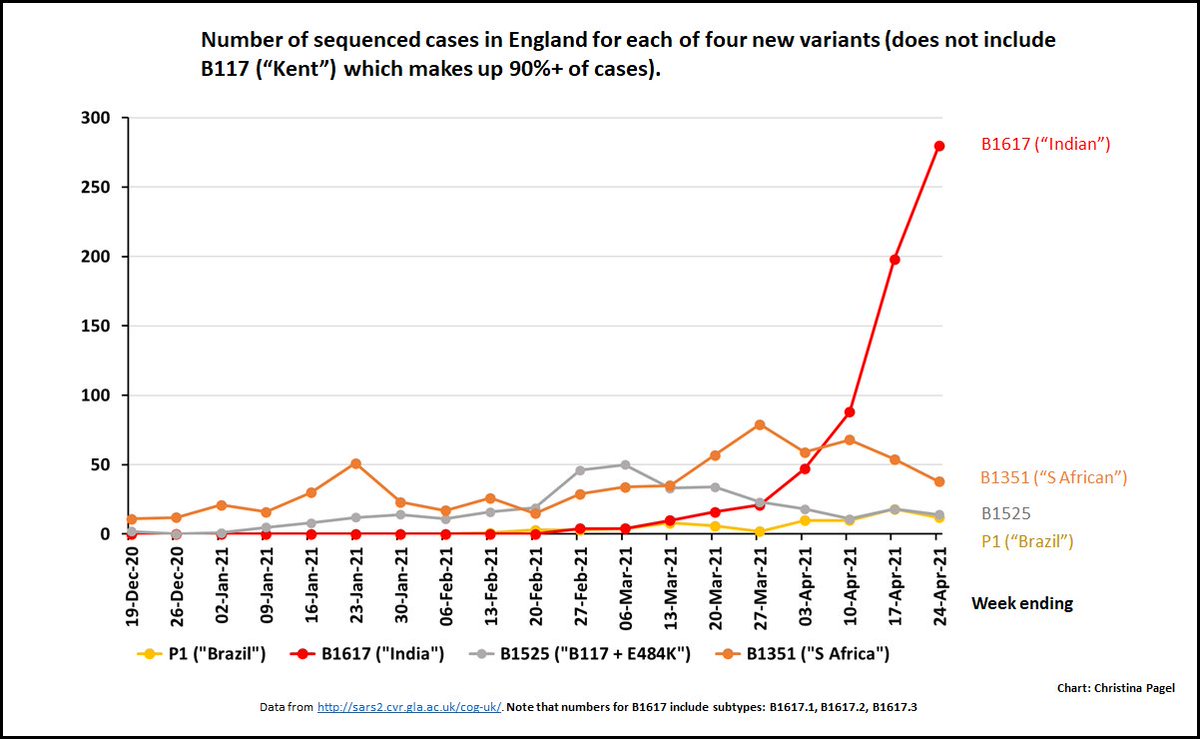
3.Look at the number each week, you can see that the other main variants are hardly growing. B117 cases ("Kent") are also going down (which is why our overall case numbers are falling).

But this variant, B1617 ("India"), is still shooting up. Image
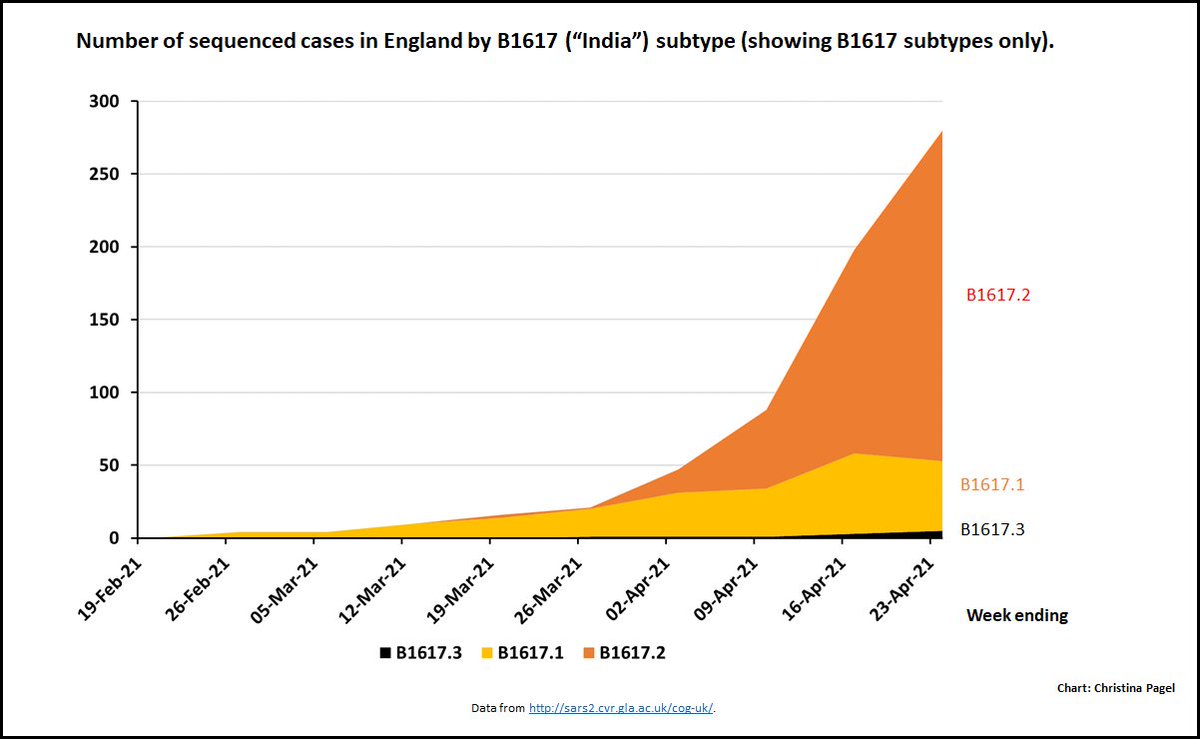
4.Digging into its subtypes, one in particular stands out: B.1617.2.

This is the one *without* the E484Q mutation. It is *also* the sub-strain that is now dominating India. Image
5.Who knows why it's outcompeting its variant siblings... (I don't anyway). Perhaps the prelim data from @GuptaR_lab showing that the "E484Q"+"L452R" mutations didn't seem to confer any advantage over just "L452R" provides a clue?
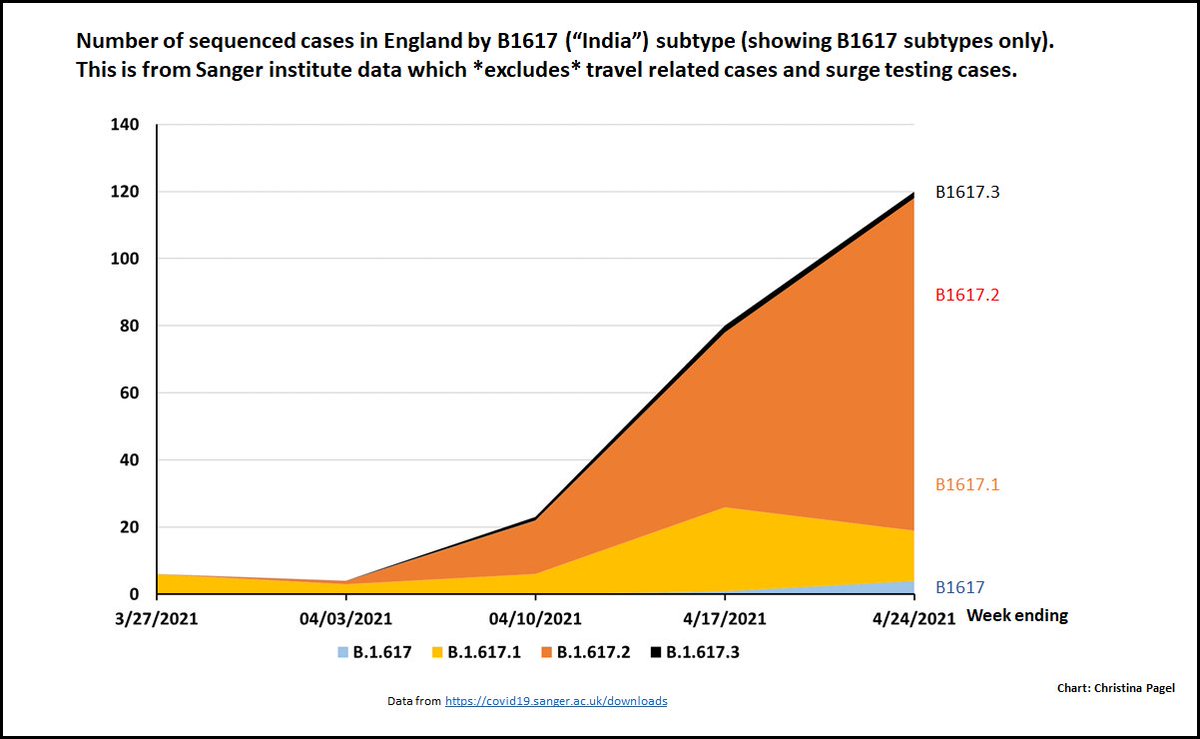
6.But basically - we've seen this characteristic spread in India, we are seeing it in the COG data (all England data - tweet 4 above) and we are seeing it in the Sanger data (just community cases).

Sanger chart is below Image
7. Do we have definitive evidence that B1617.2 is more transmissible? No

But honestly I think canaries are chirping - we know it's in the community (from Sanger) and we should act to contain right now while numbers manageable. /END

• • •

Missing some Tweet in this thread? You can try to force a refresh
 

Keep Current with Prof. Christina Pagel

Prof. Christina Pagel Profile picture

Stay in touch and get notified when new unrolls are available from this author!

Read all threads

This Thread may be Removed Anytime!

PDF

Twitter may remove this content at anytime! Save it as PDF for later use!

Try unrolling a thread yourself!

how to unroll video
  1. Follow @ThreadReaderApp to mention us!

  2. From a Twitter thread mention us with a keyword "unroll"
@threadreaderapp unroll

Practice here first or read more on our help page!

More from @chrischirp

Aug 28
THREAD: I asked what the point of Public Inquiries is for @bmj_latest

We've spent hundreds of millions of £ on Inquiries over last decades, generating deep understanding of failures & 1000s of recommendations.

But v few recommendations get implemented!
What is going on?

1/12 Image
E.g. Covid-19 Inquiry has cost £94 million so far - and is projected to cost over £200m by its end (it still has years to go).

1st report published (out of at least 9) found major flaws and proposed 10 recommendations.

Chances are low that they will be implemented :-( 2/12


Image
Image
Image
Image
Inst for Government looked at 68 Inquiries from 1990-2017.
The Inquiries cost over £630 million and made 2,625 recommendations.

Only 6/68 Inquiries have received full scrutiny by a parliamentary select committee on implementation of recommendations. 3/12 Image
Read 12 tweets
Aug 9
🧵War causes direct civilian deaths but also indirect deaths over the following years.

Recent paper estimates eventual total direct & indirect deaths in Gaza attributable to the war - 10% of entire pop'n.

I want to explain these estimates and why deaths must be counted. 1/13 Image
Why count casualties from war anyway? For moral, legal and strategic reasons.

1 - owe it to those who have died
2 - International law says must count & identify dead as far as possible
3 - monitor progress of war & learn from tactics

2/13 Image
There are direct and indirect casualties of war. Direct deaths include those who killed by fighting or bombs.

Indirect deaths are those that die when they would otherwise have lived because of one or more of: lack of food, healthcare, housing, sanitation, income, hope. 3/13 Image
Read 14 tweets
Aug 1
THREAD: the summer Covid wave in the UK continues.
Basically, there is a LOT of Covid around and not a lot of other respiratory viruses.

If you have cold or flu symptoms, it's probably Covid.

The latest hospital data from England shows steady, quite high levels. 1/8 Image
But admissions don't tell us how much virus is circulating more generally. The best (but imperfect) measure we have is wasterwater measurements, and only in Scotland and not England.

Scotland's wastewater is showing a huge July peak - highest since Omicron's 1st yr in 2022 2/8 Image
Because different people shed different amounts of virus and variants can matter too, you can't for sure infer how many people were infected between different wasterwater peaks. BUT given the size, I'd say it's pretty likely this is the largest peak since 2022 in Scotland 3/8
Read 8 tweets
Jul 23
THREAD:
I wrote about Baroness Hallett's Inquiry Module 1 report for @bmj_latest .

She found that there was *never* a plan to keep a pandemic death toll down - I discuss this and what it means going foward.

Main points below: 1/14 Image
The headline most seen is that the UK planned for the wrong pandemic.

While it is true that was far too narrow a focus on a flu pandemic, that is not the most telling bit.

To me the most telling bit, is what the plan did NOT do 2/14


Image
Image
Image
Image
The issue is less the wrong disease, but that there was never a plan to prevent one at all – of any disease type.

The plan was *never* about reducing the number of pandemic deaths. 3/14 Image
Read 14 tweets
Jul 19
Quick thread on current Covid situation in England and Long Covid.

I have Thoughts about the Inquiry Report published yesterday but am still trying to organise them.

TLDR: high Covid levels remain, Long Covid remains 1/11
This wave is not over. While the number of admissions with Covid remains lower than the autumn/winter waves, it has now remained highsh for several weeks.

This means there are a lot of people out there getting sick - and having their work, plans and holidays disrupted. 2/11 Image
Scottish wastewater data to 9 July shows a sharp decrease, suggesting that prevalence might be on its way down.

Obviously Scotland and England can have different dynamics, but it’s the best we’ve got as long as England refuses to analyse its own wastwater. 3/11 Image
Read 12 tweets
Jul 3
THREAD: Given tomorrow's election, I've been thinking about our nation's (poor) health, the wider determinants of health and how these have worsened and what it means for policy....

TLDR: worrying only about NHS & social care is missing the point

let's dive in... 1/25
The UK has a health problem. After steady gains in life expectancy for decades, it flatlined during the austerity years and fell for the first time this century with the Covid pandemic.

The number of people out of work for long term sickness is near record levels. 2/25
There are huge inequalities between rich & poor. Boys born in the most deprived areas can expect to die almost 10 years earlier than their peers in the least deprived areas.

Even worse, they can expect to spend 18 fewer years of their life in good health (52 vs 70 years) 3/25 Image
Read 38 tweets

Did Thread Reader help you today?

Support us! We are indie developers!


This site is made by just two indie developers on a laptop doing marketing, support and development! Read more about the story.

Become a Premium Member ($3/month or $30/year) and get exclusive features!

Become Premium

Don't want to be a Premium member but still want to support us?

Make a small donation by buying us coffee ($5) or help with server cost ($10)

Donate via Paypal

Or Donate anonymously using crypto!

Ethereum

0xfe58350B80634f60Fa6Dc149a72b4DFbc17D341E copy

Bitcoin

3ATGMxNzCUFzxpMCHL5sWSt4DVtS8UqXpi copy

Thank you for your support!

Follow Us!

:(