Manindra Agrawal Profile picture
May 6, 2021 22 tweets 6 min read Read on X
<Update on 6/5> @stellensatz I am finding it increasingly difficult to post updates. Hence, getting a website prepared that will do the job. Hope it will be ready by tomorrow. That will allow me to focus more on discussions.
Many posters have pointed out erroneous predictions done for second wave in early April. I already explained the reasons in India thread. If they do not sound convincing, please pay no attention to our predictions. I am sure there are better things to do!😊
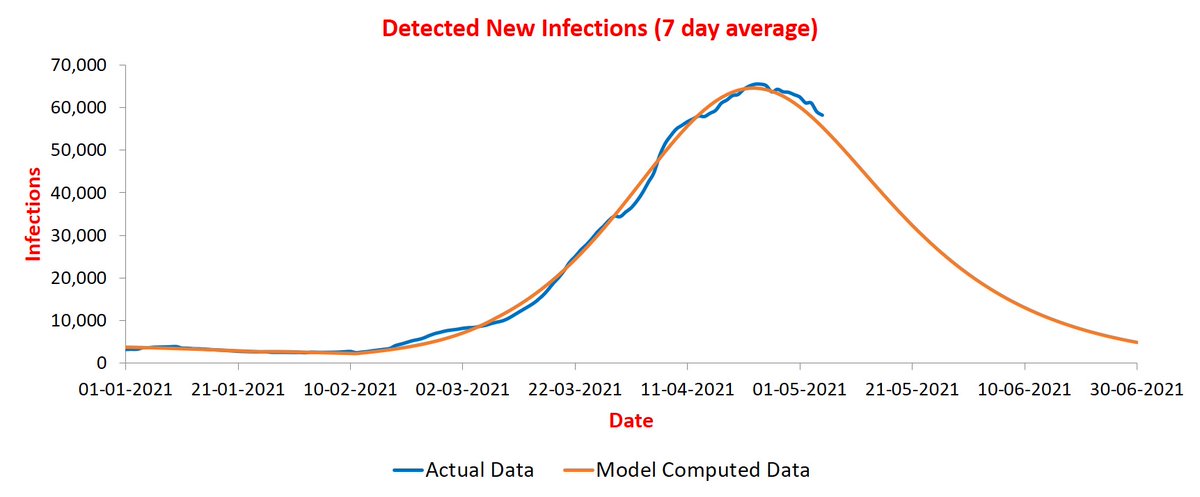
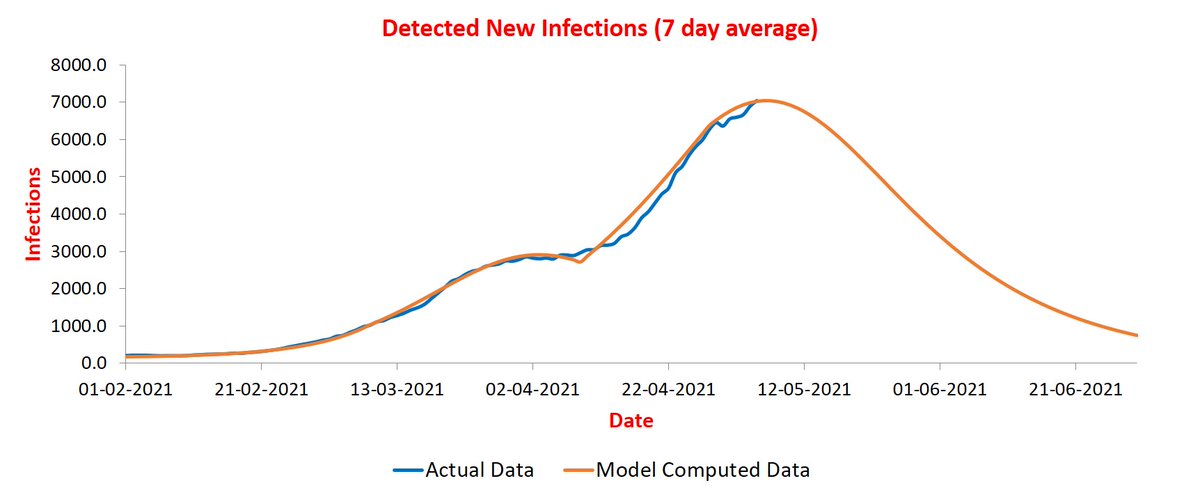
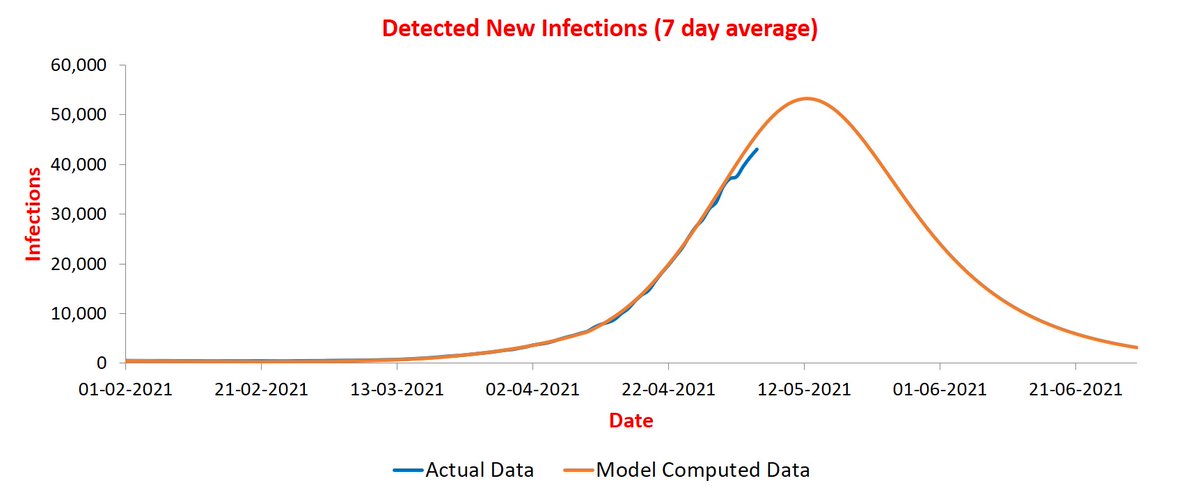
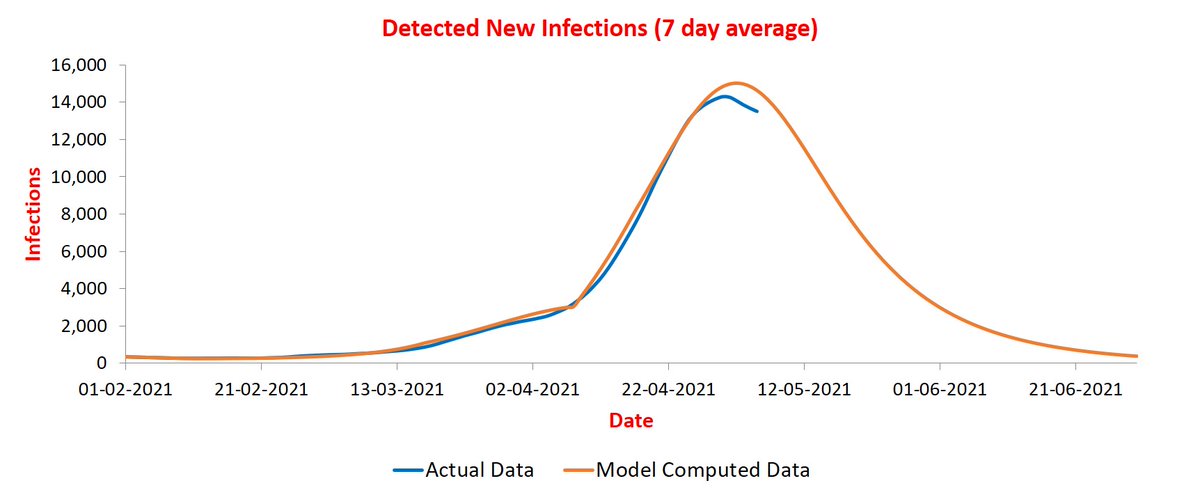
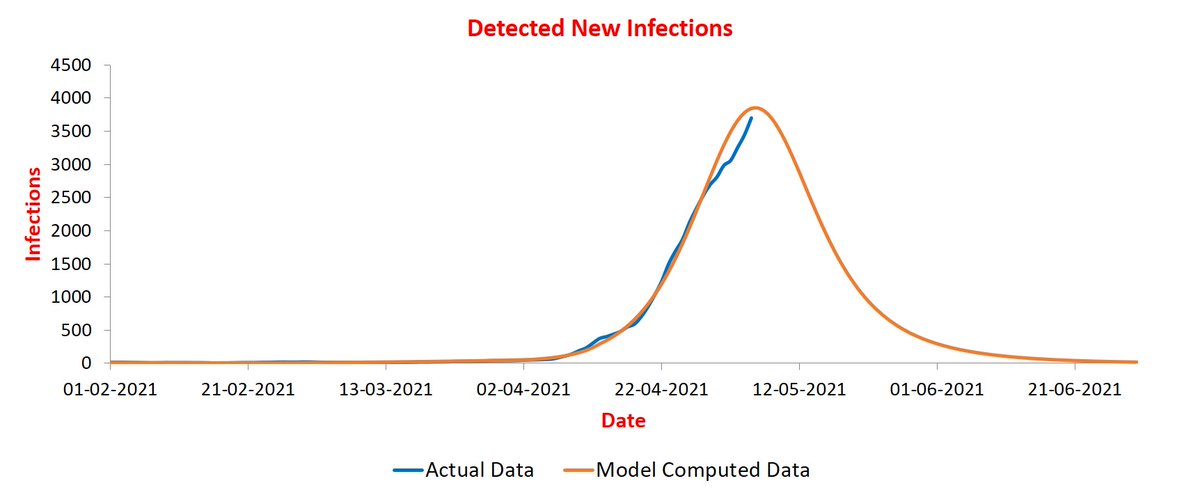
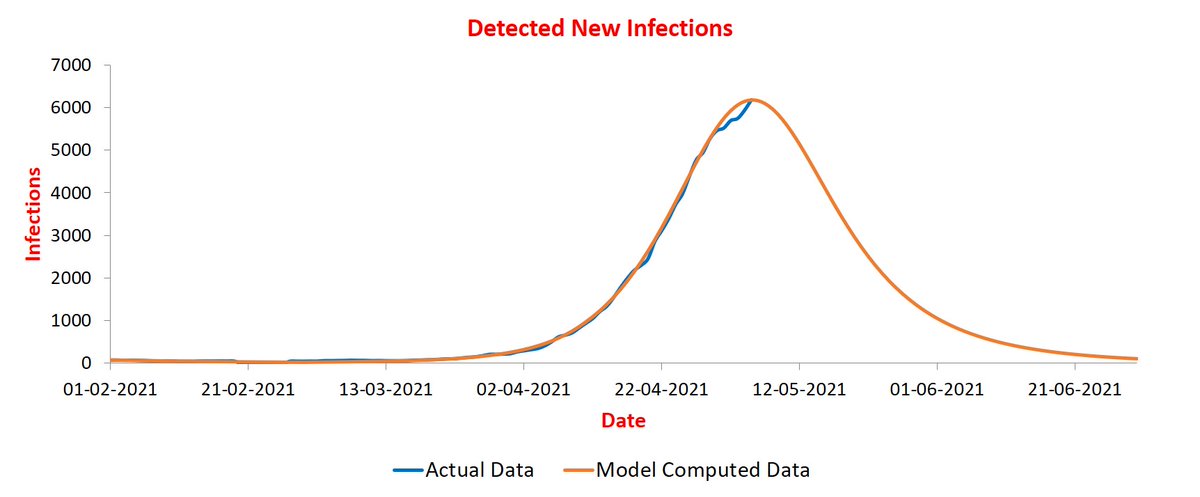
For those, who find some value in our predictions, here are updates. Maharashtra continues its downward journey. Notice that orange curve is fitting better now! It is because I updated the simulation with data up to 5th May. Earlier one was with data up to 24th April.
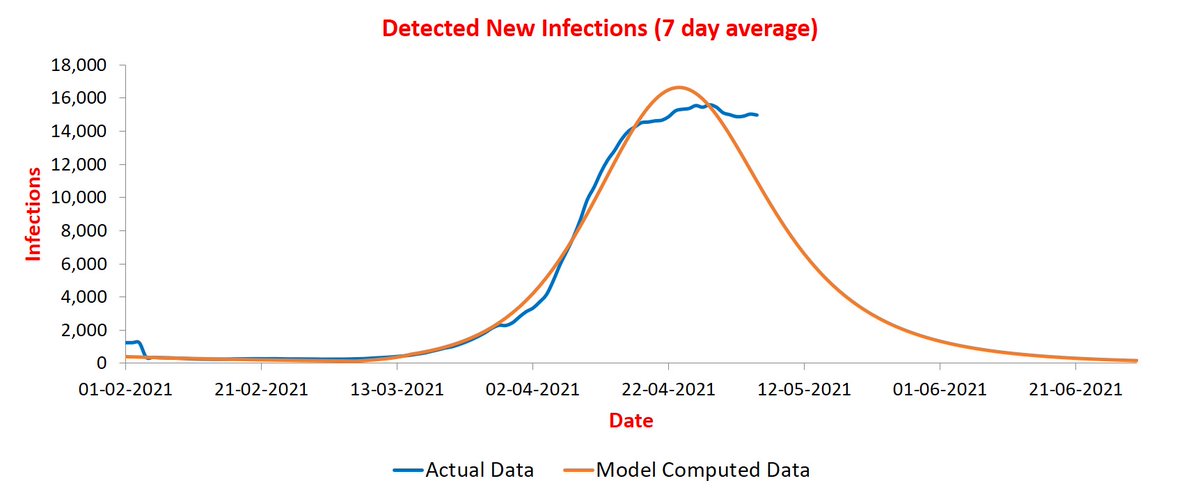
Chhattisgarh continues to hover. It is almost horizontal! This simulation is also updated with up to date data now.
UP is now clearly going down. The slope is slower than predicted though. The simulation is updated as well.
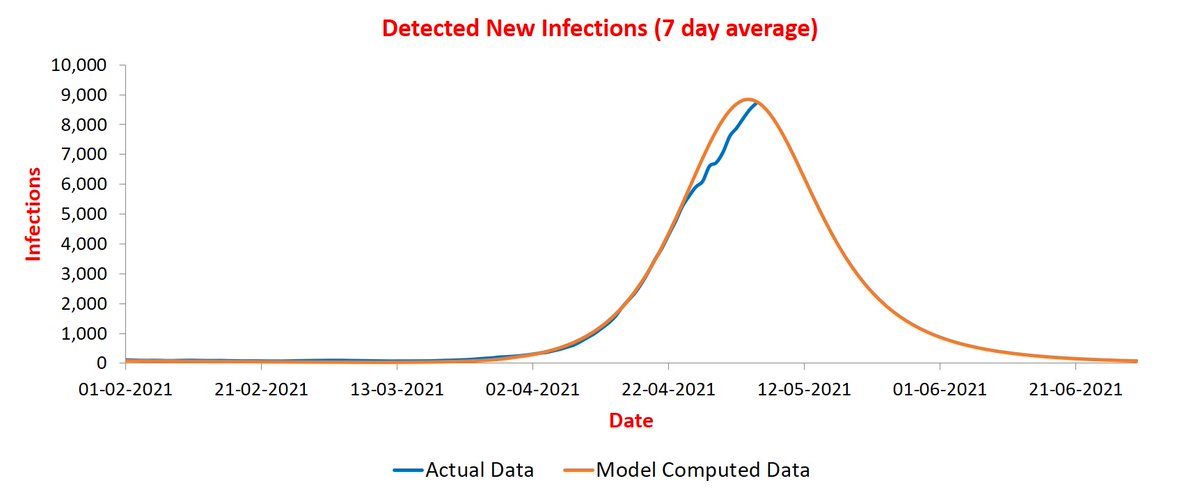
Bihar curve was indeed going through a phase change! It occurred around 24th April. There is barely enough data to capture it with some confidence. More data is required though to get the trajectory right.
Delhi seems on a downward journey now! The mystery of such an early bend is explained, at least in part, by curves of Noida, Ghaziabad, and Gurugram. All are rising well beyond projected peak. It appears many people have moved from Delhi to these cities.
Rajasthan is nearing the peak.
Tamil Nadu curve has finally deviated from predicted trajectory and is peeking out a bit.
Karnataka parameters are stable now. It is likely to peak during May 10-15.
Gujarat has peaked and is on its way down!
So has MP. Although its downward slope is very gentle as of now.
Andhra trajectory required a bit of adjustment. Peak is now during May 10-15.
Haryana has gone beyond the peak! Is it a new phase? Or simply due to Gurugram numbers being increased by migration from Delhi? We will know in a few days.
Jharkhand is oscillating at the peak!
Odisha continues to diverge. It is likely due to lockdown imposed. Need a few more days data to capture it as a new phase.
Telangana has also peaked and is on its way down.
West Bengal is peaking about now.
Kerala also projected to peak about now. It has diverged from the projected trajectory for past two days though.
Adding Assam. Trajectory not fully stabilized yet, but peak does not appear too far.
Adding Uttarakhand. It appears near the peak.
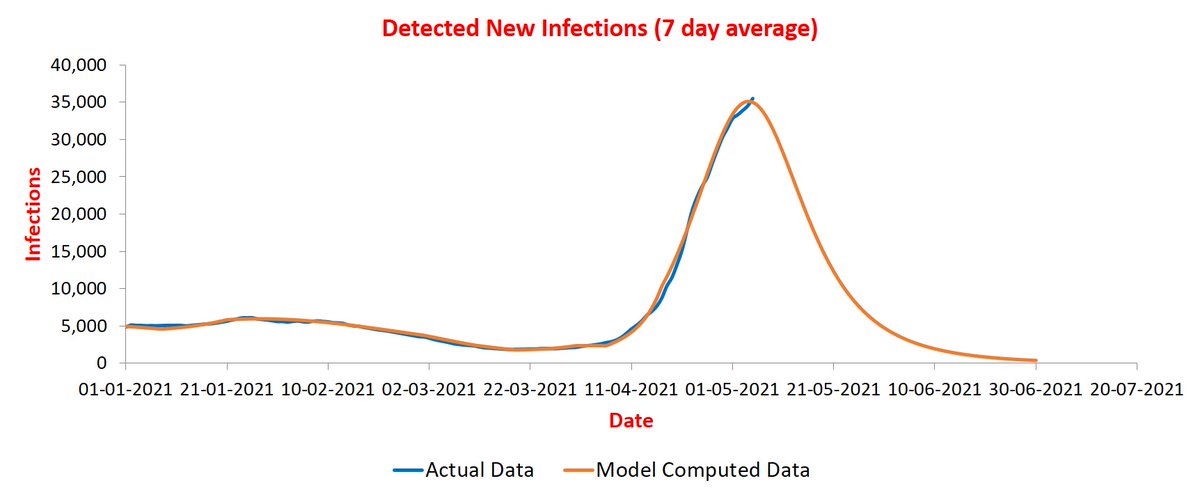
Finally Punjab. It makes a re-entry after several weeks! The phase-shift of early-April has stabilized but not fully. So the predictions are uncertain.

• • •

Missing some Tweet in this thread? You can try to force a refresh
 

Keep Current with Manindra Agrawal

Manindra Agrawal Profile picture

Stay in touch and get notified when new unrolls are available from this author!

Read all threads

This Thread may be Removed Anytime!

PDF

Twitter may remove this content at anytime! Save it as PDF for later use!

Try unrolling a thread yourself!

how to unroll video
  1. Follow @ThreadReaderApp to mention us!

  2. From a Twitter thread mention us with a keyword "unroll"
@threadreaderapp unroll

Practice here first or read more on our help page!

More from @agrawalmanindra

Apr 23, 2023
@stellensatz I am back with Covid-19 predictions, when it already seems to be peaking! Reason for being so late is that the model was unable to capture the trajectory due the numbers being very small (5-6K per new for India is nothing).
Once the numbers crossed 10K per day, the model did capture the trajectory somewhat. By 15th April, this is what it predicted: Image
The predicted peak was around 50K new cases per day somewhere in mid-May. I made a couple of media comments also based on this. However, before I could post the predictions on twitter, the trajectory changed again.
Read 7 tweets
Dec 21, 2022
@stellensatz @GyanCMehta The rapid spread of Omicron in China over the past one month has raised several questions:
1) Why is it happening in China now after such a long time despite vaccination? [1/18]
2) Numbers in some countries are also rising. Is it likely to spread to other countries too?
3) Should we be concerned in India?

I recently did a simulation of spread in China and a few other countries using SUTRA. Here are the conclusions. [2/18]
1) The new infections plot for China since March this year when a major outbreak happened. [3/18]
Read 18 tweets
Jan 5, 2022
@stellensatz The assumption I made - India will behave similarly to SA - turns out to be wrong.
Indian trajectory is rising faster than projected earlier. We now have enough data to start doing preliminary predictions (as opposed to projections).
Maximum data is from Mumbai. Phase plot still showing a drift indicating that parameter values are likely to change. Image
Current parameter values suggest a peak around 15th Jan. Need to wait for a few more days for parameters to stabilize (of course, if lockdowns are imposed, it will change the parameters again). Image
Read 42 tweets
Dec 22, 2021
@stellensatz South Africa peaked on 17th December. Slightly before our prediction . With data up to 16th Dec, SUTRA prediction of trajectory matches well so far. Image
There seems to be broad agreement that Omicron arrived in October in SA. If true, our earlier assumption that Omicron arrived in August causing a jump in contact rate is incorrect. So how did Omicron change parameter values?
A new phase started in SA from November 1 and stabilized after three weeks. Value of contact rate (beta) increased from 1 to 1.35 and reach (rho) increased from 0.86 to 1.04.
Read 20 tweets
Dec 3, 2021
@stellensatz More information on omicron variant. First, a more careful SUTRA simulation shows that contact rate (beta) jumped to 1 by Aug-end. It strongly suggests presence of a new mutant that was active by Aug.
Note that the initially numbers would be very small and so genome sequencing may not throw up any case, especially if (as has been reported) most of the cases are mild and thus may go unreported. So it is not a surprise that first case was reported in November.
Why was the initial spread slow given that it is a highly infectious mutant?

Reach of the pandemic from July until now is around 85% (this is computed using the serosurvey that showed ~47% seropositivity in May '21). Calibrated model shows that natural immunity in Sep was ~77%.
Read 15 tweets
Oct 29, 2021
@MenonBioPhysics gave an good critique of SUTRA model a few days ago (see ). It makes many important points regarding epidemiological modeling. In this thread, I am going to develop his analysis further and show what is the purpose of SUTRA model.
A key point made is that epidemiological models stratify population on age basis since interactions vary widely with age. Further stratification is done between mild and seriously ill cases. Former is useful to make policy decisions about controlling the spread.
Latter is useful in predicting hospital beds requirements. These advantages, however, come with some complications. More compartments mean more interactions, which mean more parameters to estimate. Epidemiologists use mobility, social structures etc to estimate their values.
Read 25 tweets

Did Thread Reader help you today?

Support us! We are indie developers!


This site is made by just two indie developers on a laptop doing marketing, support and development! Read more about the story.

Become a Premium Member ($3/month or $30/year) and get exclusive features!

Become Premium

Don't want to be a Premium member but still want to support us?

Make a small donation by buying us coffee ($5) or help with server cost ($10)

Donate via Paypal

Or Donate anonymously using crypto!

Ethereum

0xfe58350B80634f60Fa6Dc149a72b4DFbc17D341E copy

Bitcoin

3ATGMxNzCUFzxpMCHL5sWSt4DVtS8UqXpi copy

Thank you for your support!

Follow Us!

:(