Lyn Alden Profile picture
May 6, 2021 8 tweets 3 min read Read on X
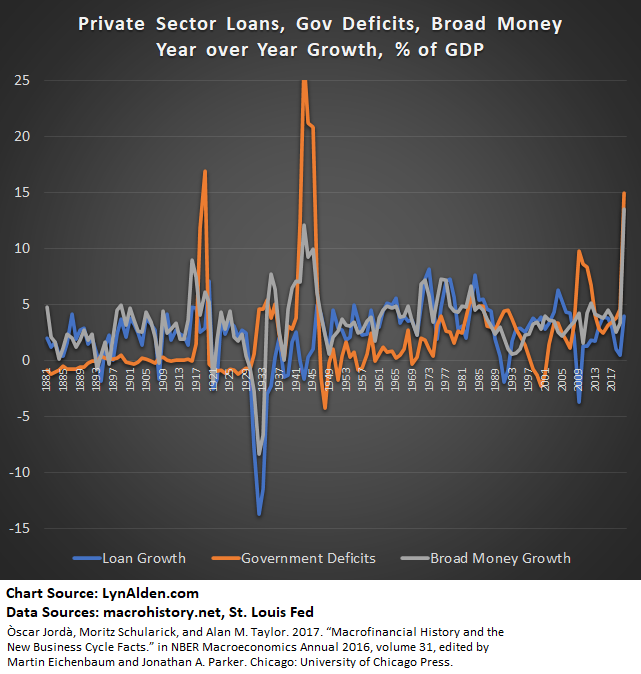
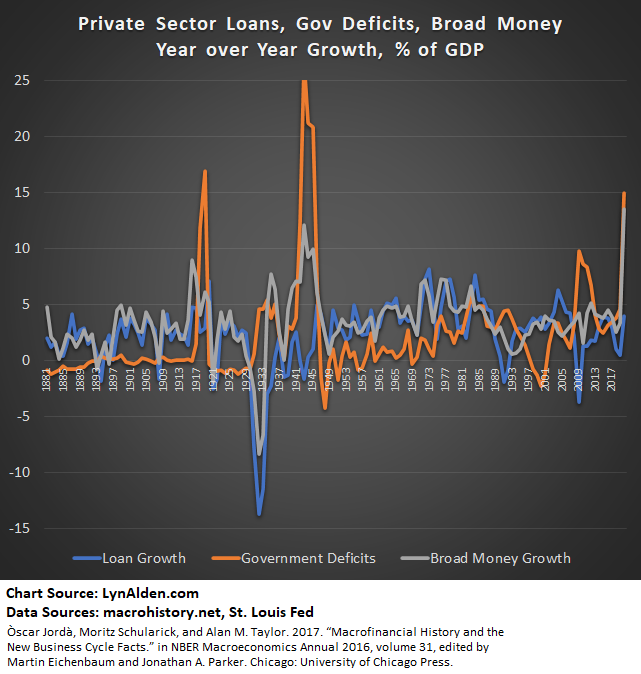
Broad money growth generally occurs in one of two ways: either banks lend and create deposits (and thus increase the money multiplier, M2/MB) or when bank lending seizes up, governments run large deficits and go around the bank lending channel.

A thread. Image
Looking at 140 years of data, we see periods where loan growth fueled broad money growth (late 1800s, 1920s, 1950s, etc), periods where fiscal deficits fueled broad money growth (1940s), and periods like the 1970s/1980s where both lending and deficits fueled broad money growth. Image
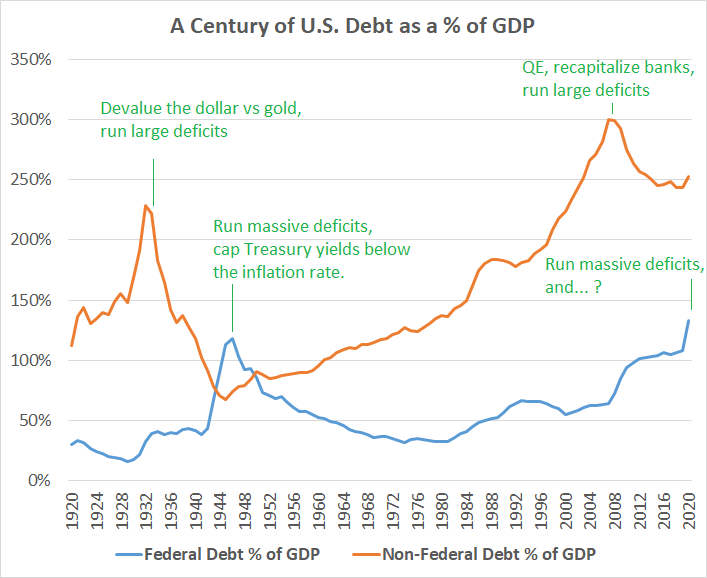
The 1940s are interesting because they are most analogous to the 2020s. After a large private debt bubble partial deleveraging (1930s and 2010s), a period of economic stagnation and external catalyst eventually resulted in a massive fiscal response (1940s and 2020s). Image
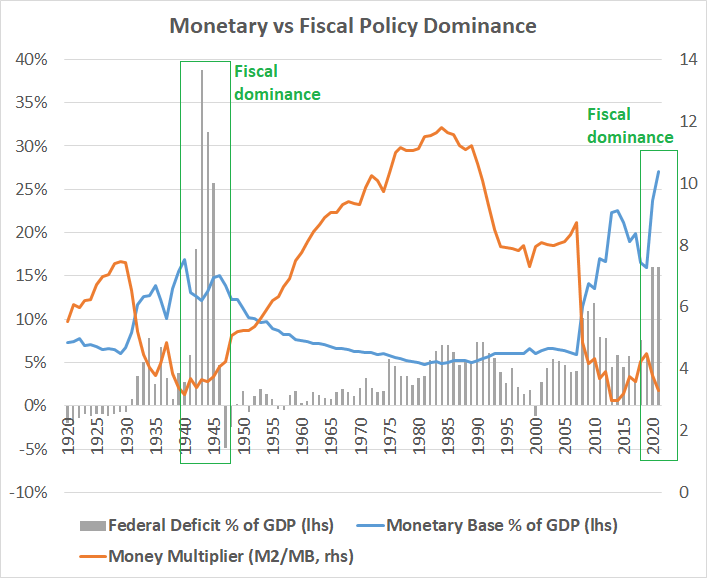
If we look at the money multiplier, M2/MB, along with fiscal deficits, we see further similarities between the 1930s/2010s (eras of rates hitting zero, monetary base expansion, private debt bubble peak), and 1940s/2020s (eras of fiscal dominance).
lynalden.com/fiscal-and-mon… Image
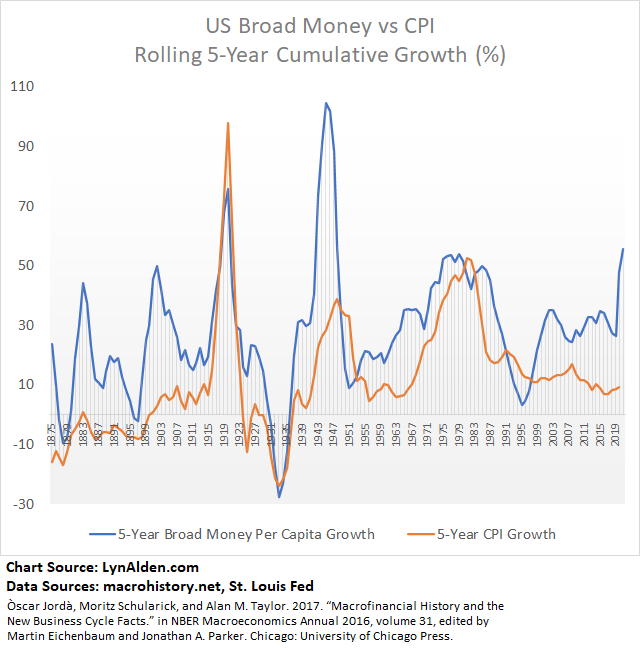
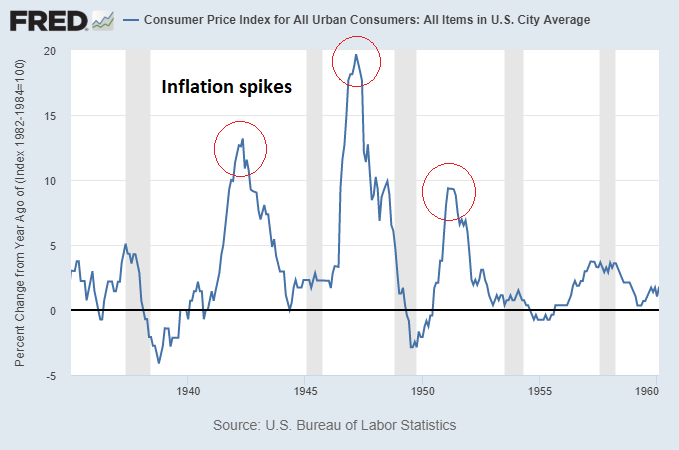
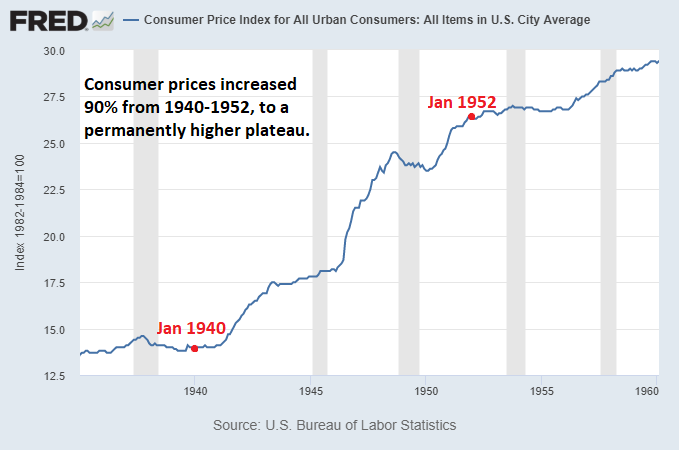
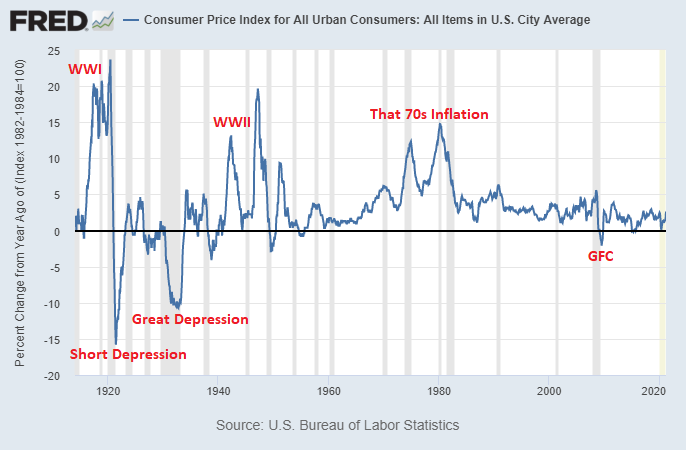
During the 1940s, inflation was transitory in rate-of-change terms, but after each spike in inflation, prices reached a new permanent plateau and went up from there. Cash and bondholders permanently lost purchasing power in three transitory/stepwise movements. ImageImage
Temporary supply shortages serve as catalysts for those rapid rate-of-change inflation spikes, but then prices remain structurally higher because more money is permanently in the system. It's not *just* the supply shortage, in other words.
When debt is high and the economy is sluggish, banks don’t lend much. The 1940s broad money growth, nominal GDP growth, and inflation were fueled almost entirely by fiscal deficit spending. It wasn’t until the late 1940s, after notable inflation, that bank lending kicked back in. Image
In other words, bank lending is not a prerequisite for either broad money growth or price inflation over a multi-year period.

Periods of fiscal dominance can override that usual relationship. Image
• • •

Missing some Tweet in this thread? You can try to force a refresh
 

Keep Current with Lyn Alden

Lyn Alden Profile picture

Stay in touch and get notified when new unrolls are available from this author!

Read all threads

This Thread may be Removed Anytime!

PDF

Twitter may remove this content at anytime! Save it as PDF for later use!

Try unrolling a thread yourself!

how to unroll video
  1. Follow @ThreadReaderApp to mention us!

  2. From a Twitter thread mention us with a keyword "unroll"
@threadreaderapp unroll

Practice here first or read more on our help page!

More from @LynAldenContact

Jan 5
A lot of individual facts that the bears were saying in 2023 and 2024 were correct, but those facts were dwarfed by fiscal dominance. Image
For example, net bank loan creation was sluggish at just $300B over the past year.

But banks also bought $400B net in Treasuries. Image
Healthcare spending, DoD spending, Social Security spending, and interest expense just kept rolling. Image
Read 4 tweets
Nov 13, 2024
I keep seeing the chart float around of 23 million government employees, as though that's directly cuttable by the new Department of Government Efficiency.

Keep in mind that 3 million of those are listed as federal and the other 20+ million are state/local.

A thread. 🧵 Image
Image
Now, quantifying the actual federal workforce is actually nontrivial.
-Are we talking civilian, or military too (1.3M)?
-Are we including postal workers (550k)?

This WH report says 4.3 million federal workers with all of this, with breakdowns.
whitehouse.gov/wp-content/upl…
But wait, there's more. There are also somewhere in the ballpark of 4 million federal contractors. The number fluctuates.

In 2023, $759 billion was committed to them.
gao.gov/blog/snapshot-…
Read 6 tweets
Nov 7, 2024
Along with Steve Lee @moneyball and Ren @0xren_cf, I co-authored a paper that analyzes the process and risks of how Bitcoin upgrades its consensus rules over time, from a technical & economic perspective.

Here's a 🧵

You can check it out here:
github.com/bitcoin-cap/bc…
Here's the v1.0 PDF version:
github.com/bitcoin-cap/bc…
Bitcoin is hard to change by design, and the methods of how it changes have evolved as the network has grown.

In the paper, we analyze what consensus is, and how different types of entities have different incentives and powers during the course of a potential consensus change.
Read 7 tweets
Dec 12, 2023
CPI for November came in this morning. Headline numbers continue to bounce around above 3%, while core continues to gradually decrease. 🧵
Image
Image
Some people assume that the end of inflation means prices go down, but instead it just means the rate of change of prices decreases to the target rate.

There's permanently more money in the system, and prices in aggregate are permanently higher. Image
Currently, China has weak domestic consumption but strong production/exports, the United States has decent consumption but weak production, and Europe's domestic consumption *and* production are weak.

This weakness weighs on energy prices and other materials.
Read 4 tweets
Dec 9, 2023
Since the start of 2020, the United States has taken on $10.7 trillion in new public debt (i.e. accumulated deficits).

That's about $80k per household in four years.

Has your household received that much in deficit spending? Some did, but likely not yours. Image
Some households received hundreds of thousands or even millions in stimulus.

And a sizable chunk of them were wealthy law firm or investment firm owners, or and various rather large business owners (100s of employees) that were not even disrupted by the pandemic/lockdowns. Image
Some households received indirect deficit expenditure. For example, if your employer received it, it may have positively affected your job.

But most analysis (e.g. see above tweet) showed that most of the money didn't go to that. It instead pooled near the top.
Read 6 tweets
Dec 7, 2023
Four monies, personified:

-The Golden Monarch
-Lord "Uncle" Sam
-The Dragon Emperor
-Archmage Nakamoto
🧵 Image
The Golden Monarch economically defeated all opposition and reigned supreme for thousands of years. Now ancient and wise, and having seen the entirety of history, he contemplates his diminishing role in the modern world and wonders if he could have done anything differently. Image
Lord Sam, usurper of gold, known merely as “the Uncle” to many, sits at the Cantillon Source and wields the mighty dollar. Liberating in his youth, now oppressive in his age. His monetary power reigns supreme but shows increasing signs of decadence, decay, and defiance. Image
Read 6 tweets

Did Thread Reader help you today?

Support us! We are indie developers!


This site is made by just two indie developers on a laptop doing marketing, support and development! Read more about the story.

Become a Premium Member ($3/month or $30/year) and get exclusive features!

Become Premium

Don't want to be a Premium member but still want to support us?

Make a small donation by buying us coffee ($5) or help with server cost ($10)

Donate via Paypal

Or Donate anonymously using crypto!

Ethereum

0xfe58350B80634f60Fa6Dc149a72b4DFbc17D341E copy

Bitcoin

3ATGMxNzCUFzxpMCHL5sWSt4DVtS8UqXpi copy

Thank you for your support!

Follow Us!

:(