Ben Casselman Profile picture
May 7, 2021 15 tweets 5 min read Read on X
Honestly, at first glance I have no idea what to make of the jobs report. Not just that it was weak, but the particular way it was weak, is perplexing. So come with me as I try to work through it the only way I know how -- with charts!
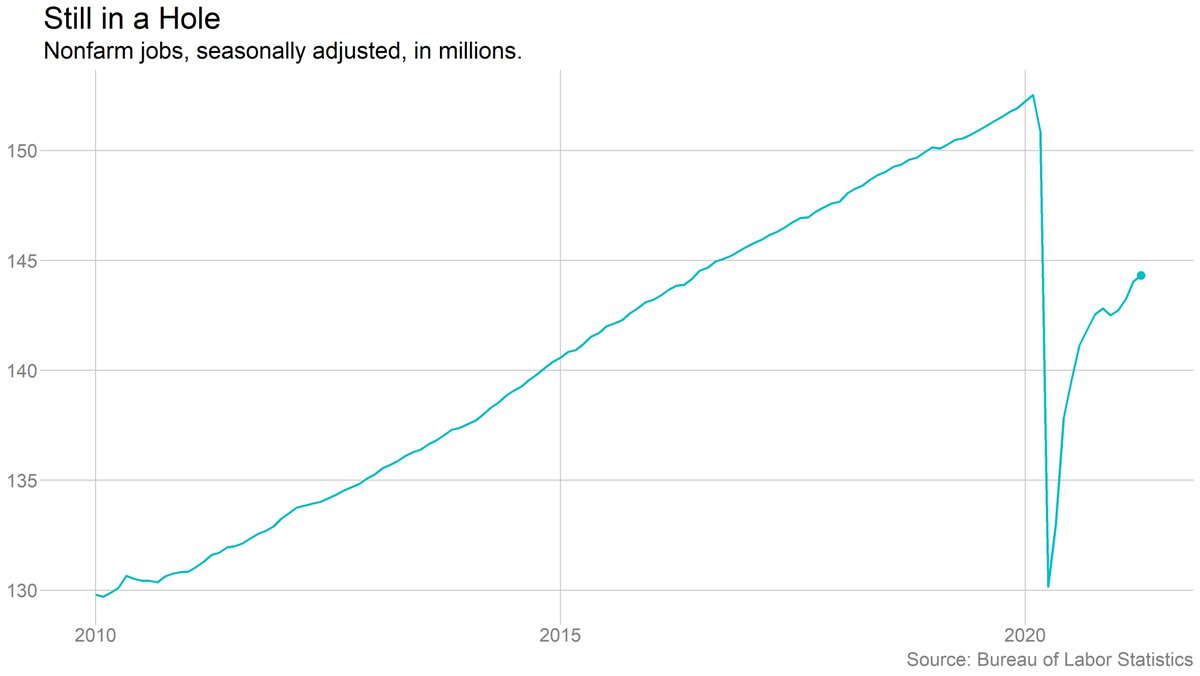
First, the obvious: The jobs gains in April were disappointing, and leave us in a deep hole. We're still 8.2 million jobs below where we were in Feb. 2020.
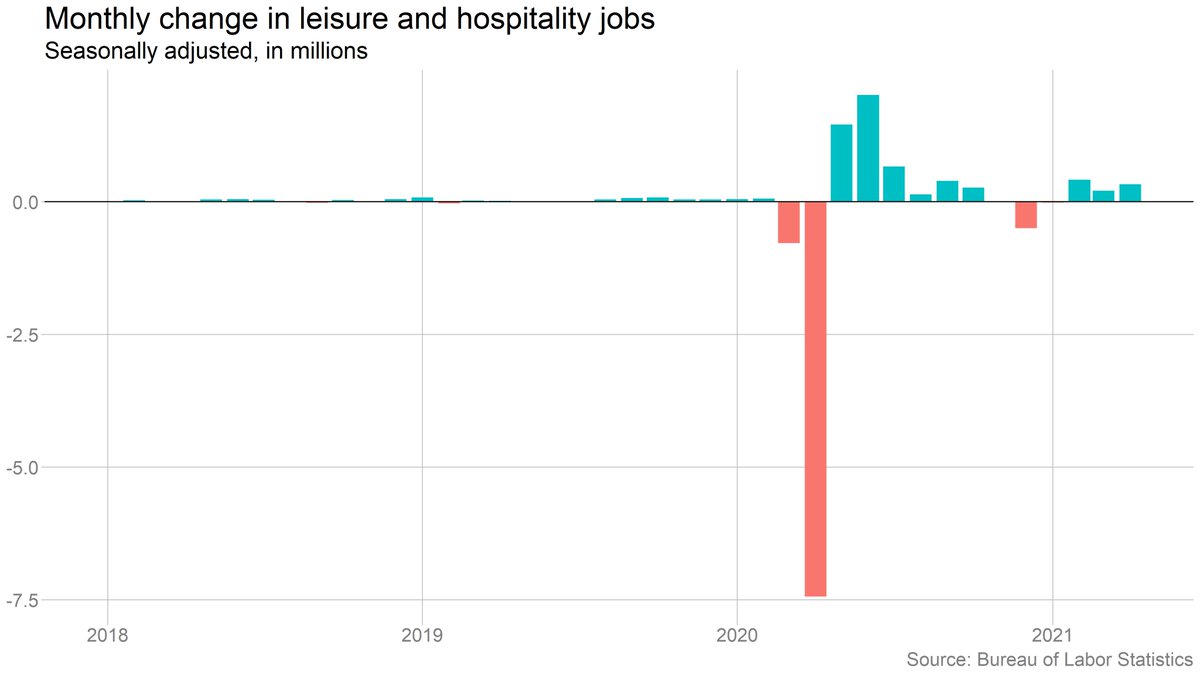
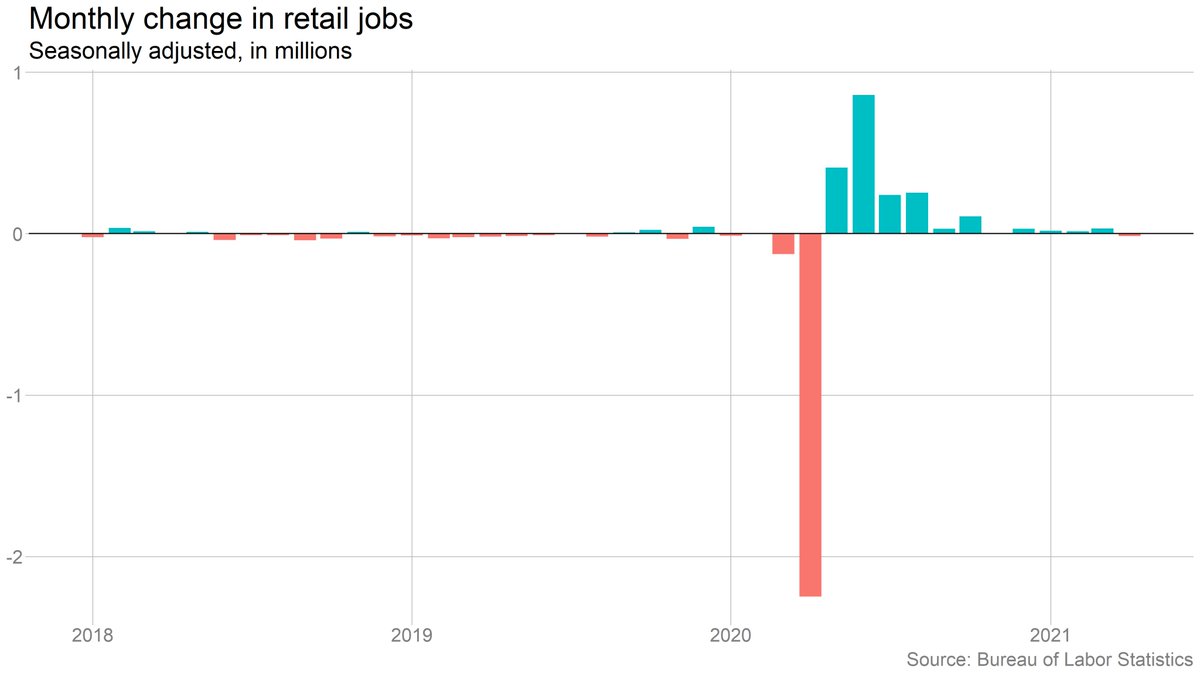
The obvious first thought is "labor shortage!" And I don't dismiss that out of hand. But the industry breakdown doesn't immediately line up with that. Leisure & hospitality (where we've heard the biggest complaints about lack of workers) actually did fine.
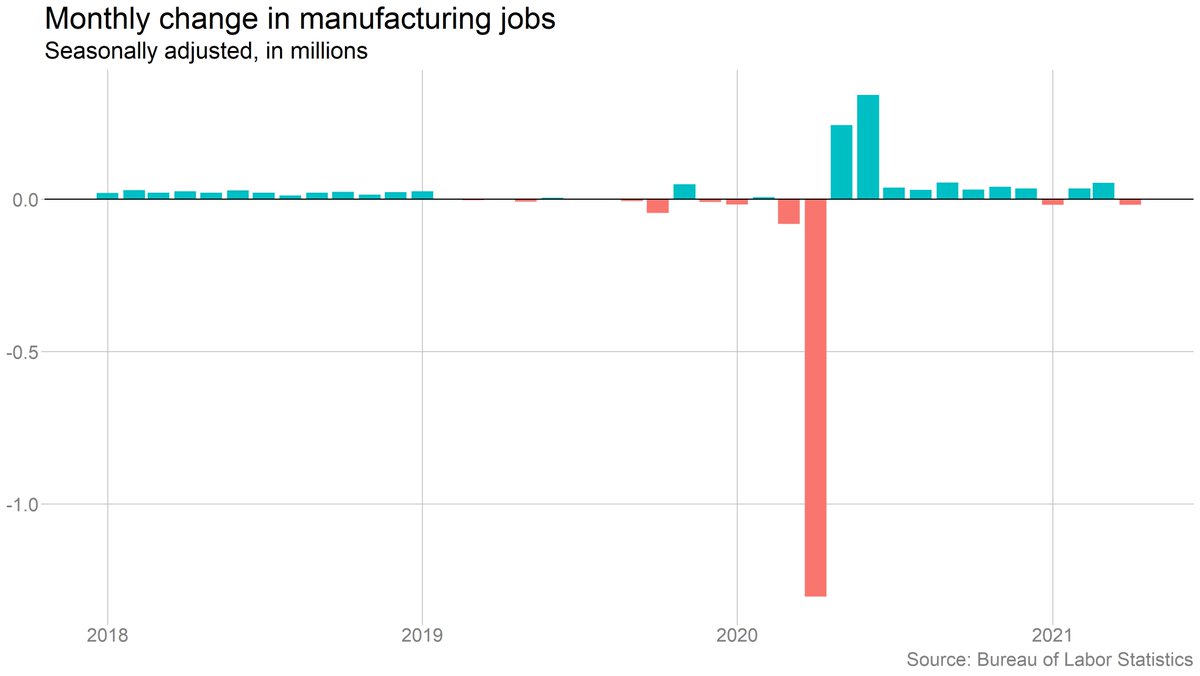
Manufacturers cut jobs, which could be about chip shortages, etc. Transportation/warehousing could be about shift back to in-person. Temp jobs could be a labor supply issue. Retail? These are all pretty after-the-fact justifications.
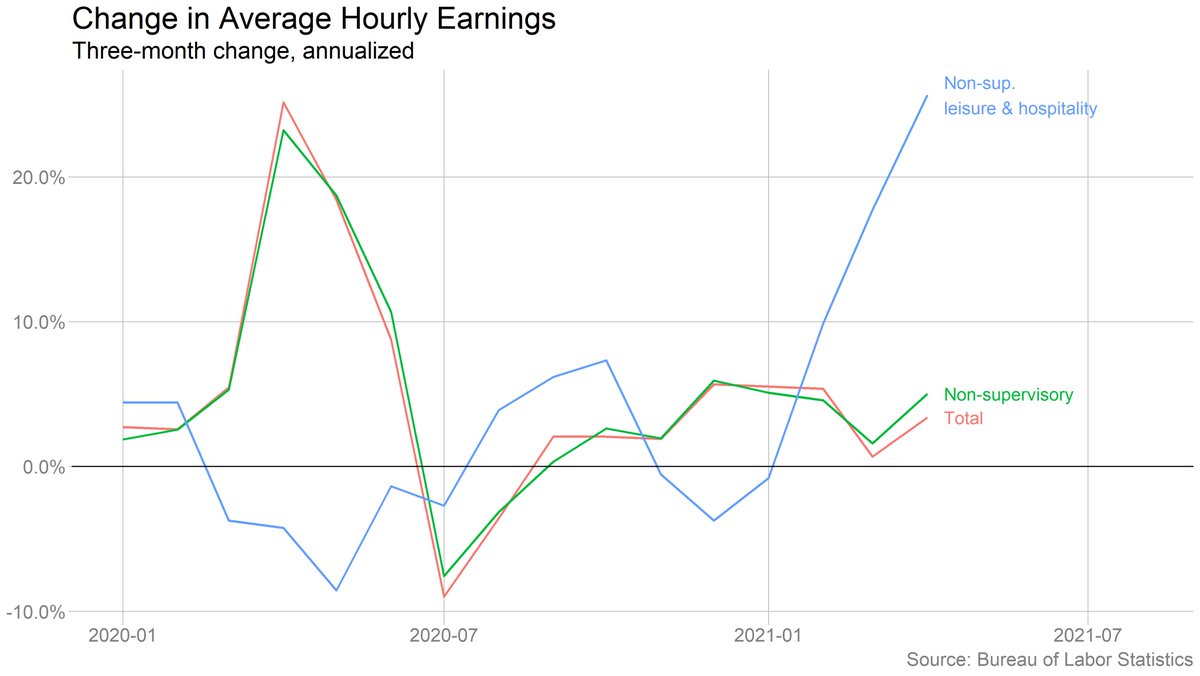
On the other hand, this chart is pretty consistent with a "labor supply" story: Wages are shooting up in leisure and hospitality.
A LOT of caveats here about composition issues, overinterpreting one month of data, etc.
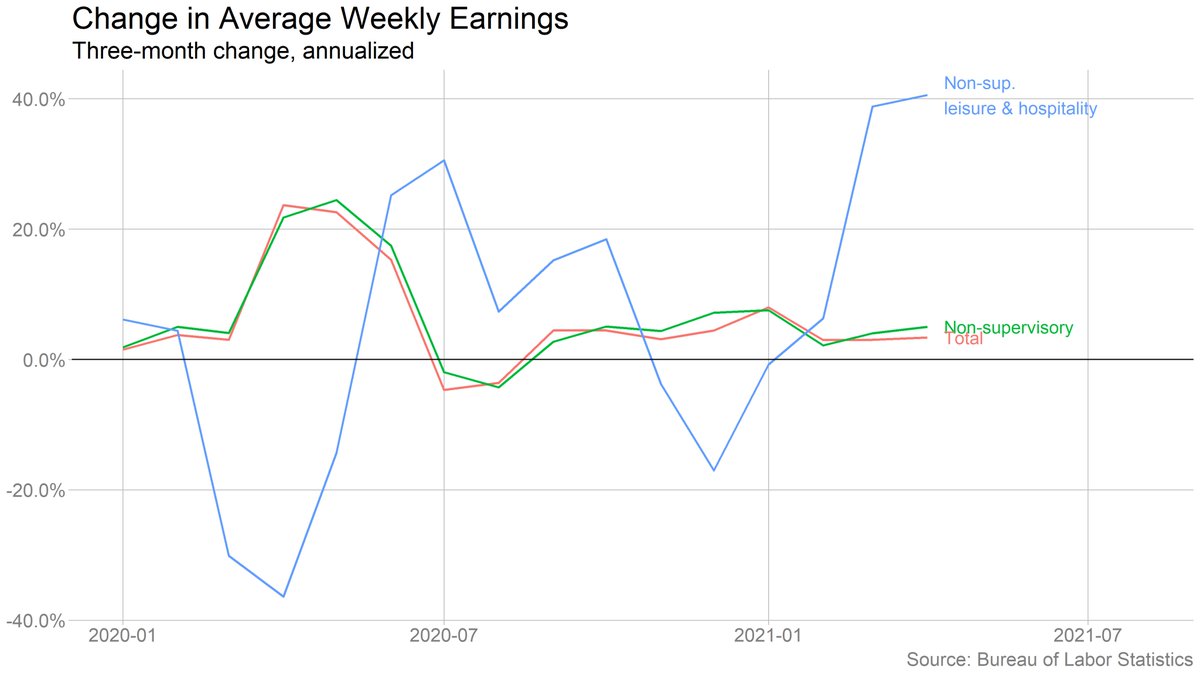
Similar story on weekly earnings, which incorporates hours worked as well as hourly pay. Interesting that the pickup there started a month earlier. (Same caveats apply.)
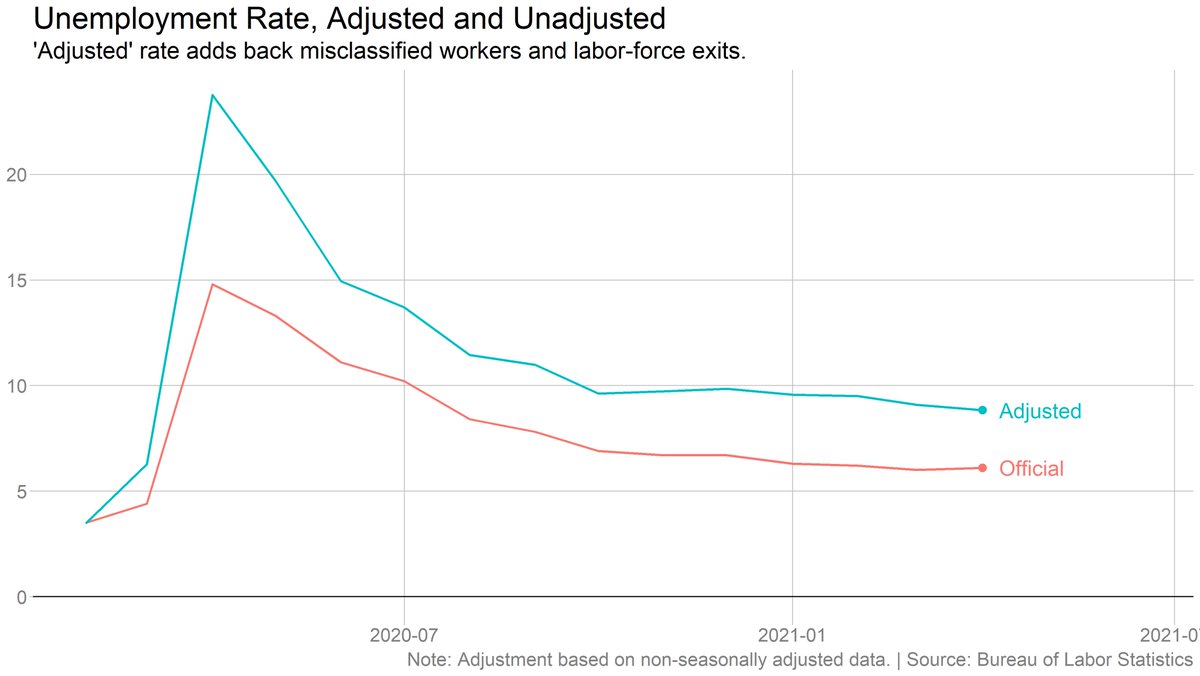
Switching over to the household survey for a bit: The unemployment rate actually ticked UP (to 6.1%), and it'd be close to 9% without misclassification and labor force.
And labor force participation rose -- the labor force grew by 430k.
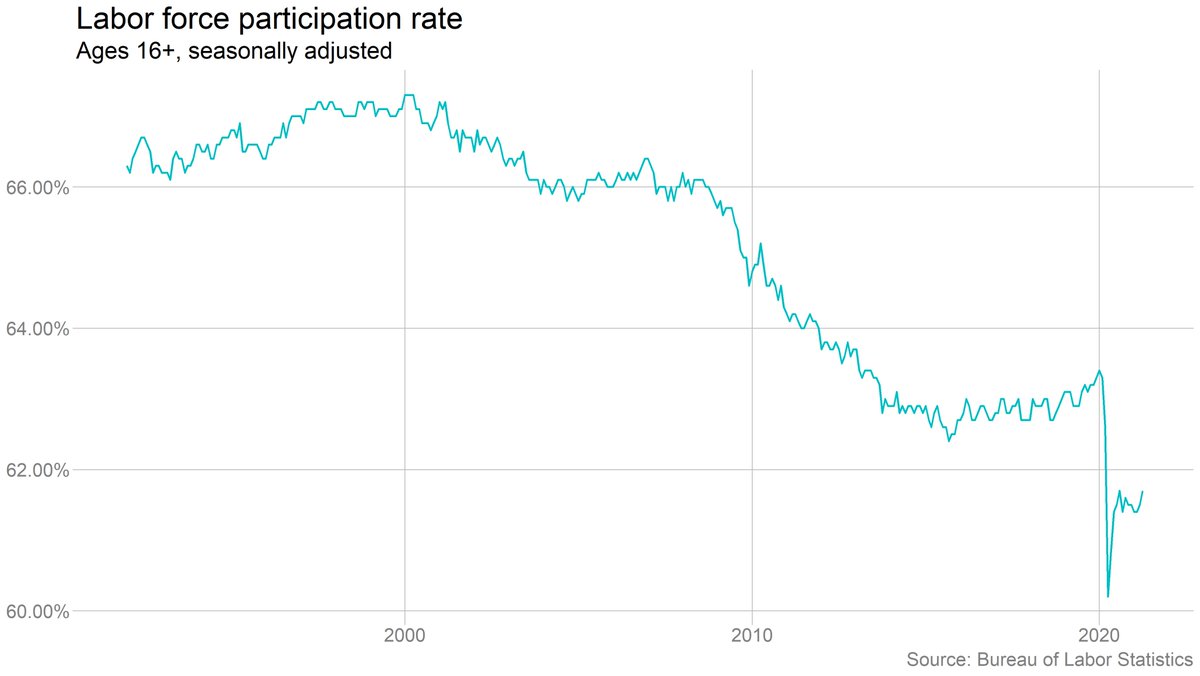
Ordinarily, if labor supply were the big issue, we'd expect to see unemployment coming down quickly but the labor force stagnating, as employers hired up available workers but couldn't attract more.
But the dynamics are funny right now. If workers are reluctant to take jobs (for any reason, not just UI), they might still show up as unemployed since they still want to work under the right circumstances.
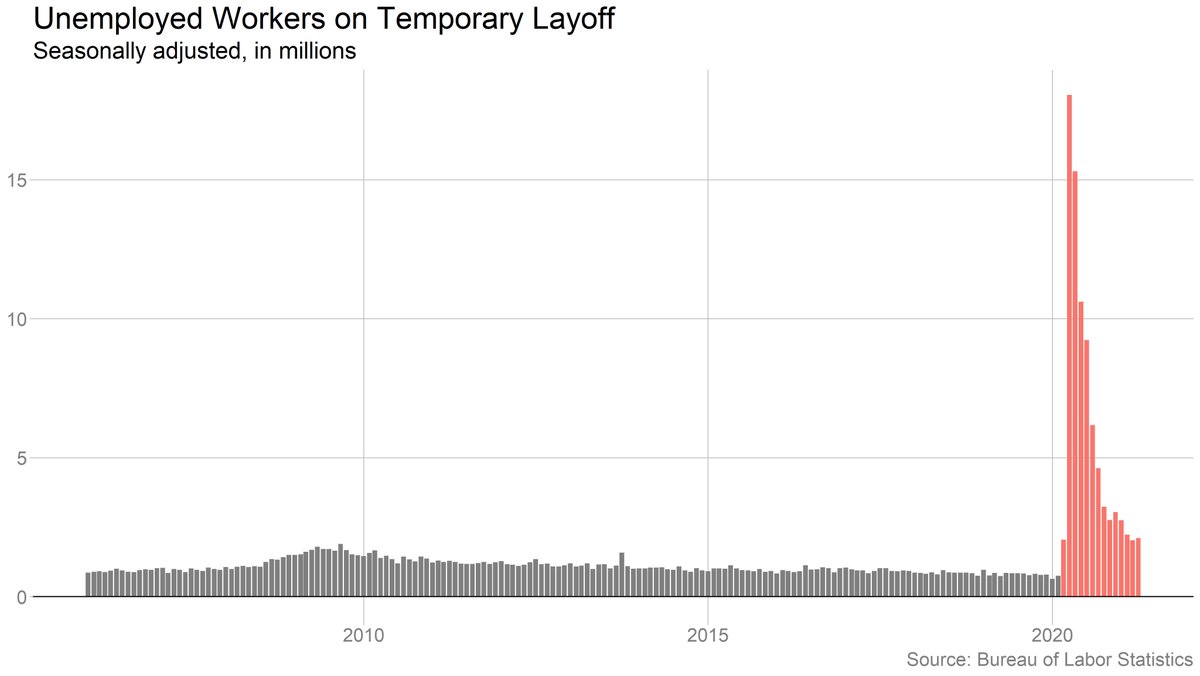
Notable that there are still a lot of people on "temporary layoff." As @nick_bunker has noted, many of these people are not actively searching while they wait for recall. (Whether these layoffs really are temporary remains to be seen.)
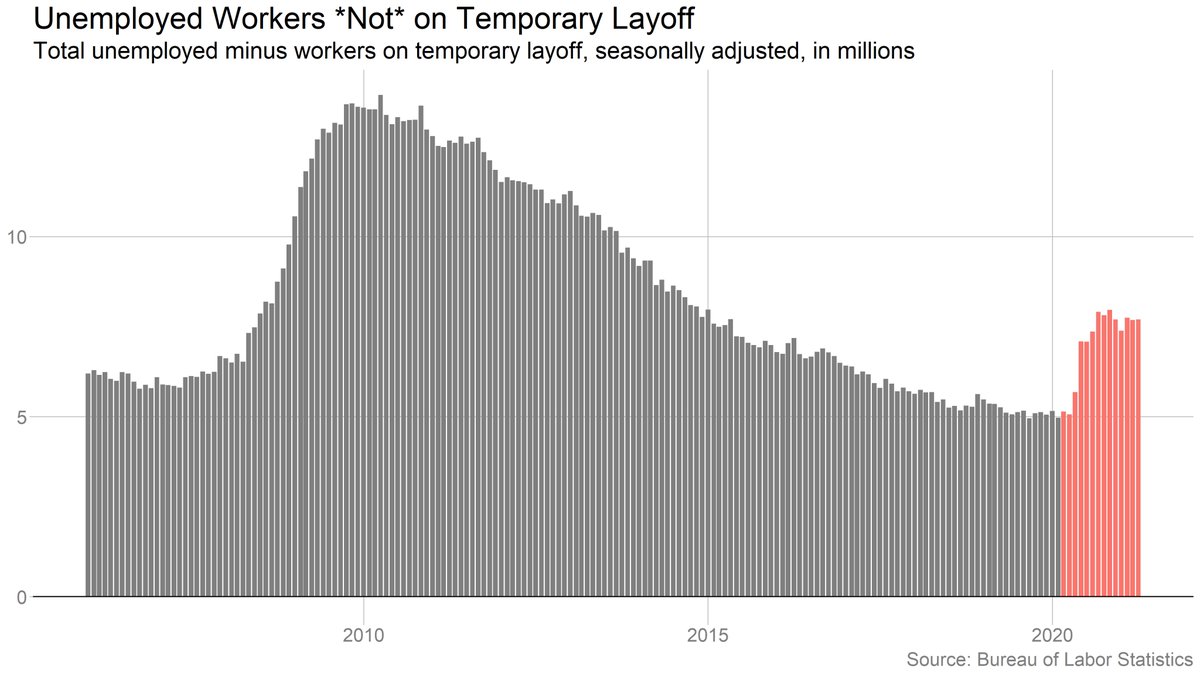
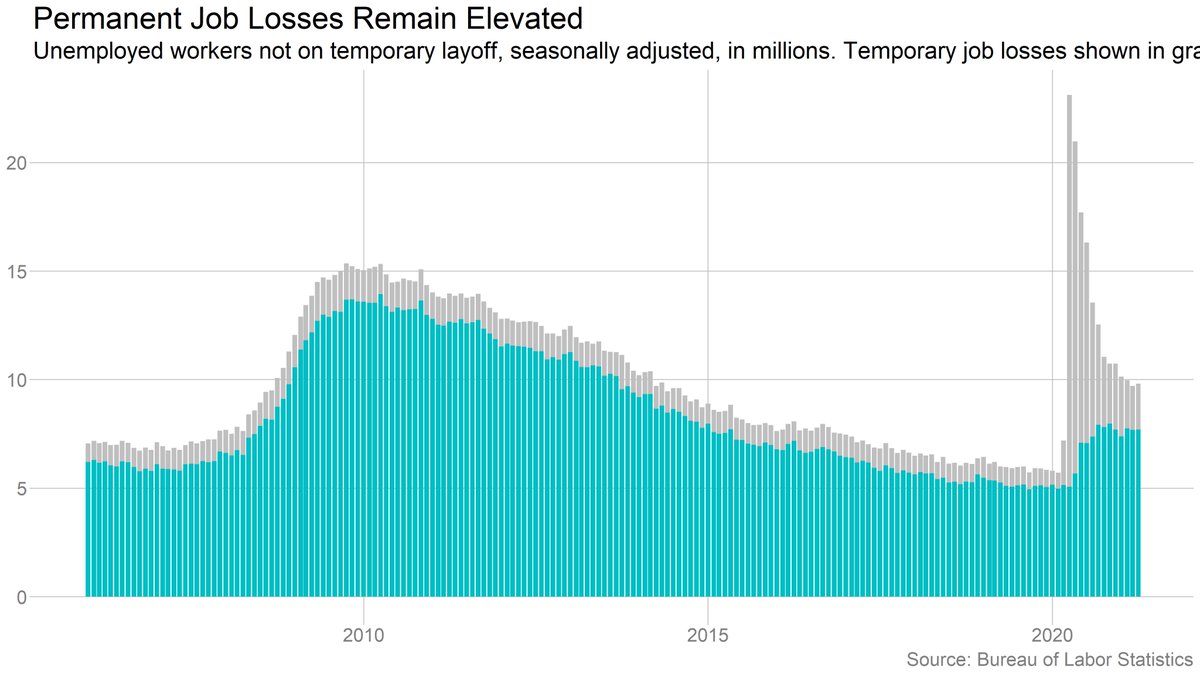
Number of people on permanent layoff (defined here as anyone who's unemployed and NOT on temporary layoff) was basically flat last month. Result is that total unemployment was more or less stagnant.
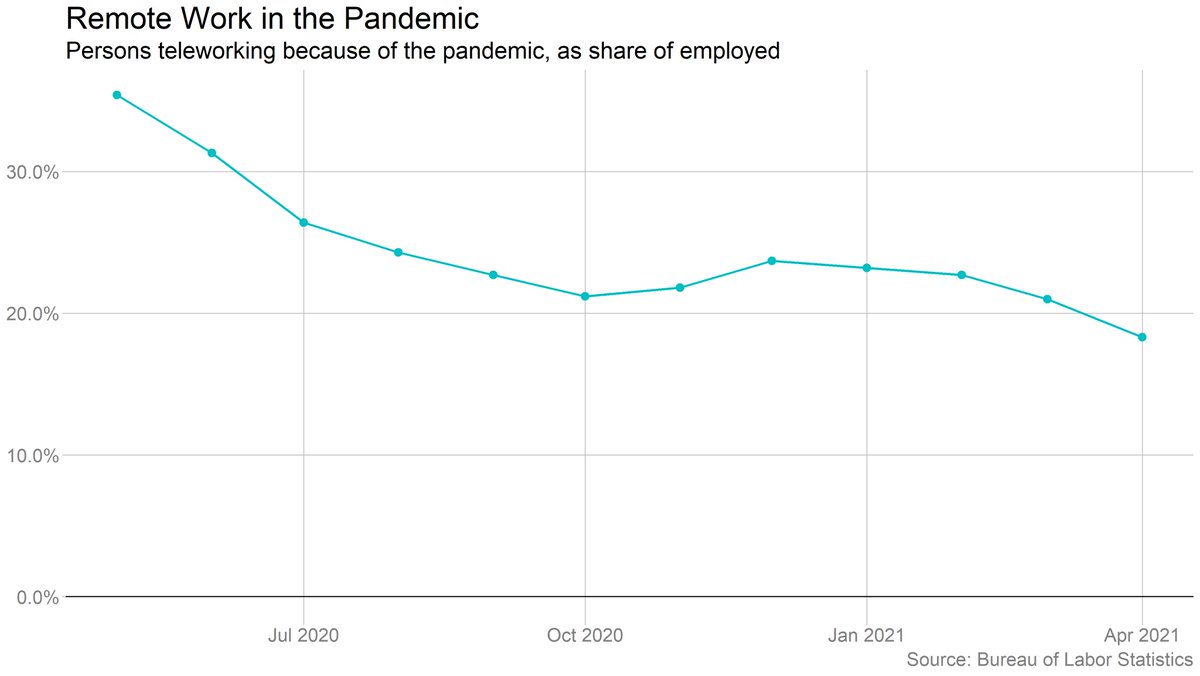
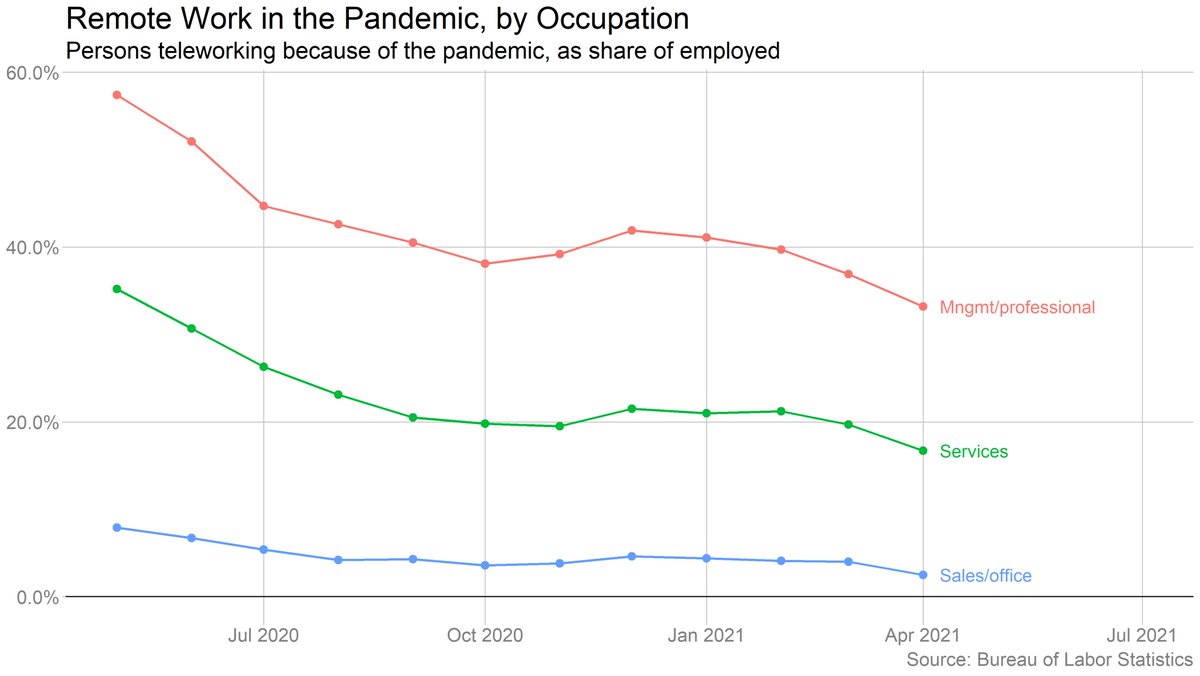
The share of people working from home due to the pandemic fell below 20% in April for the first time. Down to a third of management/professional workers, from over half last spring. Many people, of course, were *never* able to work from home.
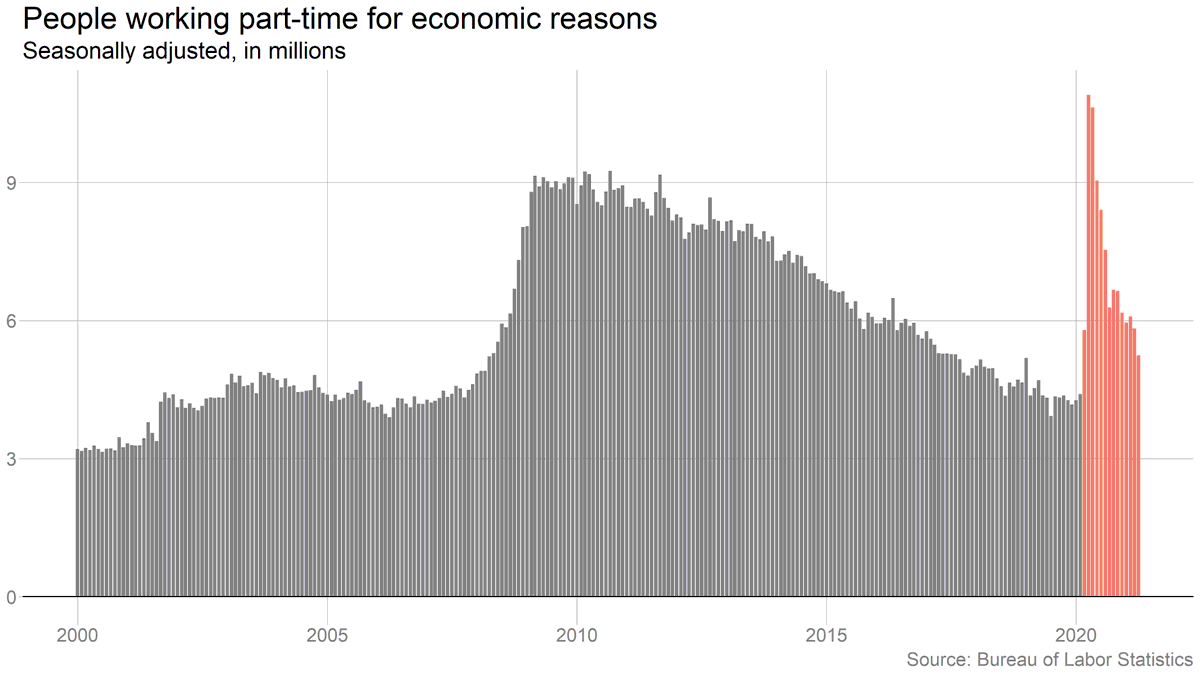
Big drop in involuntary part-time work, which is consistent with the story that employers are struggling to find enough help. But no big increase in overall hours.
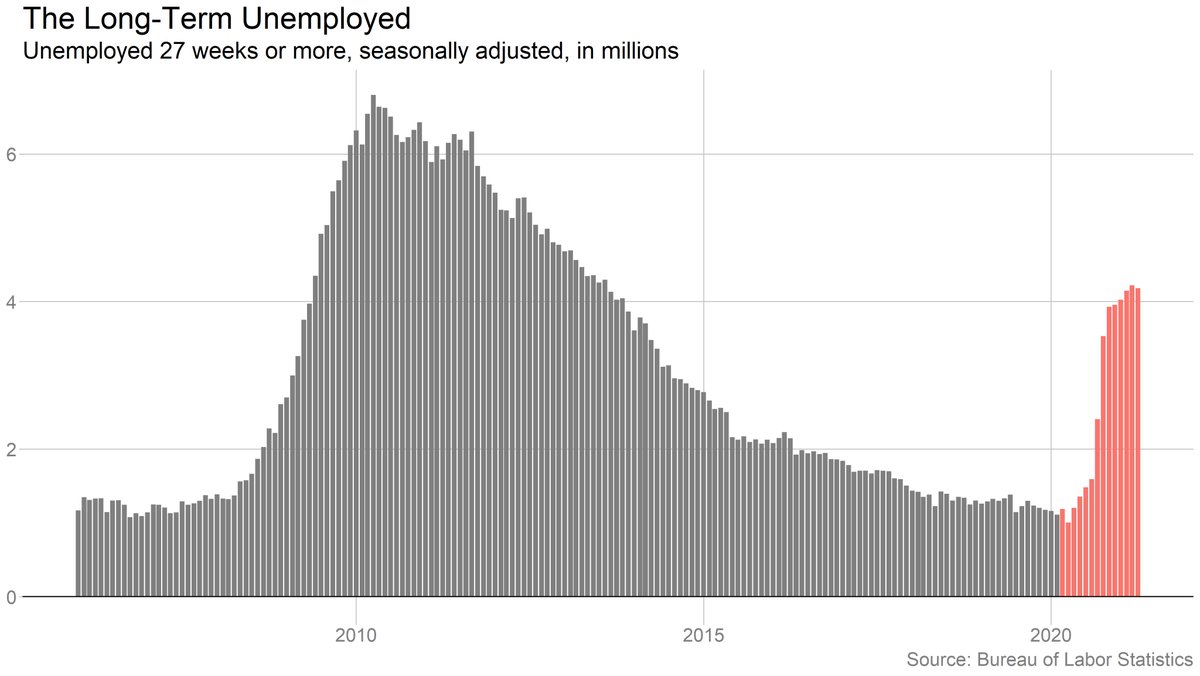
Long-term unemployment was basically flat (down slightly) last month. Still very high relative to pre-pandemic, but well below the last recession.

• • •

Missing some Tweet in this thread? You can try to force a refresh
 

Keep Current with Ben Casselman

Ben Casselman Profile picture

Stay in touch and get notified when new unrolls are available from this author!

Read all threads

This Thread may be Removed Anytime!

PDF

Twitter may remove this content at anytime! Save it as PDF for later use!

Try unrolling a thread yourself!

how to unroll video
  1. Follow @ThreadReaderApp to mention us!

  2. From a Twitter thread mention us with a keyword "unroll"
@threadreaderapp unroll

Practice here first or read more on our help page!

More from @bencasselman

Jul 11
Good news on inflation! U.S. consumer prices FELL 0.1 percent in June, and were up just 3 percent from a year earlier. "Core" prices, stripping out volatile food and fuel, were up 0.1 percent from May and 3.3 percent from last June. Data: …Live coverage: bls.gov/news.release/c…
nytimes.com/live/2024/07/1…
This is the second straight month where there has been effectively no inflation on a month-to-month basis. Prices were flat in May, and down in June.
If you take a longer view here: At 3% year-over-year, inflation is no longer outside historical norms (though it is still higher than immediately prepandemic). And over the past three months, rents have risen at an annual rate of ***just 1.1%.***
Image
Image
Read 7 tweets
Jul 2
Job openings ticked up in May (but only because April was revised down). Layoffs edged up. Quits basically flat. All consistent with a gradually slowing, but not collapsing, job market. #JOLTS
Full data: bls.gov/news.release/j…
There were 8.1 million job openings on the last day of May. That's up from 7.9 million in April, revised down from the 8.1m originally reported.
Larger story here is that openings are clearly falling quickly, even if they're still high in absolute terms. #JOLTS Image
There were 1.2 job openings for every unemployed worker in May. That's more or less where things stood immediately before the pandemic (when the labor market was widely viewed as strong but not overheated). Image
Read 7 tweets
Jan 25
The U.S. economy slowed in the final three months of the year, but only because the Q3 number was so strong -- the 3.3% growth rate in Q4 was well above expectations and certainly offered no hints of a brewing recession. (Belated charts thread)
Image
This is not a case where the volatile components of G.D.P. made a weak quarter look strong, as sometimes happens. Measures of underlying demand were also very strong.
Image
Image
For all the predictions of a recession, G.D.P. growth actually *accelerated* in 2023, and topped the prepandemic average growth rate as well. Image
Read 4 tweets
Jan 3
Job openings, quits and layoffs all edged down slightly in November. Consistent with a gradually cooling labor market, but definitely no sign things are falling off a cliff. #JOLTS
Data: bls.gov/news.release/j…
There were 8.8 million job openings on the last day of November. That's down a touch from October, but only because October was revised up. Big picture: Openings are trending down (and quite quickly, at that), but are still high by historical standards. #JOLTS Image
The number of job openings per unemployed worker actually ticked up in November (because unemployment fell), but ignore the noise. The labor market is becoming more balanced, though the ratio is (again) high relative to the prepandemic period. Image
Read 9 tweets
Sep 1, 2023
The U.S. economy added 187,000 jobs in August and the unemployment rate rose to 3.8%.
Data:
Full coverage: bls.gov/news.release/e…
nytimes.com/live/2023/09/0…
June/July revised down by combined 110,000 jobs.
The big increase in unemployment is mostly for "good" reasons: More people working, but also more people *looking* for work. Labor force grew by 736,000. Participation rate up by 0.2 percentage points.
Read 13 tweets
Jul 7, 2023
The U.S. economy added 209k jobs in June and the unemployment rate edged back down to 3.6%.
#jobsday
Data:
Full coverage: https://t.co/JfXzKGVrCqbls.gov/news.release/e…
nytimes.com/live/2023/07/0…
Modest downward revisions to both April and May, by a combined 110k jobs.
Average earnings rose by 12 cents an hour, or 0.4 percent. Earnings are up 4.4 percent from a year ago.
Read 13 tweets

Did Thread Reader help you today?

Support us! We are indie developers!


This site is made by just two indie developers on a laptop doing marketing, support and development! Read more about the story.

Become a Premium Member ($3/month or $30/year) and get exclusive features!

Become Premium

Don't want to be a Premium member but still want to support us?

Make a small donation by buying us coffee ($5) or help with server cost ($10)

Donate via Paypal

Or Donate anonymously using crypto!

Ethereum

0xfe58350B80634f60Fa6Dc149a72b4DFbc17D341E copy

Bitcoin

3ATGMxNzCUFzxpMCHL5sWSt4DVtS8UqXpi copy

Thank you for your support!

Follow Us!

:(