Did the J&J pause reduce demand for vaccinations, as some have asserted? (cough @NateSilver538 cough)

Our latest COVIDstates.org report evaluates this question, based on a large (20k) survey we had in the field the entire month of April. Image
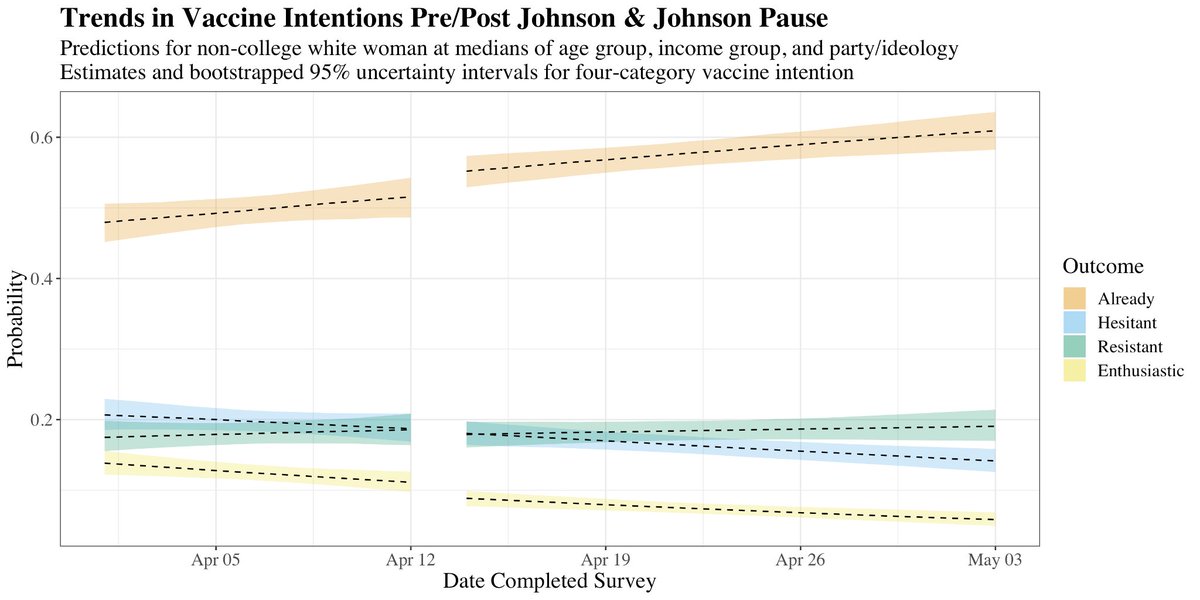
The scale of the survey, and the rapid change of vax sentiment/status through April give us a pretty good look at dynamics down to the daily granularity. & the pretty clear answer, despite very high awareness, is that the impact of the pause on vax demand was: BUBKES.
What we see is a steady increase in the number of vaccinated people, & a steady decrease in vaccine enthusiastic and hesitant individuals. Vax resistance is quite steady.
So: J&J did present a short term supply shock, likely modestly slowing vax rates for a week or two? But the peak shots/day was always going to be in April, as we exhausted the easy to vaccinate enthusiasts.
This does not speak to other possible downsides of the pause (e.g., has J&J vaccine been undermined in the US & elsewhere?); nor upsides (has this enhanced trust of the regulatory/safety process?). But: there is no evidence that the pause caused a drop in demand.

• • •

Missing some Tweet in this thread? You can try to force a refresh
 

Keep Current with David Lazer

David Lazer Profile picture

Stay in touch and get notified when new unrolls are available from this author!

Read all threads

This Thread may be Removed Anytime!

PDF

Twitter may remove this content at anytime! Save it as PDF for later use!

Try unrolling a thread yourself!

how to unroll video
  1. Follow @ThreadReaderApp to mention us!

  2. From a Twitter thread mention us with a keyword "unroll"
@threadreaderapp unroll

Practice here first or read more on our help page!

More from @davidlazer

1 May
What impact did the J&J pause have on vaccine attitudes? See COVIDstates.org latest report. The pause happened just as we were in the field, so we were well positioned to evaluate. A few key take aways:
1) There is no evidence of significant changes in vaccine enthusiasm before/during pause/after pause.
2) If we zoom in on a small panel of unvaccinated respondents from right before to right after, we can see the shift of vaccine enthusiasts and mildly hesitant individuals to vaccinated. (For interactive version of this graphic, go to: public.flourish.studio/visualisation/…)
Read 8 tweets
19 Feb
See our latest COVID states report, this time looking at vaccination issues wrt health care workers.

Bottom line:

There are major issues re who is getting vaccinated, in terms of gender, race, status.

& looming problems wrt vaccine resistance

covidstates.org 1/14
First, simple thing to note: the attitudes of health care workers re vaccination are pretty close to the general population, except for the fact that they have had access to vaccines earlier than other folks.

So, they provide an indicator for how things might go more generally. Image
So, how has it gone?

Not great, in terms of equity.

(1) Gender: Men are twice as likely to report getting vaccinated than women, & half as likely to be vaccine resistant. 3/14 Image
Read 14 tweets
29 Jan
See our latest report, (survey) experiments with vaccine messaging. In first experiment, we varied the messenger-the question, what impact did this have on vaccine resistance? Treatment effects below (higher = more vaccine resistance).1/7
COVIDstates.org Image
Take away: lots of potential for a backfire here. Celebrities and athletes have null effects, and anyone with a political hue risks driving away anti-partisans more than they persuade same partisans. (See this figure for partisan breakdowns). 2/7 Image
Fauci is an illuminating case, because he has become a partisan figure, and evoking him makes Democrats a bit less resistant, but Republicans and Independents substantially more resistant, with a net effect of increasing resistance. 3/7
Read 7 tweets
11 Aug 20
What is the relationship between the pandemic and the protests? Check out our latest 50 state survey examining the relationship between the size of the protests and the pandemic.

covidstates.org

A few key take aways (1/n):
(1) The protests were BIG: about 5% of respondents participated in the protests, & even in the states with the fewest protesters, about 2% of adults reported participating. Truly historic in terms of scale and geographic scope (2/n)
(2) The protests, unsurprisingly, heavily tilted young, with a remarkable ~10% of people in their 20s participating, and ~1% of people older than 60. 8.5% of African Americans, 6.3% of Hispanics, and 4.0% of whites and Asian Americans participated (3/n)
Read 6 tweets
24 Jan 19
Happy to announce our paper, just out this minute in @sciencemagazine, which examines the prevalence of Fake News on Twitter during the 2016 election
w/ @grinbergnir @Ldfriedl @_kenny_joseph @Briony_Swire science.sciencemag.org/content/363/64…
1/N
Some of our key findings:

(1) Fake news was moderately prevalent during the election. About 5% of election related content people were exposed to was fake news.
2/N
(2) Exposure was highly concentrated among a few people. The large majority of the fake news content was in the feeds of 1% of our sample.
3/N
Read 8 tweets

Did Thread Reader help you today?

Support us! We are indie developers!


This site is made by just two indie developers on a laptop doing marketing, support and development! Read more about the story.

Become a Premium Member ($3/month or $30/year) and get exclusive features!

Become Premium

Too expensive? Make a small donation by buying us coffee ($5) or help with server cost ($10)

Donate via Paypal Become our Patreon

Thank you for your support!

Follow Us on Twitter!

:(