Today's COVID vaccination update*:
- Total shots given: 15,652,046
- Shots per 100 people: 41.2
- Shots reported today: 326,863
- Inventory: 8.8 days (at avg pace)
- Adults w/ 1+ Shots: 45.7%
Source: covid19tracker.ca/vaccinationtra…
* Weekend updates are incomplete
- Total shots given: 15,652,046
- Shots per 100 people: 41.2
- Shots reported today: 326,863
- Inventory: 8.8 days (at avg pace)
- Adults w/ 1+ Shots: 45.7%
Source: covid19tracker.ca/vaccinationtra…
* Weekend updates are incomplete
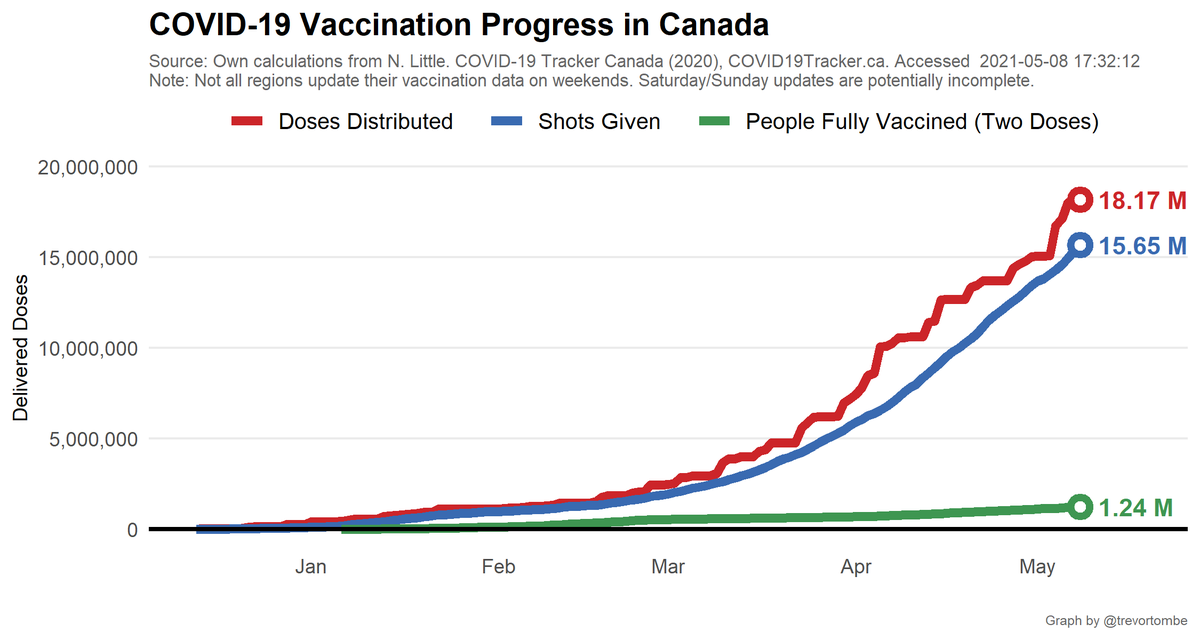
Canada is now up to 15.7 million shots given -- which is 86.2% of the total 18.2 million doses available. Over the past 7 days, 3,133,160 doses have been delivered to provinces.
And so far 1.2 million are fully vaccinated with two shots.
And so far 1.2 million are fully vaccinated with two shots.
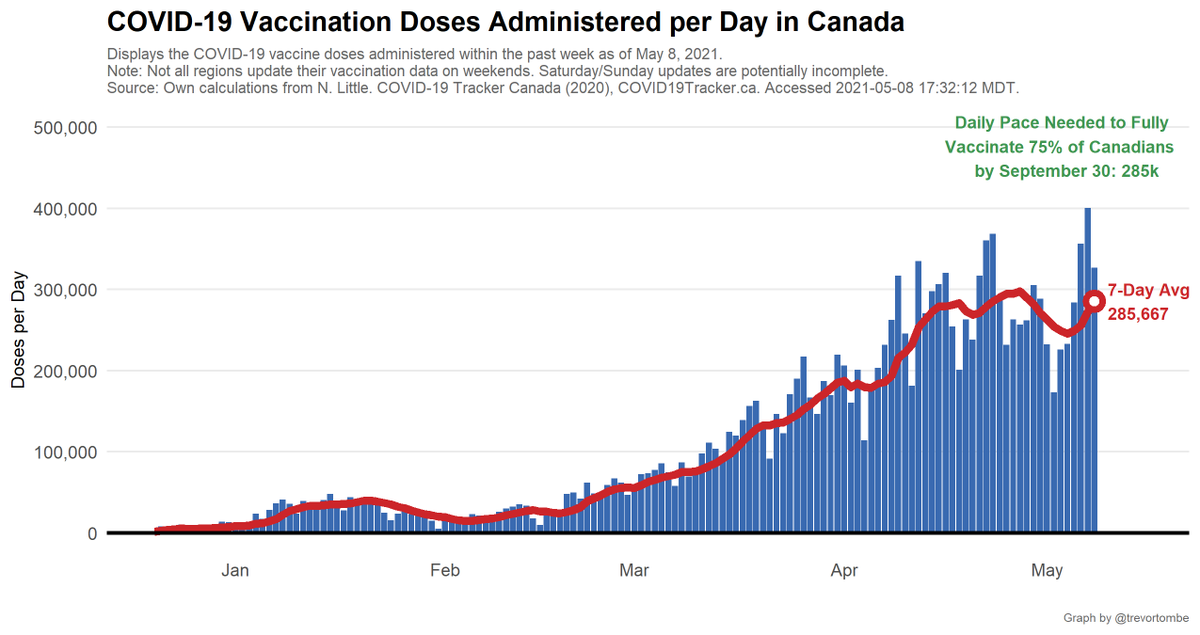
Canada's pace of vaccination:
Today's 326,863 shots given compares to an average of 285,667/day over the past week and 262,739/day the week prior.
- Pace req'd for 2 doses to 75% of Canadians by Sept 30: 285,241
- At current avg pace, we reach 75% by Sep 29
Today's 326,863 shots given compares to an average of 285,667/day over the past week and 262,739/day the week prior.
- Pace req'd for 2 doses to 75% of Canadians by Sept 30: 285,241
- At current avg pace, we reach 75% by Sep 29
Based on the share of people with 1 or more doses (a weaker threshold), at Canada's current pace we reach 50% by May 25 and 75% by June 29. We reach 75% of *adults only* (age 16+) by June 11.
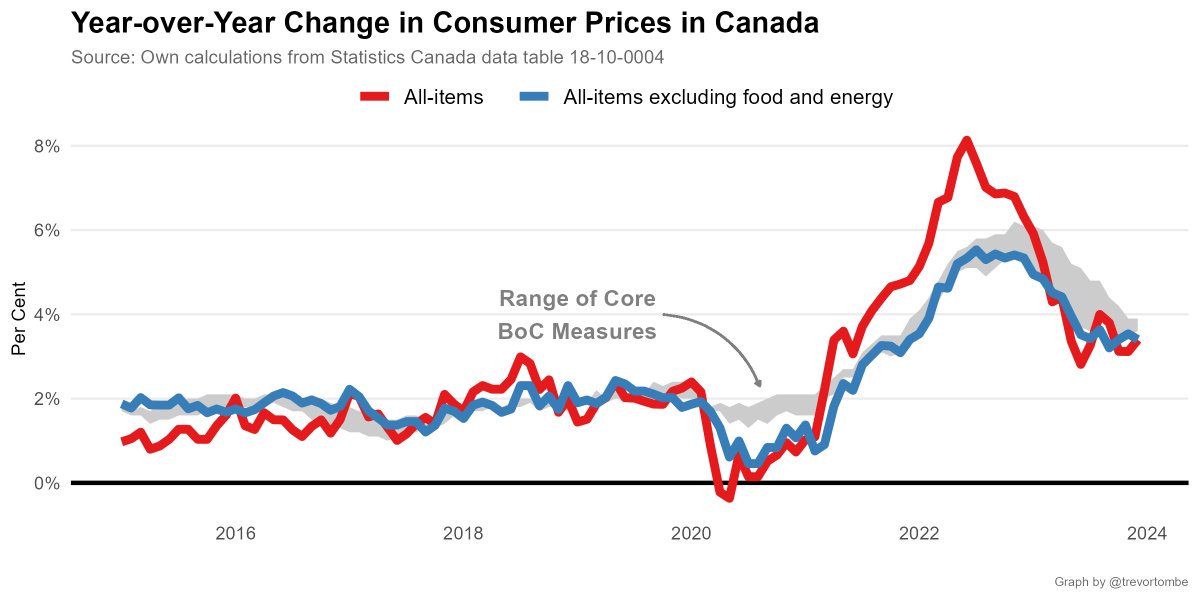
Gray lines are past projections. This illustrates the extent of recent changes.
Gray lines are past projections. This illustrates the extent of recent changes.

Recent modeling suggests health rules may be safely eased once 75% of adults have at least one dose and 20% have two canada.ca/content/dam/ph…
This requires ~30M shots. We're on pace for that by June 27.
But deliveries are accelerating. If shots keep up, could be mid-June
This requires ~30M shots. We're on pace for that by June 27.
But deliveries are accelerating. If shots keep up, could be mid-June

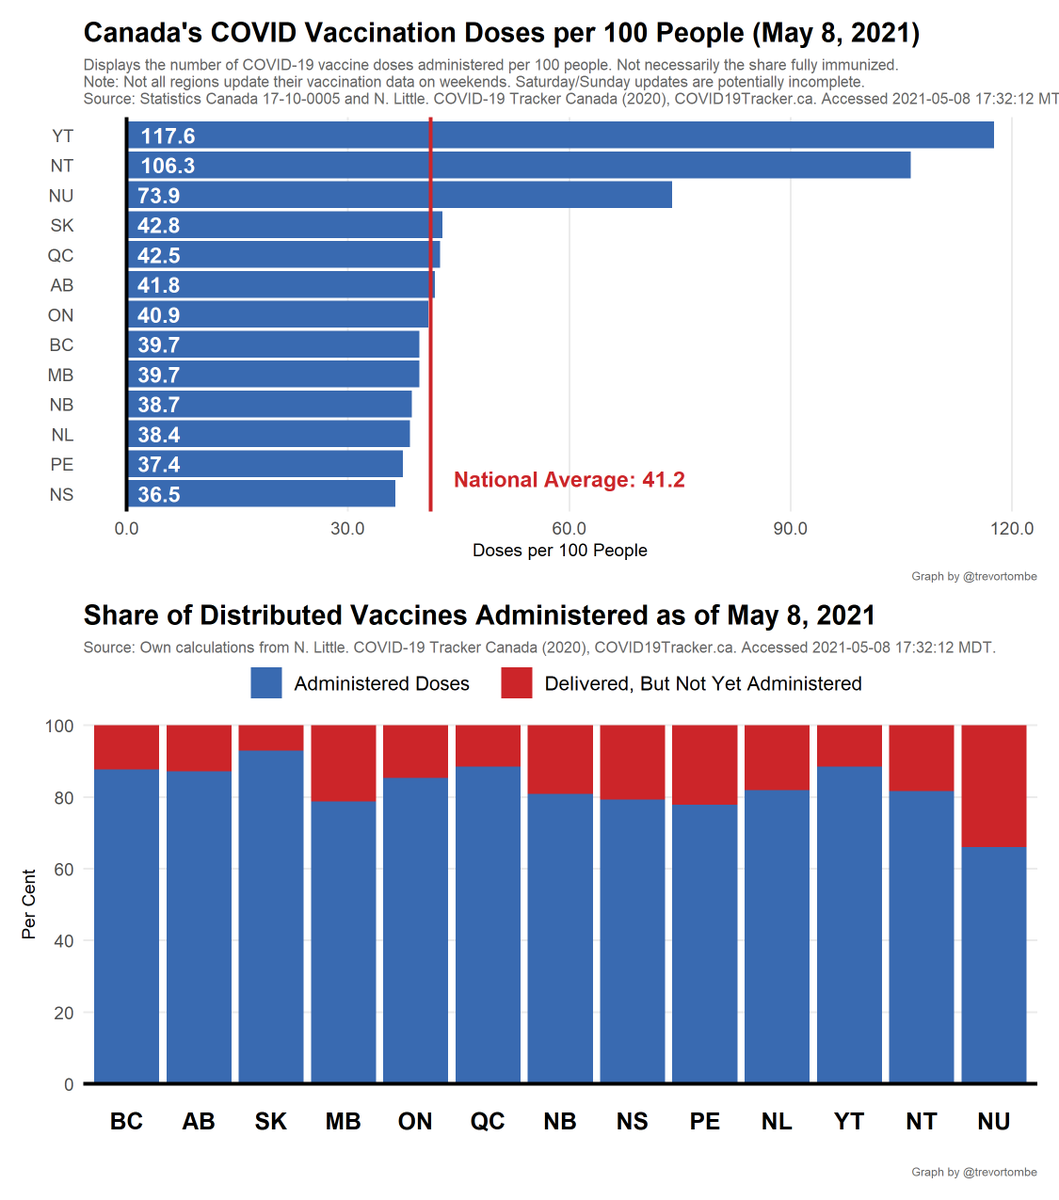
Turning to individual provinces, here's total shots given and share of delivered doses used.
- Most shots given: YT at 118 doses per 100 people
- Fewest: NS at 36
- Highest share of delivered doses used: SK with 93%
- Lowest: NU with 66%
- Most shots given: YT at 118 doses per 100 people
- Fewest: NS at 36
- Highest share of delivered doses used: SK with 93%
- Lowest: NU with 66%
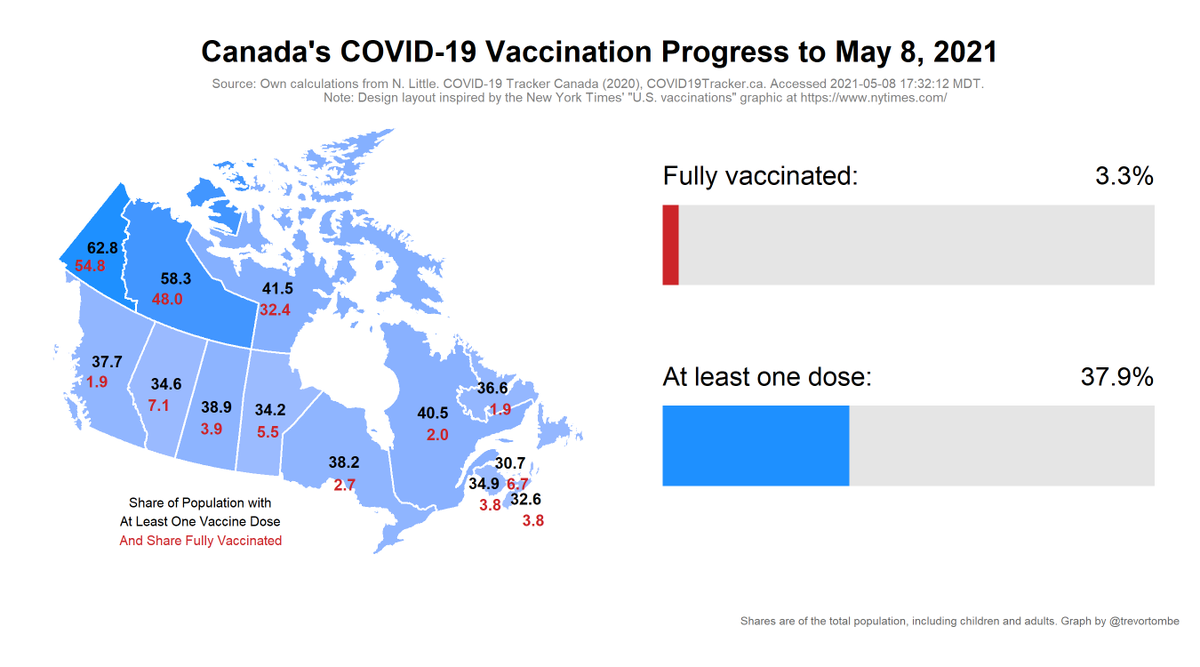
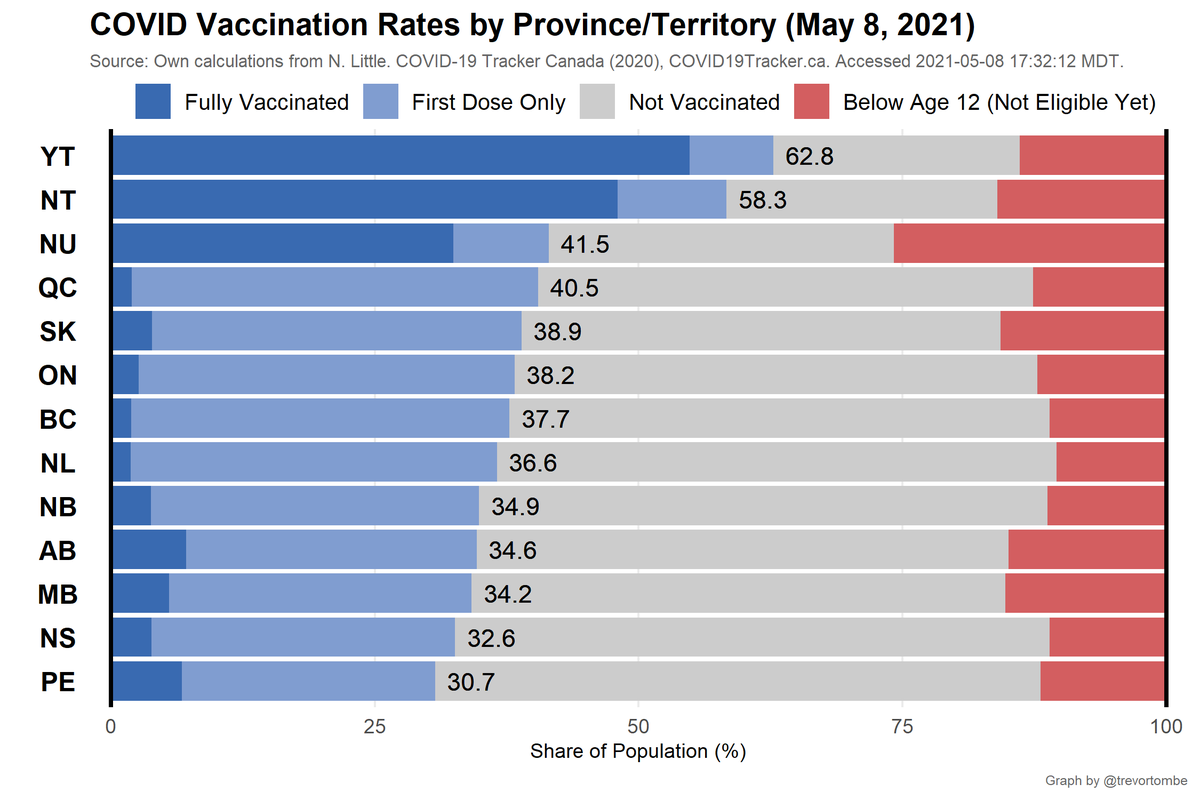
A more detailed look at provs/terrs:
- Highest overall: YT at 63% receiving at least one shot
- Most 1st doses only: QC at 39% receiving that shot
- Most Fully Vaccinated: YT at 55%
- Fewest Vaccinated: PE at 31%
- Highest overall: YT at 63% receiving at least one shot
- Most 1st doses only: QC at 39% receiving that shot
- Most Fully Vaccinated: YT at 55%
- Fewest Vaccinated: PE at 31%
How does Canada compare to others? Currently, Canada ranks 7th out of 37 OECD countries in terms of the share of the population that is at least partially vaccinated. In terms of total doses per 100, Canada is 8th.
Source: ourworldindata.org/covid-vaccinat…
Source: ourworldindata.org/covid-vaccinat…

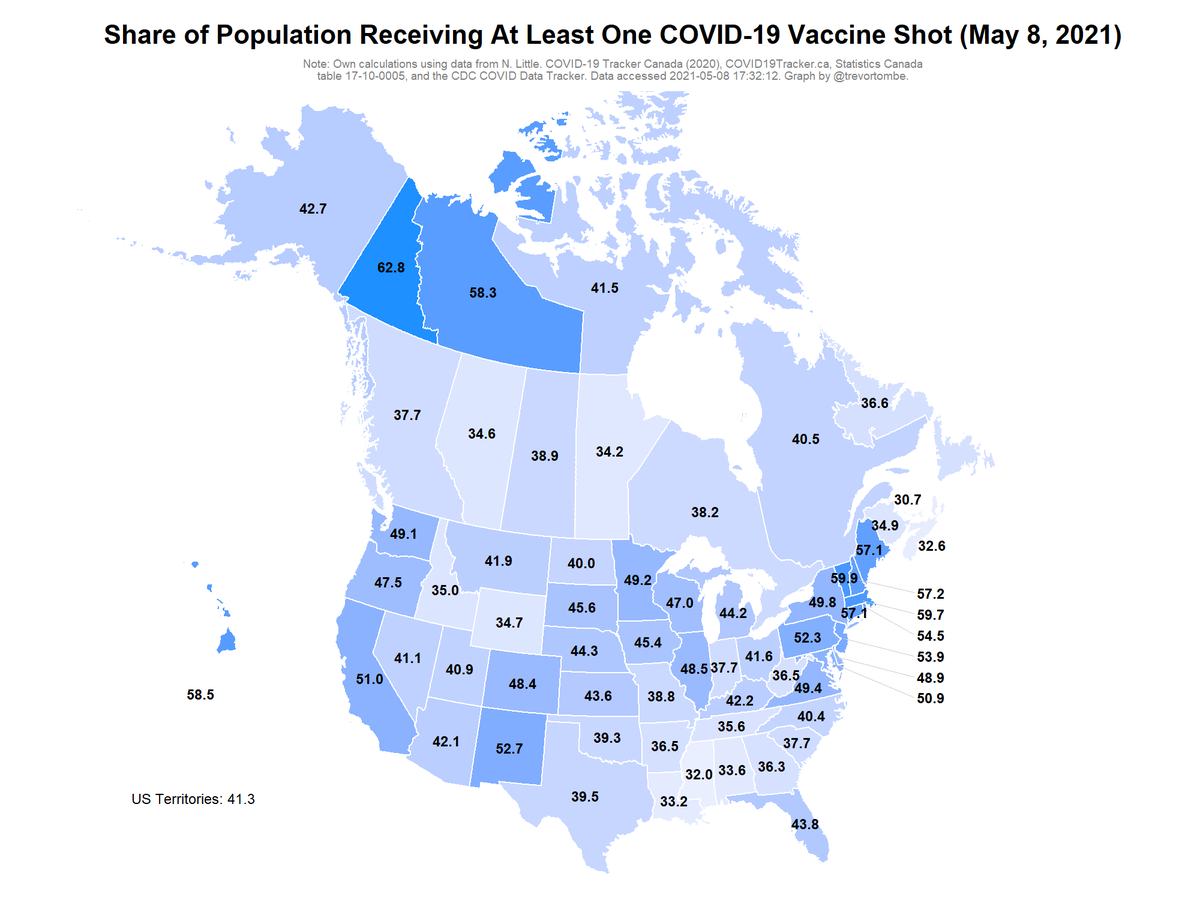
Canada/US comparison:
- Highest Prov: QC, 40.5% of pop w/ at least one dose
- Lowest Prov: PE, 30.7
- Highest State: VT, 59.9
- Lowest State: MS, 32.0
- Top CDN Terr: YT, 62.8
- Top US Terr: PW, 72.4
Sources: covid.cdc.gov/covid-data-tra… and covid19tracker.ca/vaccinationtra…
- Highest Prov: QC, 40.5% of pop w/ at least one dose
- Lowest Prov: PE, 30.7
- Highest State: VT, 59.9
- Lowest State: MS, 32.0
- Top CDN Terr: YT, 62.8
- Top US Terr: PW, 72.4
Sources: covid.cdc.gov/covid-data-tra… and covid19tracker.ca/vaccinationtra…
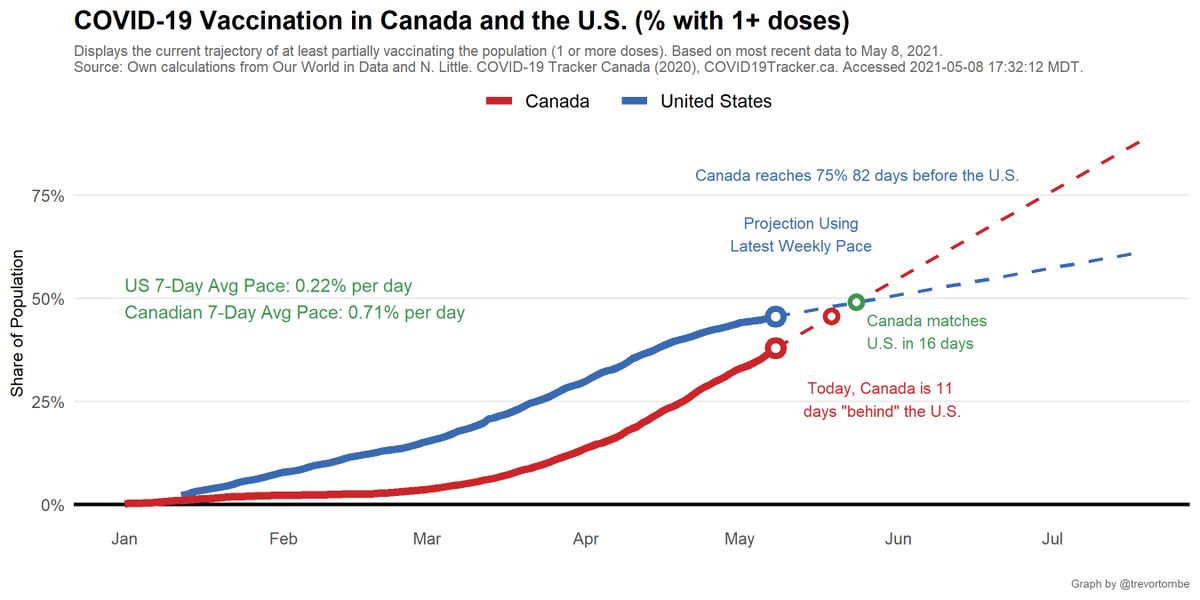
At Canada's latest 7-day avg daily pace, the share of people w/ 1 or more doses rises by 0.71% per day. The US rises by 0.22% per day.
- Projected out, we reach 75% 82 days before the US.
- We match the US share in 16 days.
- Reaching the current US share takes 11 days.
- Projected out, we reach 75% 82 days before the US.
- We match the US share in 16 days.
- Reaching the current US share takes 11 days.
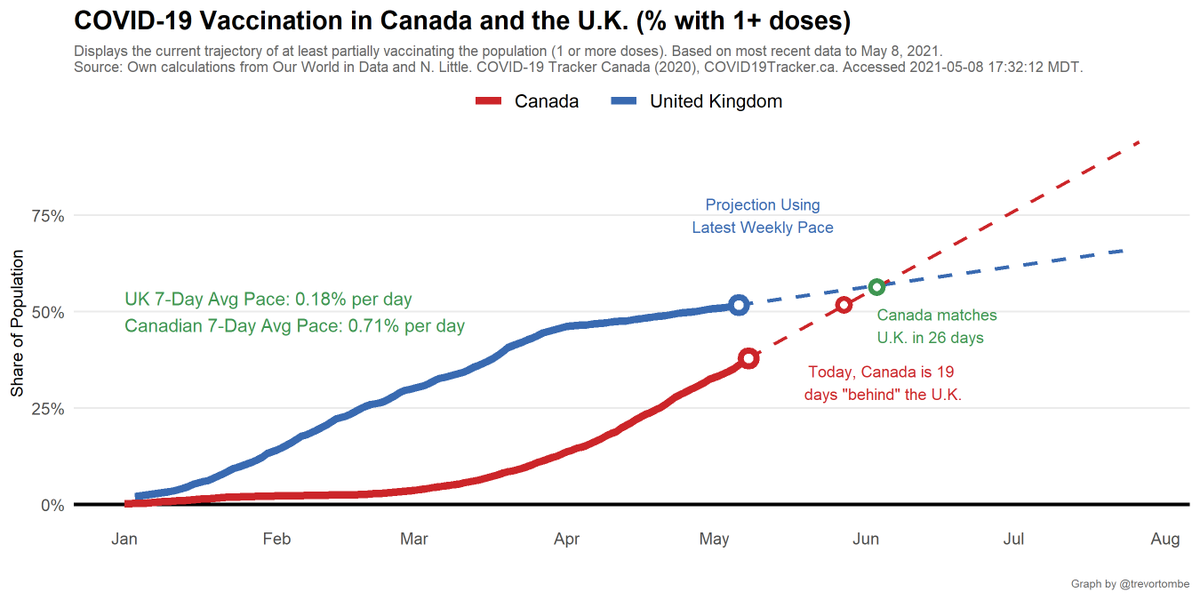
And by request, here's a comparison to the UK! They rise by 0.18% per day.
- Projected out, we reach 75% 77 days before the UK.
- We match the UK share in 26 days.
- Reaching the current UK share takes 19 days.
- Projected out, we reach 75% 77 days before the UK.
- We match the UK share in 26 days.
- Reaching the current UK share takes 19 days.
But that's 1+ doses, here's a comparison of daily shots given per 100 people. In Canada, this rises by 0.75 per day. The US rises by 0.60 per day.
- Projected out, we reach 100 doses 41 days after the US.
- Reaching the current US rate takes 48 days.
- Projected out, we reach 100 doses 41 days after the US.
- Reaching the current US rate takes 48 days.

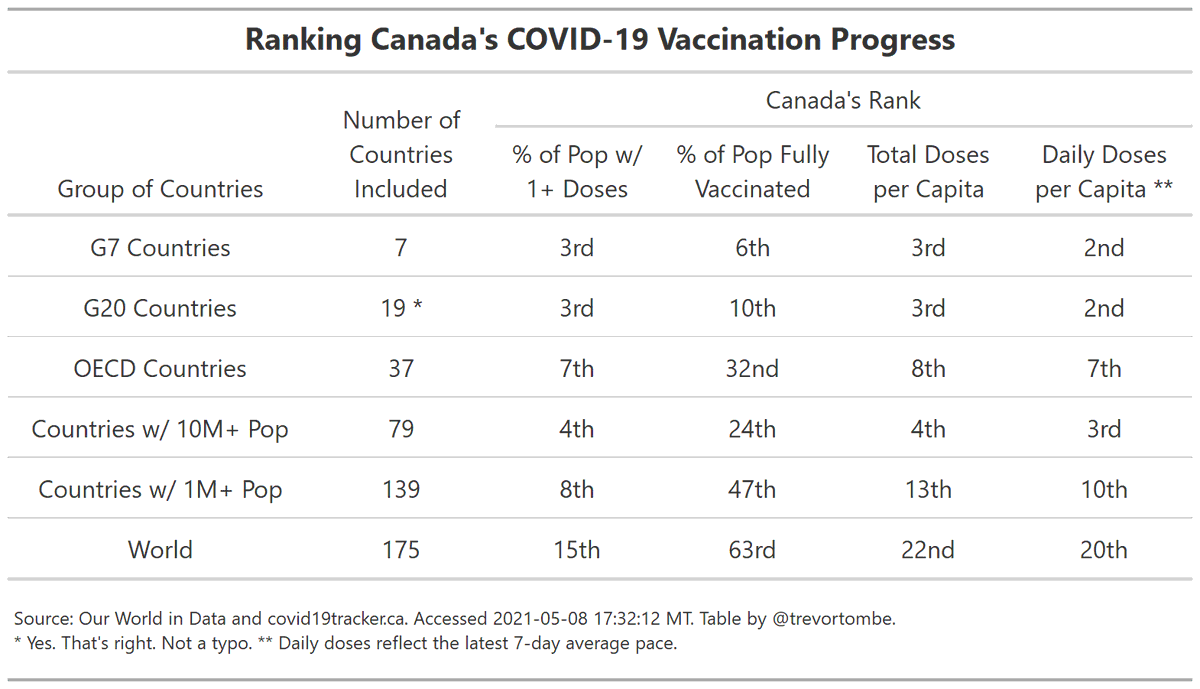
Finally, here's a selection across several metrics/groups of how Canada ranks globally. Pick your preferred measure!
Fin.
Note: all graphs (and more!) are automatically updated and posted online for later review and easy sharing at the following site: trevortombe.github.io/covidgraphs/
Note: all graphs (and more!) are automatically updated and posted online for later review and easy sharing at the following site: trevortombe.github.io/covidgraphs/
• • •
Missing some Tweet in this thread? You can try to
force a refresh