Do wealthier households save a larger share of their incomes than poorer ones?
I suspect most people's prior is that the answer is "yes." Turns out that's incorrect, or rather: things are considerably more subtle, at least in our Norwegian wealth tax registry data.
A short 🧵:
I suspect most people's prior is that the answer is "yes." Turns out that's incorrect, or rather: things are considerably more subtle, at least in our Norwegian wealth tax registry data.
A short 🧵:
The 🧵 is based on a major revision of "Saving Behavior Across the Wealth Distribution: The Importance of Capital Gains", which is joint with @AndreasFagereng @BlomhoffHolm & @GNatvik
benjaminmoll.com/SBWD/
1/
benjaminmoll.com/SBWD/
1/

Why do saving rates matter? Answer: for (i) secular trends in income & wealth inequality and (ii) how such distributional shifts feed back to macro aggregates
See eg great work by @M_De_Nardi @ludwigstraub @AtifRMian @profsufi @ProfGreenwald @SVNieuwerburgh @HannoLustig
2/
See eg great work by @M_De_Nardi @ludwigstraub @AtifRMian @profsufi @ProfGreenwald @SVNieuwerburgh @HannoLustig
2/

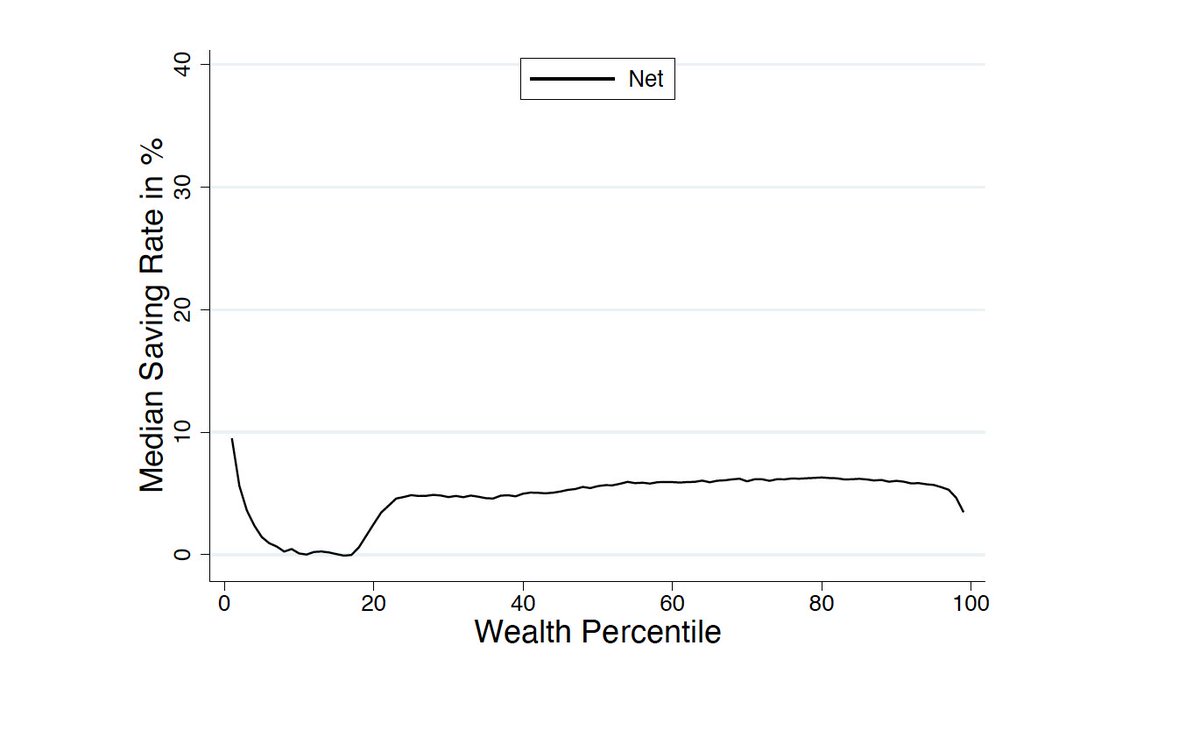
What do we find?
If we measure saving net of capital gains, i.e. "net" or "active saving", then saving rates are flat across the wealth distribution, i.e., the rich do *not* actively save a larger share of their incomes than the poor.
3/
If we measure saving net of capital gains, i.e. "net" or "active saving", then saving rates are flat across the wealth distribution, i.e., the rich do *not* actively save a larger share of their incomes than the poor.
3/

At the same time, saving rates *including capital gains* increase strongly with wealth.
Why? Wealthier households own assets that experience capital gains which they hold onto instead of selling them off to consume.
4/
Why? Wealthier households own assets that experience capital gains which they hold onto instead of selling them off to consume.
4/

Also here's what saving rates look like in different years 2005-2015: in all years "net or active" saving rates are flat & vary little, while saving rates incl capital gains fluctuate lots depending on asset markets (e.g. it's way down in 2008, also note the different scales)
5/
5/

Aside: the flat active saving rates are v different from what Saez & @gabriel_zucman found using "synthetic" saving rates. Instead our results are more in line with Smith @omzidar Zwick's attenuated saving rate disparities and more important role for asset price changes.
6/
6/

What's going on?
We show that our findings are actually consistent with completely standard models of wealth accumulation with homothetic preferences under one additional assumption: rising asset prices are accompanied by declining asset returns rather than rising cashflows.
7/
We show that our findings are actually consistent with completely standard models of wealth accumulation with homothetic preferences under one additional assumption: rising asset prices are accompanied by declining asset returns rather than rising cashflows.
7/

Intuitively, when asset prices rise even though cashflows do not, richer households do not experience a larger income effect than poorer ones and therefore consume approximately the same fraction of their disposable incomes. See Proposition 1.
8/
8/


Part of the booming asset prices of recent years are due to falling interest/discount rates. That this probably matters for wealth distribution is also catching on -- see the great work of @ProfGreenwald @HannoLustig @SVNieuwerburgh, Gomez & Gouin-B
9/
https://twitter.com/HannoLustig/status/1367503436816777219
9/
What does it all mean?
We do some counterfactuals to flesh out the implications. We conclude that saving rate heterogeneity across wealth groups is not likely to be an important contributor to changes in aggregate saving and the wealth distribution, but capital gains are.
10/
We do some counterfactuals to flesh out the implications. We conclude that saving rate heterogeneity across wealth groups is not likely to be an important contributor to changes in aggregate saving and the wealth distribution, but capital gains are.
10/

Now a final important point: some of you may now think "oh, in that case these capital gains and the accompanying changes in wealth distribution are just welfare-irrelevant paper gains."
Absolutely not! See Section 5.2 in the paper and
11/
Absolutely not! See Section 5.2 in the paper and
https://twitter.com/ben_moll/status/1277900052439216130
11/
Takeaway same as here: the macro, wealth inequality and PF literatures need to consider changing asset prices with more care. Fortunately this has started to happen, see e.g. the great work of @cmtneztt, @kuhnmo @schularick & Steins
12/
https://twitter.com/ben_moll/status/1353774004469964800
12/
Oh and we've put together a whole seminar series dedicated to these types of topics: micro-macro-household-finance.co.uk 🙂
13/13
13/13
p.s. given some comments, let me add an important clarification: our graphs have *wealth* on the x-axis as opposed to *income*.
Saving rates by income instead look like this (Fig 9c) so higher *income* hh's do in fact have higher net saving rates as intuition may suggest
14/
Saving rates by income instead look like this (Fig 9c) so higher *income* hh's do in fact have higher net saving rates as intuition may suggest
14/

That pattern for net saving rates by income is also qualitatively consistent with standard theory:
15/
15/

• • •
Missing some Tweet in this thread? You can try to
force a refresh