🐳 Quick guide on reading Flow Pie Charts
I took the last 10 lines from today's TSLA order flow and will recreate the pie charts based on the info we see. Hopefully it will help you understand how the information in the pie charts is calculated!
I took the last 10 lines from today's TSLA order flow and will recreate the pie charts based on the info we see. Hopefully it will help you understand how the information in the pie charts is calculated!

When you're on the flow and you click "Show Charts" you'll see 5 pie charts running across the bottom.
From left to right they are:
1. # Calls v Puts
2. Volume Calls v Puts
3. Premium Calls v Puts
4. Ask v Bid side
5. Bear/Bull flow
From left to right they are:
1. # Calls v Puts
2. Volume Calls v Puts
3. Premium Calls v Puts
4. Ask v Bid side
5. Bear/Bull flow
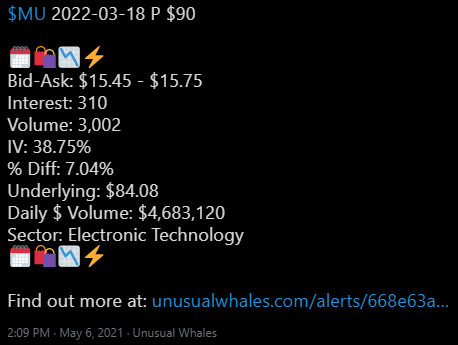
1. If we look through our 10 lines of Tesla data, we will see there are literally 5 calls and 5 puts. So our first chart will be 50/50 calls/puts.
2. Adding up call and put volume gives us 103 for calls (50+50+1+1+1) and 6 for puts (1+1+2+1+1).
2. Adding up call and put volume gives us 103 for calls (50+50+1+1+1) and 6 for puts (1+1+2+1+1).

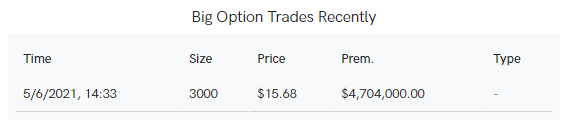
3. Next add up call and put premium. ~13220 call premium (6k+900+320+4k+2k) and ~6255 put premium (485+3k+130+2k+640).
4. Next, add up all the volume on orders that were BTO (buy to open) and compare them to orders that were STO. (50+1+1+1+2+1+1) vs (50+1+1).
4. Next, add up all the volume on orders that were BTO (buy to open) and compare them to orders that were STO. (50+1+1+1+2+1+1) vs (50+1+1).

5. Lastly the overall bull/bear flow pie chart is a function of the previous 4 results. Unsure of the exact formula, so unable to drop a visual. But a cursory look at our data would suggest a neutral flow. Sincerely hoping this helps. Please @ me with questions.
• • •
Missing some Tweet in this thread? You can try to
force a refresh