
I'm dedicating these 2 days to correlate BTC situation between now and 2017-2018. I'll hashtag #bullorbear based on what I find.
Up until now:
- The ideas vehiculated on groups like "it goes under ema X, MACD negativ don't work. Reason: you get negative MACD also in other phases (e.g. accumulation) and while it's happening you wouldn't know which phase you're in.
- The ideas vehiculated on groups like "it goes under ema X, MACD negativ don't work. Reason: you get negative MACD also in other phases (e.g. accumulation) and while it's happening you wouldn't know which phase you're in.
- EMAs: EMA 10 & 20 < EMA 50 happens now as it happened then, while the market was going bearish; when this happens in a sideways market it doesn't have any effect, when it happens in a bullish market it seems to go dumpy => +1 for bearish
- BTC World Volume (a multiexchange indicator that shows the total volume of BTC in exchanges) seems to be a fancy indicator that doesn't actually tell us anything (spikes on buys and sells)
(proof: tradingview.com/x/h8QVGDj5/ , sustained by multiple occurences)
(proof: tradingview.com/x/h8QVGDj5/ , sustained by multiple occurences)

- Volume wise the market doesn't push in any direction: tradingview.com/x/AALpjVYb/
back then: tradingview.com/x/c8NfT7Pd/
back then: tradingview.com/x/c8NfT7Pd/


This is the second part of my analysis that compares the current crypto market conditions to 2017-2018. Follow #bullorbear for the first and the next part.
TOTAL2 vs BTC 2017 tradingview.com/x/AR6zRPh5/
TOTAL2 followed BTCUSDT in 2017 all the way. The distance between BTC falling and TOTAL2 falling was 18 days (TOTAL2 is lagging by 18 days).
TOTAL2 followed BTCUSDT in 2017 all the way. The distance between BTC falling and TOTAL2 falling was 18 days (TOTAL2 is lagging by 18 days).

Theoretically money went into BTC and alts, then when BTC started falling there was a short sideways moment followed by another burst of growth of 111% in alts. Then money started leaving crypto.
BTC.D vs BTC 2017 tradingview.com/x/p7d7LRua/
Historically BTC had a growth during which BTC.D grew too, then money started flowing into alts too, then more into BTC and then, when BTC started falling (together with the dominance) money continued going into alts.
Historically BTC had a growth during which BTC.D grew too, then money started flowing into alts too, then more into BTC and then, when BTC started falling (together with the dominance) money continued going into alts.

Total period of money increasingly going into alts: 53 days (and 15 days from BTC crash).
Also, BTC.D fell through the crash of BTC.
Also, BTC.D fell through the crash of BTC.
BTC.D vs TOTAL2 2017 tradingview.com/x/4KatXjgL/
We can see that when BTC.D falls hard, altcoins grow exponentially. (Also BTC.D falling preceds a BTC crash there.)
We can see that when BTC.D falls hard, altcoins grow exponentially. (Also BTC.D falling preceds a BTC crash there.)

Dominance key levels:
- 50% and growing to 70% (7th of Dec) after which it falls hard.
- Alt season grows with dominance and past it.
- When under 50% altseason grows fast.
- At 39% money starts leaving alts, winter is coming.
- 50% and growing to 70% (7th of Dec) after which it falls hard.
- Alt season grows with dominance and past it.
- When under 50% altseason grows fast.
- At 39% money starts leaving alts, winter is coming.
TOTAL2 vs BTC 2021 tradingview.com/x/xgwDXGRv/
TOTAL2 followed BTCUSDT in 2021 up to 9th of March. BTC moved into a sideways trend while TOTAL2 continued moving up up and away. Basically a lot of money gets invested in alts.
TOTAL2 followed BTCUSDT in 2021 up to 9th of March. BTC moved into a sideways trend while TOTAL2 continued moving up up and away. Basically a lot of money gets invested in alts.

Will TOTAL2 lag if BTC falls? We don't know. What we can see is that TOTAL2 is more responsive to BTC behavior now so it might not lag when BTC drops.
In 2017 we had bullish Followed by bearish with TOTAL2 lagging behind. Now we have bullish followed by sideways with TOTAL2 in sync. If sideways is the new bearish, then we're in the accumulation phase and we might go up.
If sideways will be followed by bearish we're probably in the distribution and we might go down. Certainly, this pattern was not repeated in 2017.
BTC.D vs BTC 2021 tradingview.com/x/UYZagCPf/
We can see from the chart that BTC.D is dropping continuously while we're in an alt season. What we know from 2017 is that at 39% dominance money started leaving alts.
We can see from the chart that BTC.D is dropping continuously while we're in an alt season. What we know from 2017 is that at 39% dominance money started leaving alts.
We're not sure what will happen in 2021 because BTC is not actually crashing now, it is in a sideways trend, slowly sloping downward. Still, if we take the market sentiment into account, winter is coming but we don't know when.
Dominance key levels:
- 72% in 3rd of Jan (high)
- 50% on 29th of April
- 41% by 17th of May
- 72% in 3rd of Jan (high)
- 50% on 29th of April
- 41% by 17th of May

BTC.D vs TOTAL2 2021 tradingview.com/x/yVP69VKq/
What we instantly recognize from the image is that BTC.D falls continuously while alts grew. This happened since January.
Contrasted to 2017, BTC.D doesn't fall hard (and BTC is in a sideways market), everything appears calmer now.
What we instantly recognize from the image is that BTC.D falls continuously while alts grew. This happened since January.
Contrasted to 2017, BTC.D doesn't fall hard (and BTC is in a sideways market), everything appears calmer now.

So we might be in a stop towards a new spring (if everything continues as it is).
Things are not as they were in 2017. BTC went from an uptrend to a downtrend then. Now, with the sideways movement there's a new metaphor on the charts. What will it be?
Things are not as they were in 2017. BTC went from an uptrend to a downtrend then. Now, with the sideways movement there's a new metaphor on the charts. What will it be?
This is the third part of my analysis that compares the current crypto market conditions to 2017-2018. Follow #bullorbear for the full suite.
CryptoQuant 2017 BTC Inflow imgur.com/a/cdvQJE3
Regarding CryptoQuant exchange inflows/outflows the theory would be that inflows of BTC is a bearish sign.
Regarding CryptoQuant exchange inflows/outflows the theory would be that inflows of BTC is a bearish sign.
In 2017 (first picture), there's an inflow on BTC on the exchanges after the middle of the upward trend, 26 days before the downtrend and *NO* inflow during the downward trend. There's also an inflow at the bottom of the downward trend, 116 days before the upward trend.

CryptoQuant 2021 BTC Inflow
According to current data (2nd picture) there's a continuous inflow of BTC to the exchanges. But if we look at the recent history we can see this inflow is just 7% more than in December, and the BTC was in an uptrend during that time.
According to current data (2nd picture) there's a continuous inflow of BTC to the exchanges. But if we look at the recent history we can see this inflow is just 7% more than in December, and the BTC was in an uptrend during that time.

CryptoQuant alerts tradingview.com/x/gV5HZFdB/
I've also actively plotted CyptoQuant exchange outflows and inflows since Feb 2021 and there doesn't appear to be a direct correlation between the inflows/outflows and the uptrend/downtrend.
I've also actively plotted CyptoQuant exchange outflows and inflows since Feb 2021 and there doesn't appear to be a direct correlation between the inflows/outflows and the uptrend/downtrend.

Still not sure here as I'm not an expert on their charting tools and there's also an Ethereum ATH which might have been the reason for the recent inflows (but I didn't investigate this supposition further).
The BTC Dominance Cycle tradingview.com/chart/BTCUSD/p…
Let's take the cases and see what happens. In order to do this I've plotted TOTAL2 (basically ALTS) over BTCUSDT and compared them to BTC.D.
tradingview.com/x/30oHZzRO/
tradingview.com/x/2vxp304L/
tradingview.com/x/30oHZzRO/
tradingview.com/x/2vxp304L/


a) IF BTC.D increases & BTC increases => ALTS decreases
b) IF BTC.D increases & BTC decreases => ALTS decreases fast (dump)
1st of May 2018 - 12th of June 2018 => ALTS decrease fast (dump)
b) IF BTC.D increases & BTC decreases => ALTS decreases fast (dump)
1st of May 2018 - 12th of June 2018 => ALTS decrease fast (dump)

c) IF BTC.D increases & BTC stable => ALTS stable (accumulation)
13th of February 2018 - 30th of March 2018 (or at least 9th of March 2018) => ALTS are decreasing
12th of June 2018 - 16th of July 2018 => ALTS stable
13th of February 2018 - 30th of March 2018 (or at least 9th of March 2018) => ALTS are decreasing
12th of June 2018 - 16th of July 2018 => ALTS stable
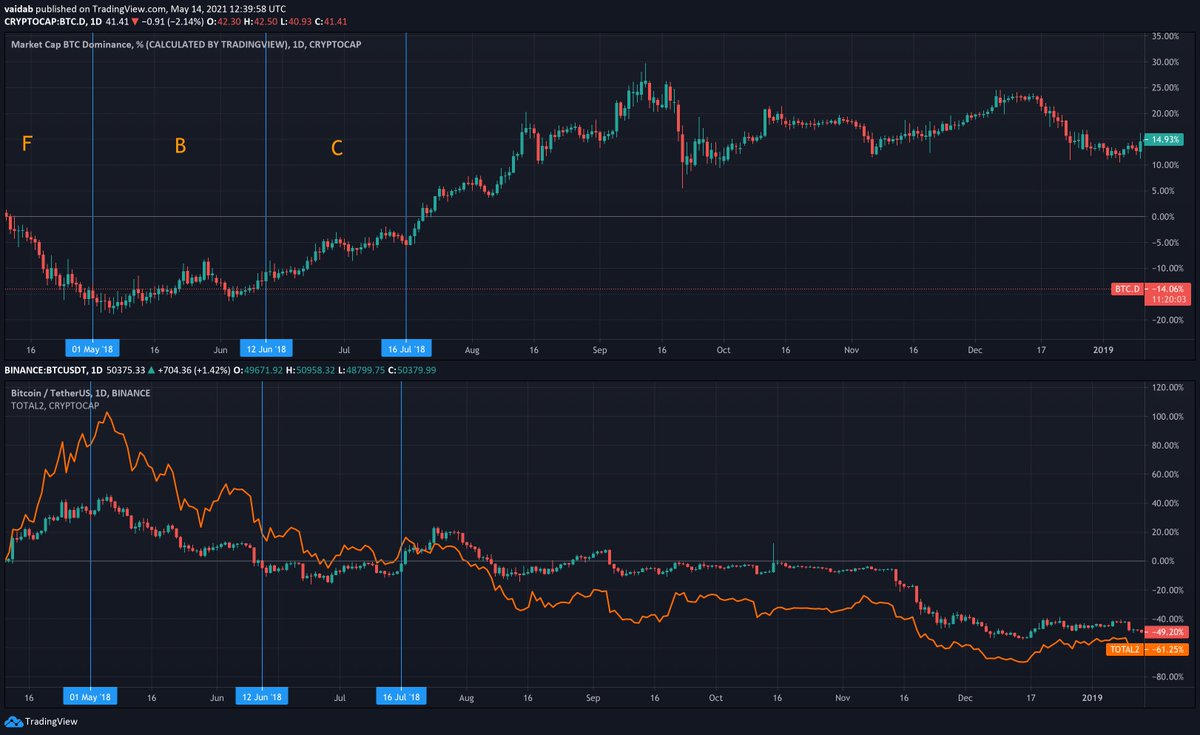

d) IF BTC.D decreases & BTC increases => ALTS increases fast (alt season)
e) IF BTC.D decreases & BTC decreases => ALTS stable
17th of December 2017 -> 13th of January 2018 => ALTS are actually increasing
e) IF BTC.D decreases & BTC decreases => ALTS stable
17th of December 2017 -> 13th of January 2018 => ALTS are actually increasing

f) IF BTC.D decreases & BTC stable => ALTS increases
30.03.2018 - 1.05.2018 => ALTS increases
30.03.2018 - 1.05.2018 => ALTS increases


^^^ I can continue but you can see that we can safely ignore The BTC Dominance Cycle and eyeball a different relation between the 3 entities: TOTAL2 and BTCUSD are linked and they have been linked up to April of this month when this happened: tradingview.com/x/YRZNp0VW/

You can verify this by yourself by plotting TOTAL2 over BTCUSD.
TOTAL2 and BTC go hand in hand but, according to the BTC Dominance Cycle, there are a few situations when they don't. Let's make sure we're right and check them again.
a) IF BTC.D increases and BTC increases => ALTS decreases
We can see here that ALTs actually increase during the BTC dominance + BTC increase: tradingview.com/x/g8bNWQUN/
We can see here that ALTs actually increase during the BTC dominance + BTC increase: tradingview.com/x/g8bNWQUN/

e) IF BTC.D decreases and BTC decreases => ALTS stable
Not according to this screenshot: tradingview.com/x/KYb3kaBe/
And if we look on a longer timeframe (tradingview.com/x/dexEcYGE/) we can see that ALTS are not stable, they are following BTC.
Not according to this screenshot: tradingview.com/x/KYb3kaBe/
And if we look on a longer timeframe (tradingview.com/x/dexEcYGE/) we can see that ALTS are not stable, they are following BTC.


f) IF BTC.D decreases and BTC stable => ALTS increases
Yes, this is true according to the same screenshot, tradingview.com/x/KYb3kaBe/
ALTs do increase with a slow momentum as BTC.D decreases: tradingview.com/x/mvVwA2n1/
Yes, this is true according to the same screenshot, tradingview.com/x/KYb3kaBe/
ALTs do increase with a slow momentum as BTC.D decreases: tradingview.com/x/mvVwA2n1/


So... we can ignore this diagram or we can do our own research but from mine that idea for the altseason is not proven.
DISCLAIMER: We can find situations where the cycles exist but my personal opinion is that this is our mind finding connections, not a true 6-step if-condition that can identify where we are in the market.
All right all right, but when is the infamous alt season? The one where the alts are growing to the moon just before the market dumps?
Partical conclusion: Crypto market cycles cannot be defined that easily (yet, at least). Alts have followed BTC except in 2017 and in 2021 (right about now), when they have exceeded it. So yes, we're in altseason (d0h!).
• • •
Missing some Tweet in this thread? You can try to
force a refresh


