Glen Peters Profile picture
May 25, 2021 11 tweets 4 min read Read on X
THREAD: Bioenergy use in the @IEA Net Zero 2050 scenario

I have seen a few comments that the IEA uses loads of bioenergy. Let's have a look...

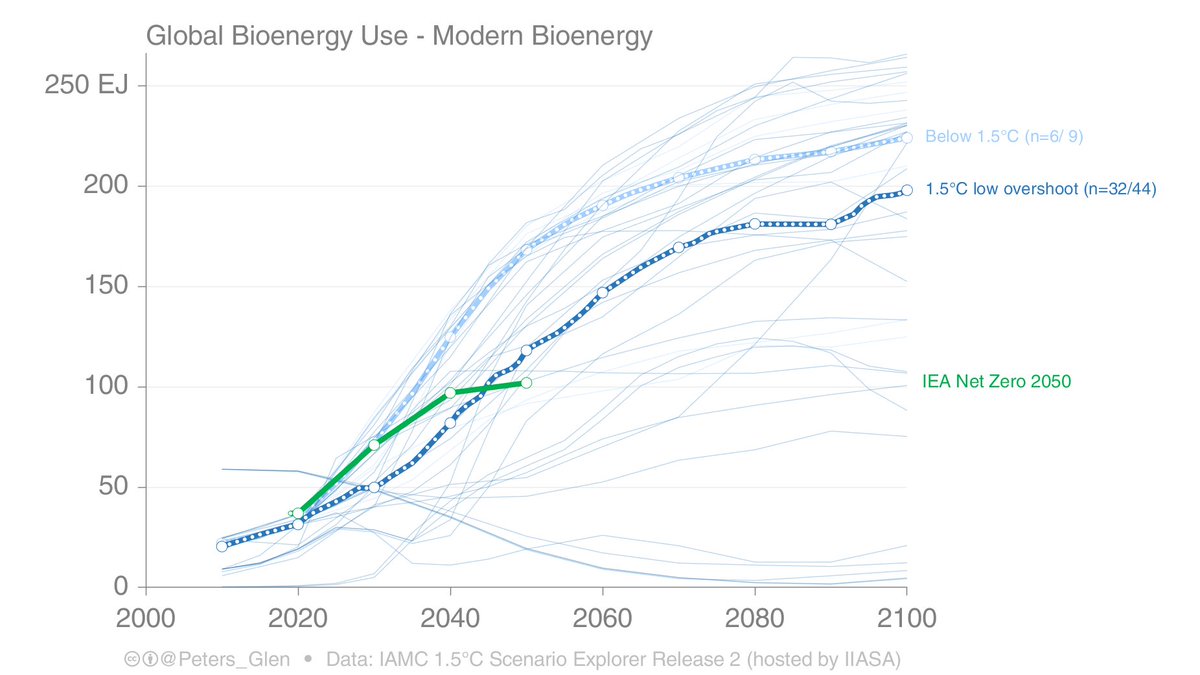
First up, overall, bioenergy use is lower than in equivalent scenarios assessed by the IPCC, particularly in 2050.

1/
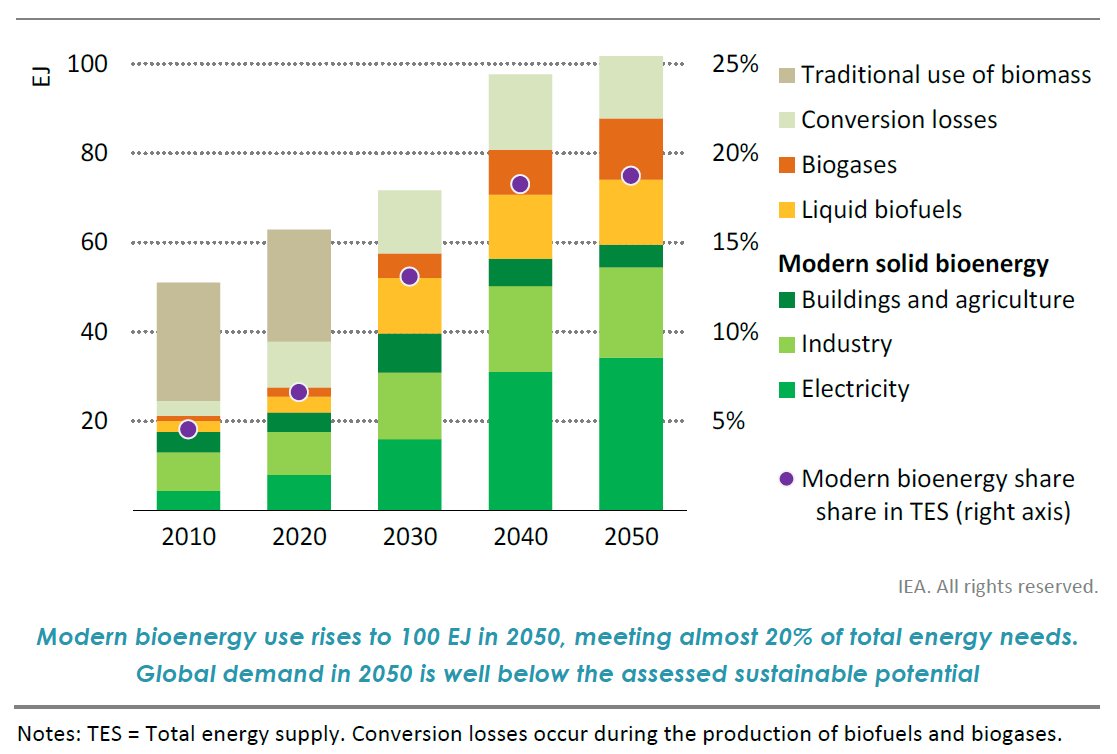
2. An important detail is that the IEA assumes traditional biomass is gone by 2030. Traditional bioenergy "is unsustainable, inefficient & polluting, & was linked to 2.5 million premature deaths in 2020"

The IPCC only has a slow drop, so the IEA must build up modern bioenergy.
3. In terms of modern bioenergy, the IEA has similar levels as the IPCC up until 2050.
* Rapid growth to 2030 is to compensate traditional bioenergy
* Slowdown to 2050 is to limit to 100EJ per year, view by many as sustainable.
4. Where is the bioenergy used?
* Big drop in traditional use
* Electricity: Provides balancing for wind/solar & can be used with CCS (BECCS) for CO₂ removal
* Heat: 50% district heating
* Industry: pulp/paper, steel, ...
* Transport shift from road to air (50% in 2050)
5. Where does the bioenergy come from?

A large part of the growth is organic waste & forest residues.

25EJ is from short-rotation woody crops & 10EJ from forestry plantings. These last two require land.
6. The land puzzle is hard to figure out. Some land is for bioenergy crops and some is for forests.

"The total land area dedicated to bioenergy production in the NZE increases from 330 Mha in 2020 to 410 Mha in 2050"
7. For bioenergy crops:

"There is 130 Mha of land used for short‐rotation advanced bioenergy crops in 2050 & 10 Mha for conventional bioenergy crops" (140Mha in 2050, no information on pathway to 2050).

Land use is less than most IPCC scenarios in 2050.
8. "There is no overall increase in cropland use for bioenergy production in the NZE from today’s level & no bioenergy crops are developed on forested land in the NZE"
9. Forest bioenergy:

"In 2050, ~270 Mha is forest, representing
around one‐quarter of the total area of global managed forests & around 5% of total forest
area"

I guess this is forestry plantations for bioenergy? Not possible to compare this to IPCC.
10. "Total land use for bioenergy in the NZE is well below estimated ranges of potential land availability that take full account of sustainability constraints, including the need to protect biodiversity hotspots"
11. The discussion of bio is reasonably detailed, spread in different parts of the report. I would not say the scenario is extreme on bioenergy, but generally less bioenergy than in the IPCC.

Read more: iea.org/reports/net-ze…

/end

• • •

Missing some Tweet in this thread? You can try to force a refresh
 

Keep Current with Glen Peters

Glen Peters Profile picture

Stay in touch and get notified when new unrolls are available from this author!

Read all threads

This Thread may be Removed Anytime!

PDF

Twitter may remove this content at anytime! Save it as PDF for later use!

Try unrolling a thread yourself!

how to unroll video
  1. Follow @ThreadReaderApp to mention us!

  2. From a Twitter thread mention us with a keyword "unroll"
@threadreaderapp unroll

Practice here first or read more on our help page!

More from @Peters_Glen

May 9
"Implemented policies result in projected emissions that lead to warming of 3.2°C, with a range of 2.2°C to 3.5°C (medium confidence)"

According to the landmark, widely reported IPCC Synthesis Report published in 2023.


1/ ipcc.ch/report/ar6/syr/
Image
If you are surprised by this figure, where the median is 2.5°C (not 3.2°C), then I am curious why you think scientists are so optimistic...

The survey reflects more or less what scientists have been saying for years?


2/ theguardian.com/environment/ar…
Image
This question is ambiguous: "How high above pre-industrial levels do you think average global temperature will rise between now and 2100?"
* ...pre-industrial... between "now and 2100"?
* Where we are currently heading or where we could head? This is largely a policy question?
3/
Read 10 tweets
Apr 12
There is a very strong linear relationship between atmospheric CO2 (concentration) and cumulative CO2 emissions.

In the last days, quite a few have been commenting there are feedbacks kicking in.

A thread...

1/ Image
If atmospheric CO2 is proportional to cumulative CO2 emissions, then the annual change in atmospheric CO2 is proportional to annual CO2 emissions.

The ratio of the two is the 'airborne fraction', which is rather constant. Maybe a slight increase in trend lately, maybe...

2/ Image
Since emissions have leveled out in the last decade, one would expect therefore that the atmospheric increase has leveled out.

The concentration data is noisy, and it has leveled out or not depending on how it is smoothed! (look at last 10 years).

3/ Image
Read 8 tweets
Apr 9
Is the atmospheric growth rate of CO2 slowing down?

Total CO2 emissions have gone from 2%/yr growth (2000s) to 0%/yr (2010s).

Do we see that change in the atmosphere?

It is hard to answer 🧵


1/ rdcu.be/buifD
Image
I can make this figure incredibly complex by adjusting for ENSO (red dots and line).

We know the response of atmospheric CO2 to El Niño is lagged. This figure shows a 9 month lag, as used by Betts & Jones in their projection

But, 2023 is a La Niña?

2/ metoffice.gov.uk/research/clima…
Image
The same figure with a three month lag says 2023 is a El Niño.

In either case, adjusting the growth rate for ENSO makes it look like the atmospheric CO2 growth rate is maintained, and not slowing down.

This is worrying. It should be slowing down...

3/ Image
Read 8 tweets
Dec 15, 2023
One of the key arguments that Norway uses to continue oil & gas developments, is that under BAU it is expected that oil & gas production will decline in line with <2°C scenarios, even with continued investment.

Let's look closer at these projections & reality...

1/ Image
Here is the projections from the 2003 report from the petroleum agency.

In reality (tweet 1) there was a dip around 2010, but production is now up around 250 million cubic again.

The forecast was totally & utterly WRONG!

2/ Image
In 2011 there was a forecast for an increase in production to 2020, but then a decline. This is probably since they started to put the Johan Sverdrup field on the books.

The increase in production was way too low, again, they got it wrong.

3/ Image
Read 9 tweets
Dec 5, 2023
📢Global Carbon Budget 2023📢

Despite record growth in clean energy, global fossil CO2 emissions are expected to grow 1.1% [0-2.1%] in 2023.

Strong policies are needed to ensure fossil fuels decline as clean energy grows!


1/ essd.copernicus.org/articles/15/53…
Image
CO2 emissions by fossil fuel:
* We thought coal peaked in 2014. No, & up another 1.1% in 2023
* Oil up 1.5%, on the back of a 28% increase in international aviation & China, but oil remains below 2019 level. 🤞
* Has the golden age of gas come to an end thanks to Russia?

2/ Image
By top emitters:
* China up 4.0% & a peak this year would be a surprise
*US down 3.0%, with coal at 1903 levels
* India up 8.2%, with fossil CO2 clearly above the EU27
* EU27, down 7.4% with drops in all fuels
* Bunkers, up 11.9% due to exploding international aviation

3/ Image
Read 11 tweets
Nov 3, 2023
Is the new @DrJamesEHansen et al article an outlier, or rather mainstream?

At least in terms of the key headline numbers, it seems rather mainstream, particularly if you remember most headline key numbers have quite some uncertainty!


🧵1/ academic.oup.com/oocc/article/3…
Image
Equilibrium Climate Sensitivity of 4.8°C ± 1.2°C

IPCC best estimate 3°C
IPCC likely range: 2.5-4°C
IPCC very likely range: 2-5°C

Sure, Hansen et al are in the high end, but so are many others.

More details:

2/
Image
"...global warming will exceed 1.5°C in the 2020s & 2°C before 2050"

Here is the global warming from "Current Policies" in IPCC AR6 WGIII. Sorry folks, but Hansen is actually conservative.

Also, cast your eyes to 2020-2030: WARMING ACCELERATES

3/ Image
Read 7 tweets

Did Thread Reader help you today?

Support us! We are indie developers!


This site is made by just two indie developers on a laptop doing marketing, support and development! Read more about the story.

Become a Premium Member ($3/month or $30/year) and get exclusive features!

Become Premium

Don't want to be a Premium member but still want to support us?

Make a small donation by buying us coffee ($5) or help with server cost ($10)

Donate via Paypal

Or Donate anonymously using crypto!

Ethereum

0xfe58350B80634f60Fa6Dc149a72b4DFbc17D341E copy

Bitcoin

3ATGMxNzCUFzxpMCHL5sWSt4DVtS8UqXpi copy

Thank you for your support!

Follow Us!

:(