Today's COVID vaccine update:
- Shots reported today: 256,179
- Total shots: 21,637,723
- Age 12+ w/ a Shot: 60.1%
- Age 18+ w/ a Shot: 65.3% (est)
- Shots per 100 people: 56.9
- Inventory: 10.3 days
More: trevortombe.github.io/covidgraphs/
- Shots reported today: 256,179
- Total shots: 21,637,723
- Age 12+ w/ a Shot: 60.1%
- Age 18+ w/ a Shot: 65.3% (est)
- Shots per 100 people: 56.9
- Inventory: 10.3 days
More: trevortombe.github.io/covidgraphs/

Detailed data on vaccination rates by age is important, but comes with a long lag. I construct my own estimates. Here's the latest:
- Those 60+: 88.5% have at least one dose and 9.1% have two
- 18-59: it's 55.0% and 4.4%
- Adults: 65.3% and 5.8%
- Those 60+: 88.5% have at least one dose and 9.1% have two
- 18-59: it's 55.0% and 4.4%
- Adults: 65.3% and 5.8%

In total, Canada is now up to 21.6 million shots given -- which is 85.2% of the total 25.4 million doses available. Over the past 7 days, 3,633,800 doses have been delivered to provinces.
And so far 1.7 million are fully vaccinated with two shots.
And so far 1.7 million are fully vaccinated with two shots.

Canada's pace of vaccination:
Today's 256,179 shots given compares to an average of 364,132/day over the past week and 361,552/day the week prior.
- Pace req'd for 2 doses to 75% of Canadians by Sept 30: 276,362
- At current avg pace, we reach 75% by Aug 30
Today's 256,179 shots given compares to an average of 364,132/day over the past week and 361,552/day the week prior.
- Pace req'd for 2 doses to 75% of Canadians by Sept 30: 276,362
- At current avg pace, we reach 75% by Aug 30

Based on the share of people with 1 or more doses (a weaker threshold), at Canada's current pace we reach 75% by June 20. We reach enough for 75% of those age 12+ by June 9.
Gray lines are past projections.
Gray lines are past projections.

What about two doses? Here's when we'll have enough doses to reach different points:
- 75% of age 12+ w/ 1+ dose and 20% w/ 2: June 21
- 75% of 12+ w/ 2 doses: August 10
- 75% of age 12+ w/ 1+ dose and 20% w/ 2: June 21
- 75% of 12+ w/ 2 doses: August 10

Can our pace continue? Yes. Here's the recently updated delivery schedule. Enough for an average of 332k per day between now and end of July.
Note: doesn't include current inventories or deliveries not yet scheduled (like J&J).
Note: doesn't include current inventories or deliveries not yet scheduled (like J&J).

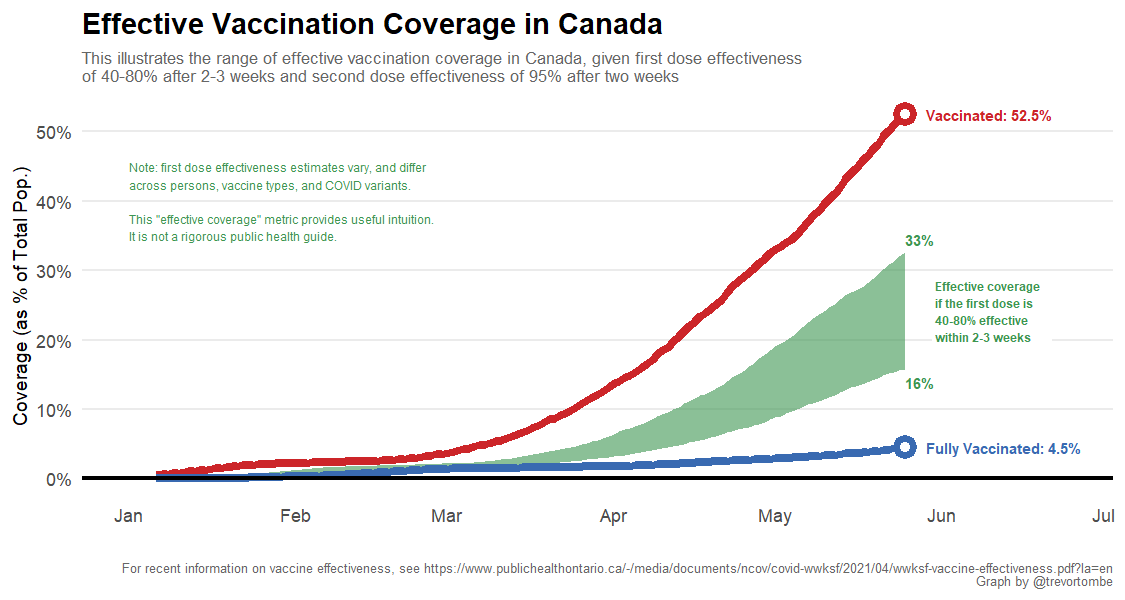
Dose projections are informative, but effective protection is lower than the share with a shot. One dose is less effective than two, plus effects lag and are uncertain. Roughly, current "coverage" is ~16-33%
Useful research summary: publichealthontario.ca/-/media/docume…
Useful research summary: publichealthontario.ca/-/media/docume…
Turning to individual provinces, here's total shots given and share of delivered doses used.
- Most shots given: YT at 124 doses per 100 people
- Fewest: NS at 52
- Highest share of delivered doses used: AB with 94%
- Lowest: NU with 69%
- Most shots given: YT at 124 doses per 100 people
- Fewest: NS at 52
- Highest share of delivered doses used: AB with 94%
- Lowest: NU with 69%

A more detailed look at provs/terrs:
- Highest overall: YT at 66% receiving at least one shot
- Most 1st doses only: BC at 51% receiving that shot
- Most Fully Vaccinated: YT at 58%
- Fewest Vaccinated: NU at 43%
- Highest overall: YT at 66% receiving at least one shot
- Most 1st doses only: BC at 51% receiving that shot
- Most Fully Vaccinated: YT at 58%
- Fewest Vaccinated: NU at 43%

Looking forward, here's time to reach 75% of people age 12+ w/ 1+ doses based on the latest 7-day average daily pace.
- QC fastest at 13 days.
- PEI slowest at 26 days.
- QC fastest at 13 days.
- PEI slowest at 26 days.

How does Canada compare to others? Currently, Canada ranks 3rd out of 37 OECD countries in terms of the share of the population that is at least partially vaccinated. In terms of total doses per 100, Canada is 7th.
Source: ourworldindata.org/covid-vaccinat…
Source: ourworldindata.org/covid-vaccinat…

Canada/US comparison.
Received at least one dose:
- Top Prov: QC, 55.0% of pop
- Top State: VT, 69.9
- Top Terr: YT, 65.8
Fully vaccinated:
- Top Prov: AB, 8.0% of pop
- Top State: VT, 53.1
- Top Terr: YT, 58.1
Interactive plot here: trevortombe.github.io/covidgraphs/usa
Received at least one dose:
- Top Prov: QC, 55.0% of pop
- Top State: VT, 69.9
- Top Terr: YT, 65.8
Fully vaccinated:
- Top Prov: AB, 8.0% of pop
- Top State: VT, 53.1
- Top Terr: YT, 58.1
Interactive plot here: trevortombe.github.io/covidgraphs/usa

Going forward, here's a cdn/usa comparison of total doses per 100 people.
- In Canada, this rises by 0.96 per day. The US rises by 0.53 per day.
- Projected out, we match the US in 69 days
- Reaching the current US rate takes 31 days.
- In Canada, this rises by 0.96 per day. The US rises by 0.53 per day.
- Projected out, we match the US in 69 days
- Reaching the current US rate takes 31 days.

Of course, there's lots of ways to compare. Here's a selection across several metrics/groups of how Canada ranks globally. Pick your preferred measure!

Fin.
Note: all graphs (and more!) are automatically updated and posted online for later review and easy sharing at the following site: trevortombe.github.io/covidgraphs/
Note: all graphs (and more!) are automatically updated and posted online for later review and easy sharing at the following site: trevortombe.github.io/covidgraphs/
• • •
Missing some Tweet in this thread? You can try to
force a refresh