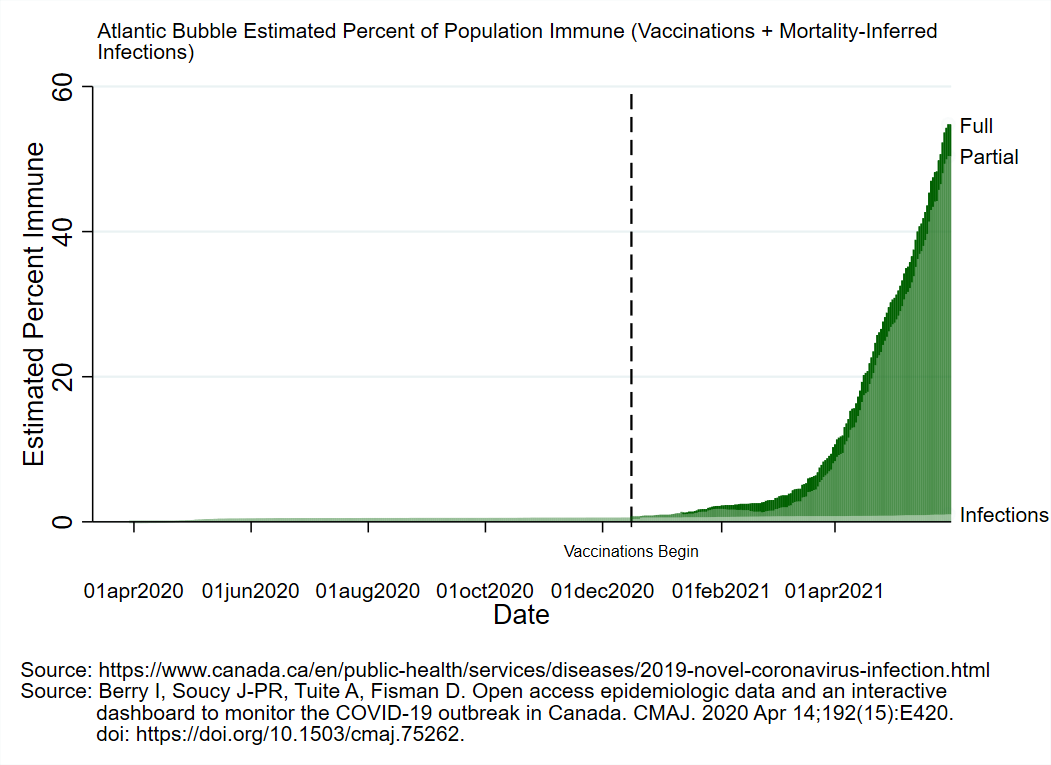
Today in the #AtlanticBubble
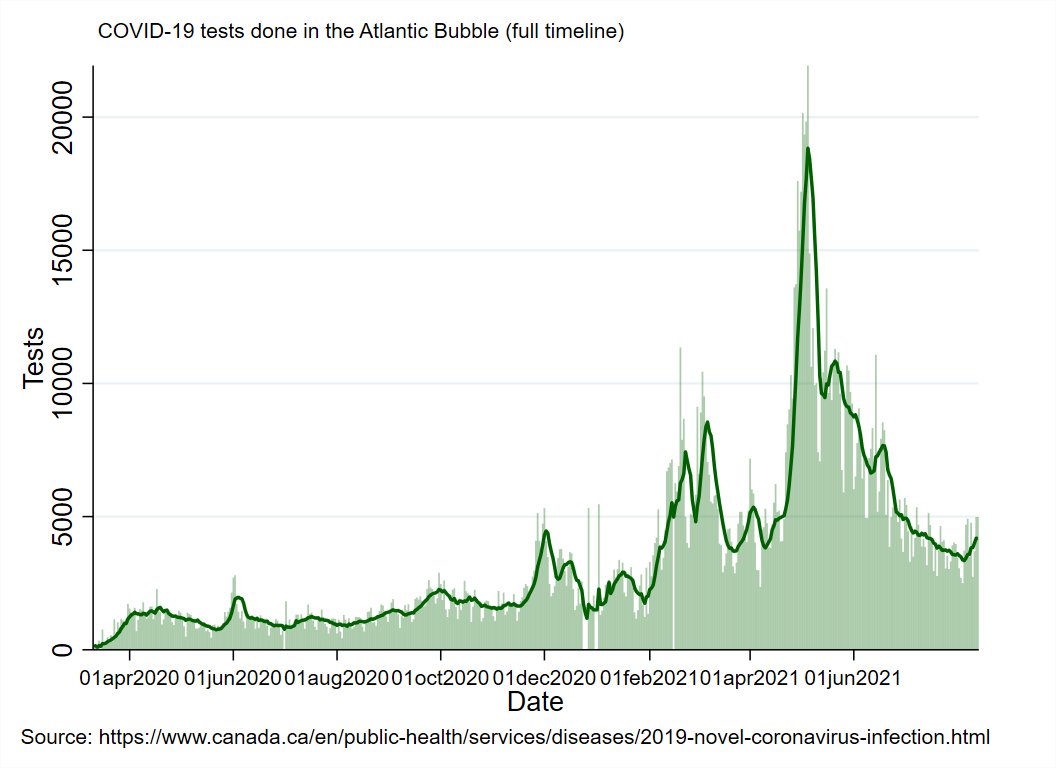
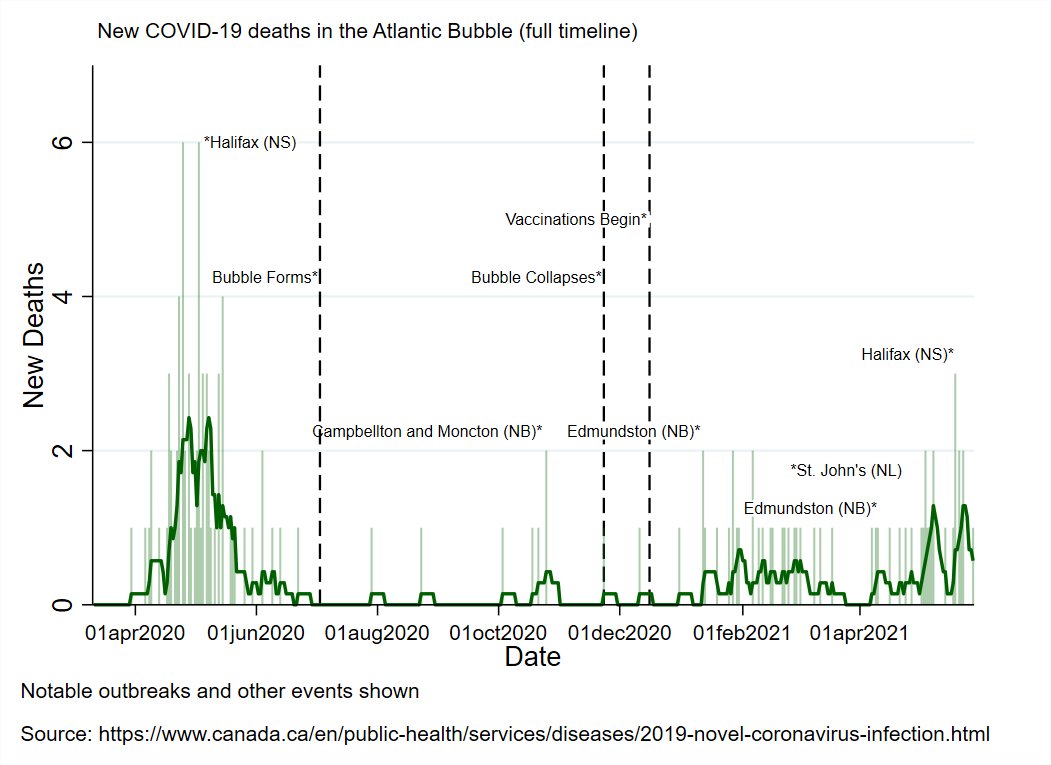
65 new cases were reported in the region today: 2 in PEI, 9 in New Brunswick, 14 in Newfoundland and Labrador, and 40 in Nova Scotia.
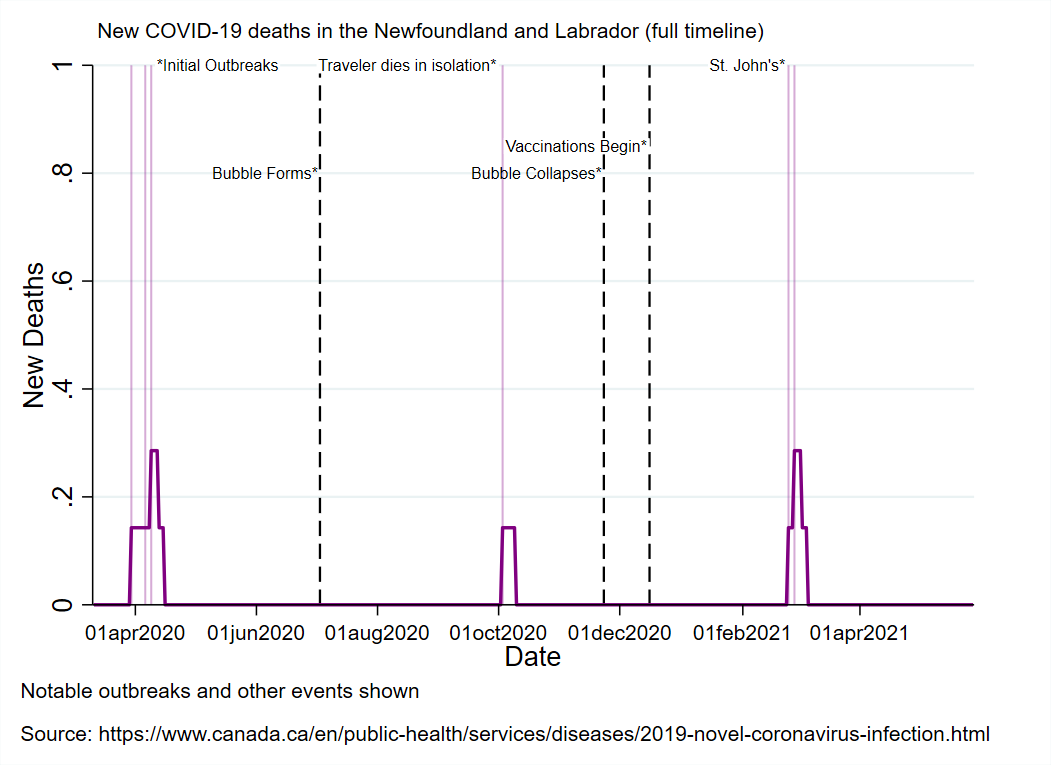
1 new death was reported, bringing the regional total to 129.
There are now 932 known, active cases in the region


65 new cases were reported in the region today: 2 in PEI, 9 in New Brunswick, 14 in Newfoundland and Labrador, and 40 in Nova Scotia.
1 new death was reported, bringing the regional total to 129.
There are now 932 known, active cases in the region



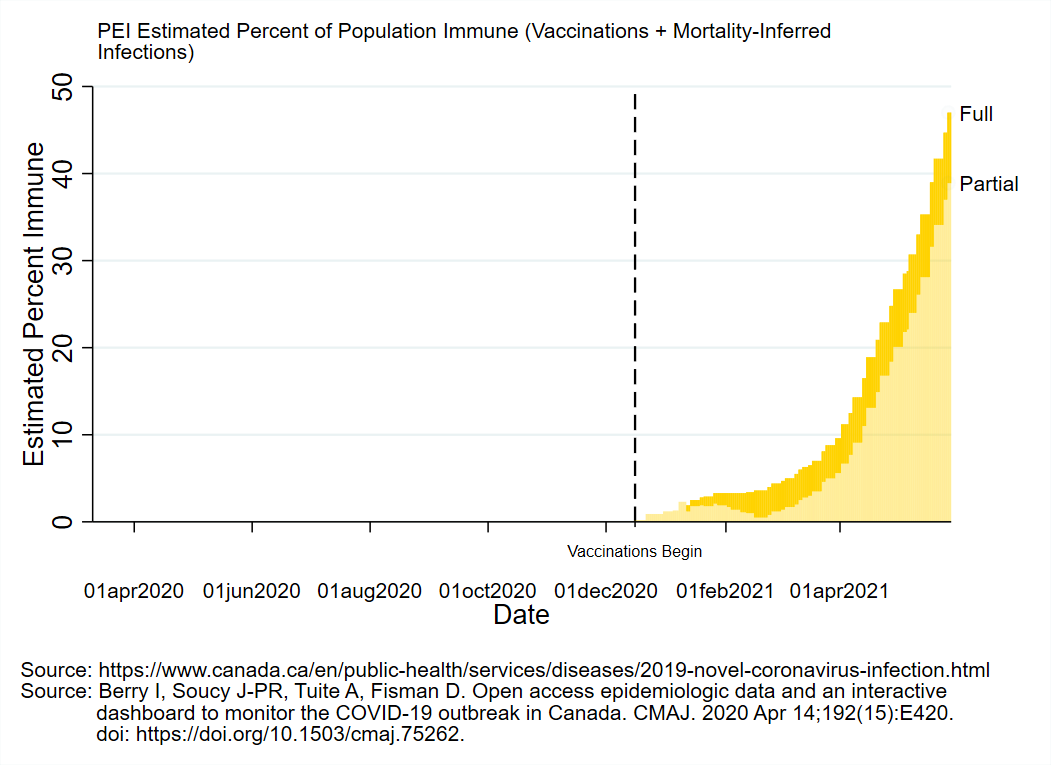
PEI reported 2 new cases today:
Both were related to travel and both were detected during routine testing in isolation.
There are now 12 known, active cases in PEI.


Both were related to travel and both were detected during routine testing in isolation.
There are now 12 known, active cases in PEI.


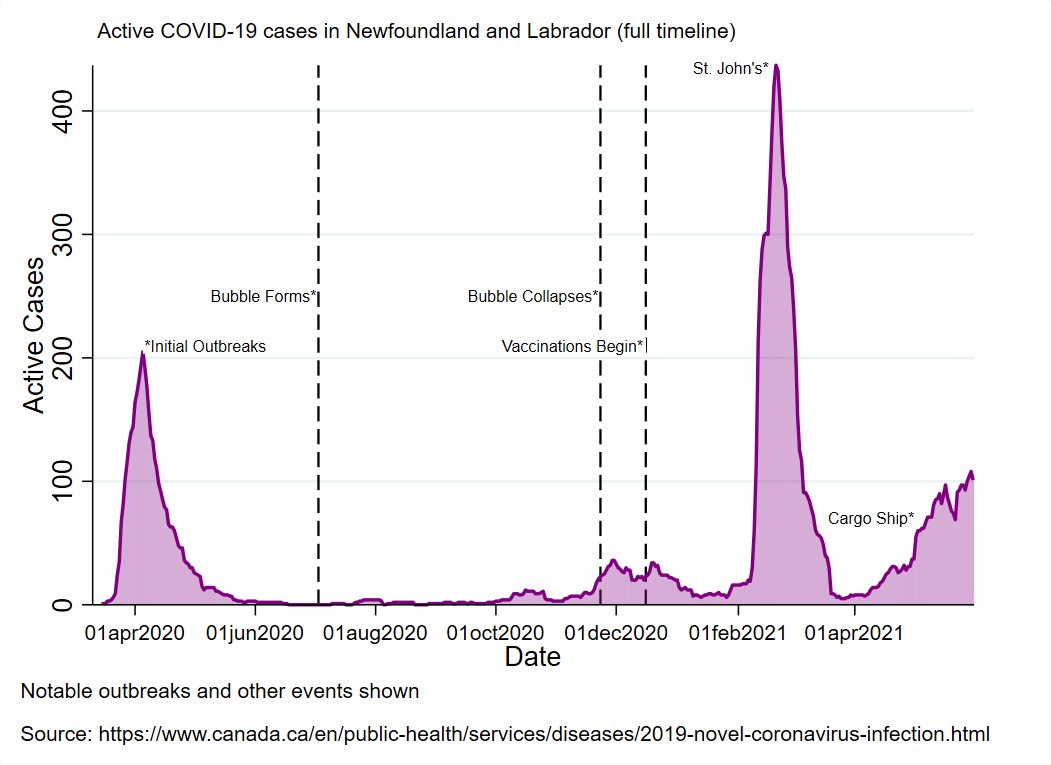
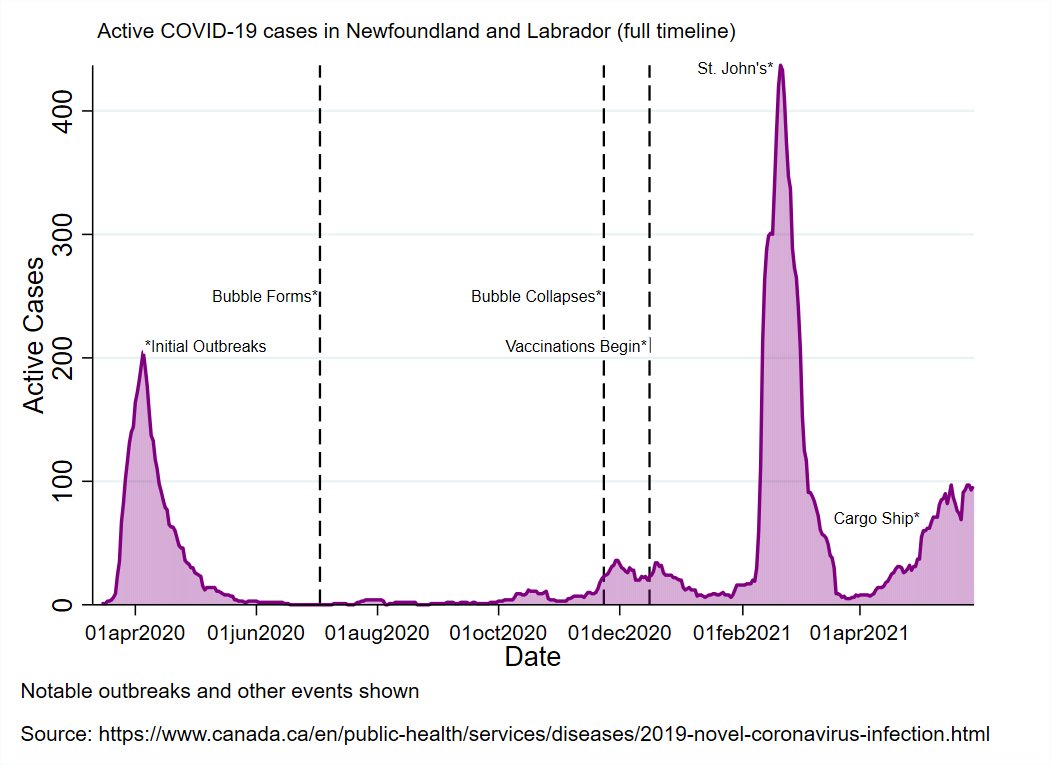
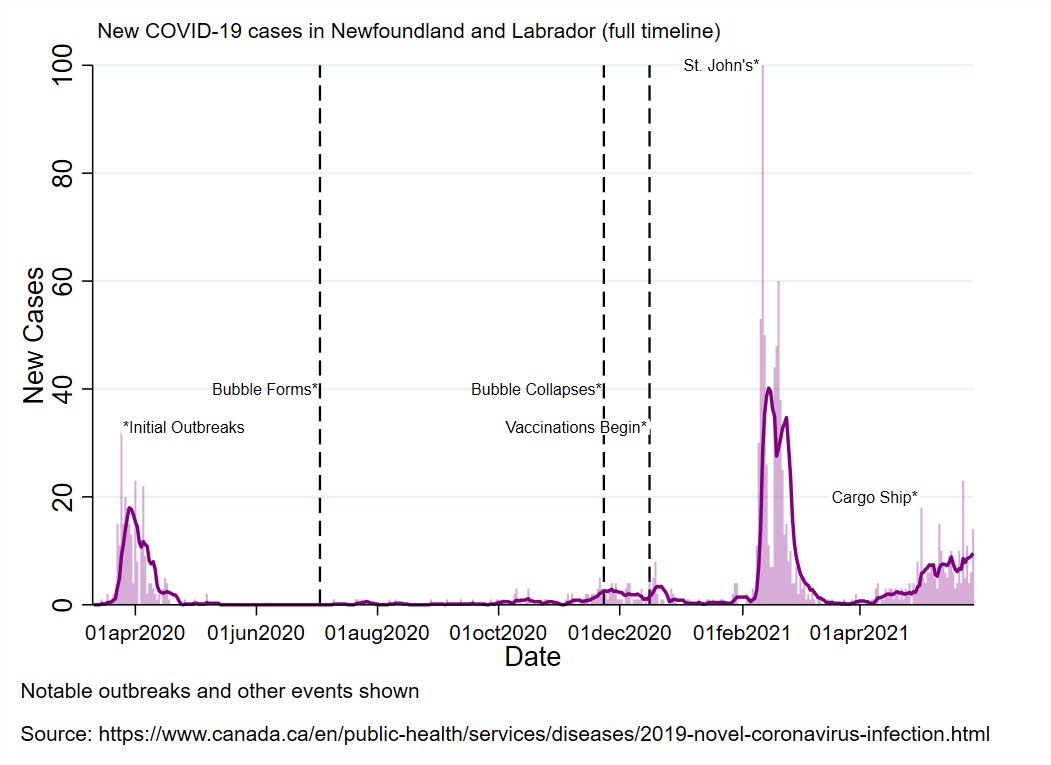
NL reported 14 new cases today:
1 in the Western health region (travel-related)
2 in the Eastern region (1 travel-related, 1 close contact)
11 in the Central zone (10 close contacts, 1 under investigation)
There are now 96 known, active cases in NL.


1 in the Western health region (travel-related)
2 in the Eastern region (1 travel-related, 1 close contact)
11 in the Central zone (10 close contacts, 1 under investigation)
There are now 96 known, active cases in NL.

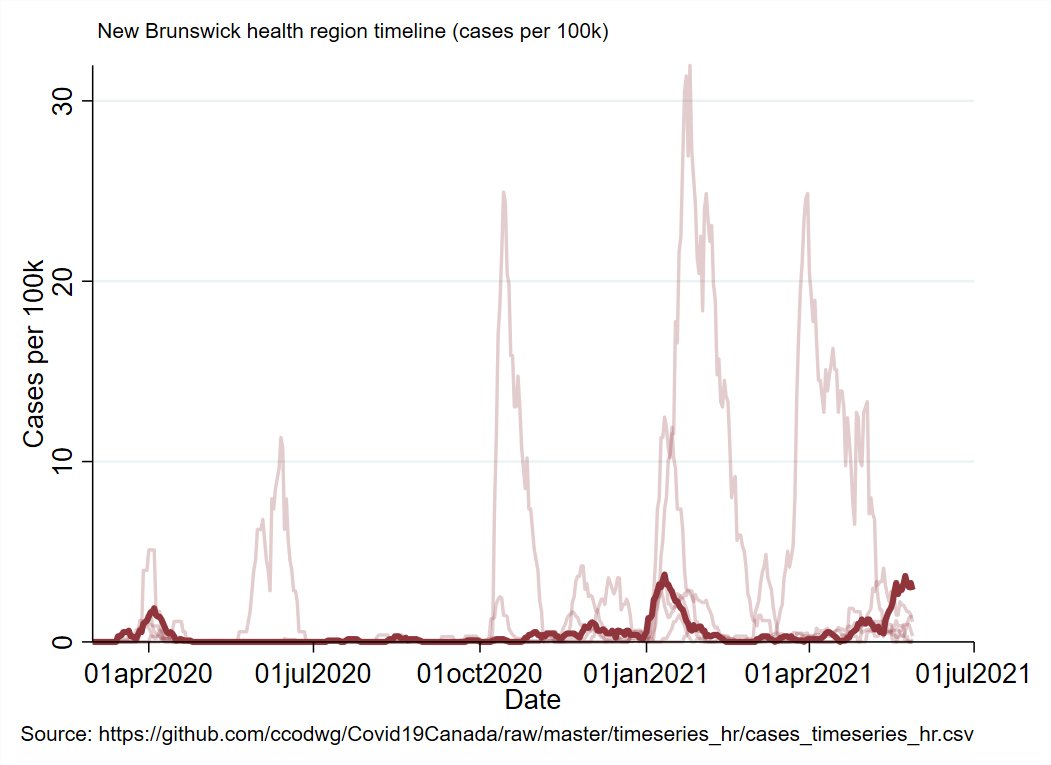
NB reported 9 new cases:
1 in Moncton (close contact)
2 in Saint John (both travel-related)
4 in Fredericton (all close contacts)
2 in Bathurst (both travel-related)
There are now 139 known, active cases in NB.


1 in Moncton (close contact)
2 in Saint John (both travel-related)
4 in Fredericton (all close contacts)
2 in Bathurst (both travel-related)
There are now 139 known, active cases in NB.


• • •
Missing some Tweet in this thread? You can try to
force a refresh


