Hold2 Profile picture
May 29, 2021 5 tweets 3 min read Read on X
Lowest 10 States - COVID Mortality Year-Over-Year

This is Reported Death Per Million shown Year-over-Year for the 10 states with the lowest COVID mortality.
Oregon and Washington by themselves on the same scale.

Note that 1/M/Day is very low.
These charts show Hospitalization Census Per Million for 2 groups:

Chart 1) The 5 states with the highest COVID Mortality

Chart 2) The 5 states with the lowest COVID Mortality

Same scale.

Bottom 5 are higher than last year but overall extremely low. Peak barely above 100/M.
Here are the middle 40 states (subtracting the top 5 and bottom) in cumulative COVID mortality.
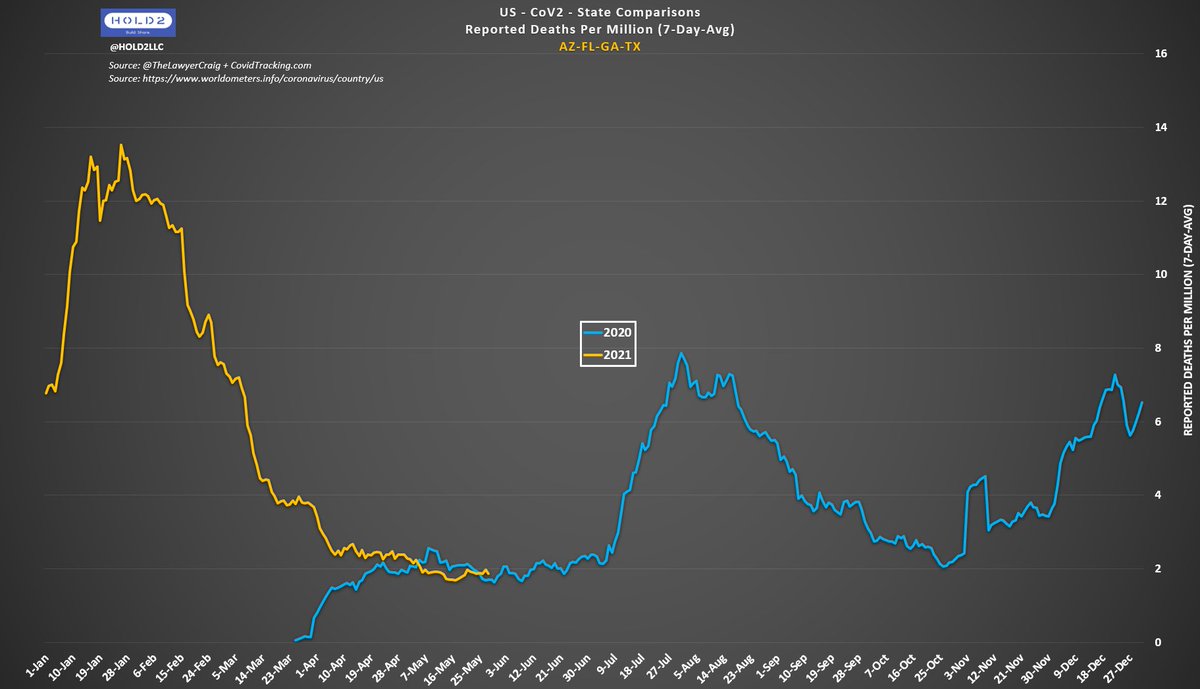
Reported Deaths Per Million for AZ/FL/GA/TX together.

Hmm.

• • •

Missing some Tweet in this thread? You can try to force a refresh
 

Keep Current with Hold2

Hold2 Profile picture

Stay in touch and get notified when new unrolls are available from this author!

Read all threads

This Thread may be Removed Anytime!

PDF

Twitter may remove this content at anytime! Save it as PDF for later use!

Try unrolling a thread yourself!

how to unroll video
  1. Follow @ThreadReaderApp to mention us!

  2. From a Twitter thread mention us with a keyword "unroll"
@threadreaderapp unroll

Practice here first or read more on our help page!

More from @Hold2LLC

Feb 20
Nature is pretty amazing, eh?

Look how this year is tracing with last year. Remarkable.

% of ED Visits w/CoV2 Image
Zoomed in. Image
All years - Hospital Admissions Image
Read 6 tweets
Jan 15
Hello, @m_scribe and @guardian , this article has false claims about Flu, CoV2, and RAV, which should be corrected.

None of the 3 are rising, and the CoV2 weekly changes are out of date. You gave the weekly changes for week-ending 12/30, but CDC updates through week-ending 1/6. Image
All 3 can be seen declining no later than 12/30.


Image
Image
Image
Image
Will you fix the article based on the above, or is there a better method for requesting a formal correction?
Read 4 tweets
Mar 15, 2023
Kelley, did you know the WHO actually did reduce that harms list in the Dec 2020 update of that same document?

Conspicuously, they removed both “self-contamination” bullets.

More undue influence yet again?

(Before and After shown here) ImageImage
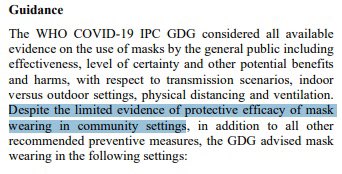
Oh, and these same 2 documents say the following about mask effectiveness. ImageImage
And what was their final recommendation?

“Despite the limited evidence of protective efficacy.”

They still advised community mask wearing in certain settings.

This is Dec 2020, not April. Image
Read 4 tweets
Mar 14, 2023
Dr. Gandhi, I do not believe PH will simply “recommend.”

I have hate in my heart for your profession, and it will not go away easily.

I say this because I have always believed you cared even when I was screaming at you to stop promoting school masking based on Hosp census.
If you are truly trying to drive the PH ship towards being helpful and trustworthy, please take my comments and those of others to heart.

We don’t just not trust you. WE _HATE_ YOU (public health community).

It is a deep resentment that must first be addressed and atoned for.
Exactly right.

And the CDC + Fauci + all major US Gov PH is still doing it. They haven’t budged an inch.
Read 5 tweets
Mar 13, 2023
Sure, I will respond genuinely on the basis you are asking earnestly.

First, I think EVERYTHING in the screenshot is bad:

1) “Ritual and solidarity” are brainwashing techniques. Fooling/coercing people into accepting and then propagating a measure is dastardly to begin with

/1 Image
2) Doing that with a measure that is ineffective is downright evil, because it brainwashes people unknowingly into a self-harming act both directly (unsanitary, dehumanizing, social detriment, etc) and indirectly (increased exposure due to false sense of security)

/2
3) Nothing wrong with people protecting themselves, but community masking with any material was not protective for the individual and especially not the community. It was always a lie even if Zeynep truly believed in masks personally

/3
Read 4 tweets
Feb 7, 2023
NYC CoV2 Update: 2/7/23

Not many Unvaxxed getting Vaxxed since July 2022.

Ratio of Vaxxed outcomes remaining steady since March of 2022.

Limitations/Caveats:
- I'm using 2020 census pop as the denominator
- I'm combining Boosted + Full Vax
- NYC excludes Partial Vax outcomes
The reason I show NYC data as "% Share of Outcomes" is because @nycHealthy chooses to show "age-adjusted per 100k" Vax vs. Unvax rates.

...but doing that is susceptible inaccurate Unvax denominators.

Here, you can see how far off those denominators are:

Hold2 vs. DOH
How do they explain this?

1) Double-counting multi-race individuals
2) Still using the 2019 intercensal population estimates based on the 2010 census

How can they still not be using 2020 Census numbers in 2023?
Read 5 tweets

Did Thread Reader help you today?

Support us! We are indie developers!


This site is made by just two indie developers on a laptop doing marketing, support and development! Read more about the story.

Become a Premium Member ($3/month or $30/year) and get exclusive features!

Become Premium

Don't want to be a Premium member but still want to support us?

Make a small donation by buying us coffee ($5) or help with server cost ($10)

Donate via Paypal

Or Donate anonymously using crypto!

Ethereum

0xfe58350B80634f60Fa6Dc149a72b4DFbc17D341E copy

Bitcoin

3ATGMxNzCUFzxpMCHL5sWSt4DVtS8UqXpi copy

Thank you for your support!

Follow Us!

:(