The Great Big Canadian Pandemic Summary Thread (3rd edition)
The 3rd wave in Canada is winding down.
As usual, there will be 2 parts: 1 summarizing each of the provinces and territories, and 1 custom analysis looking at determinants.
The 3rd wave in Canada is winding down.
As usual, there will be 2 parts: 1 summarizing each of the provinces and territories, and 1 custom analysis looking at determinants.
https://twitter.com/WilsonKM2/status/1388553023262269447
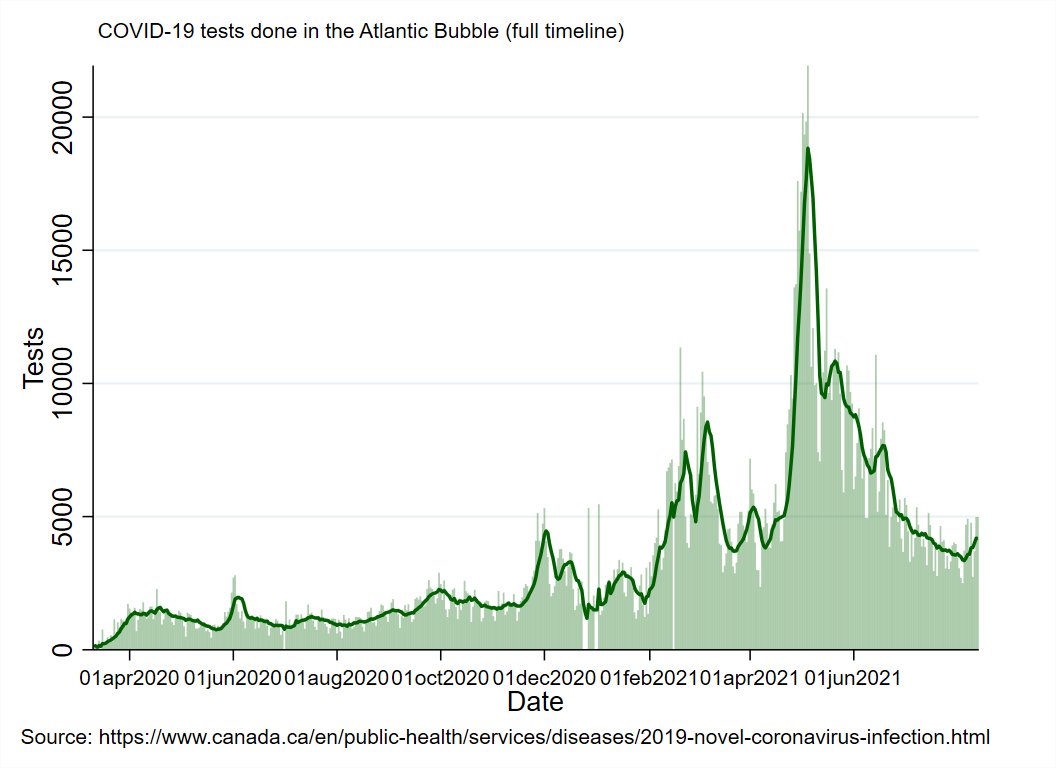
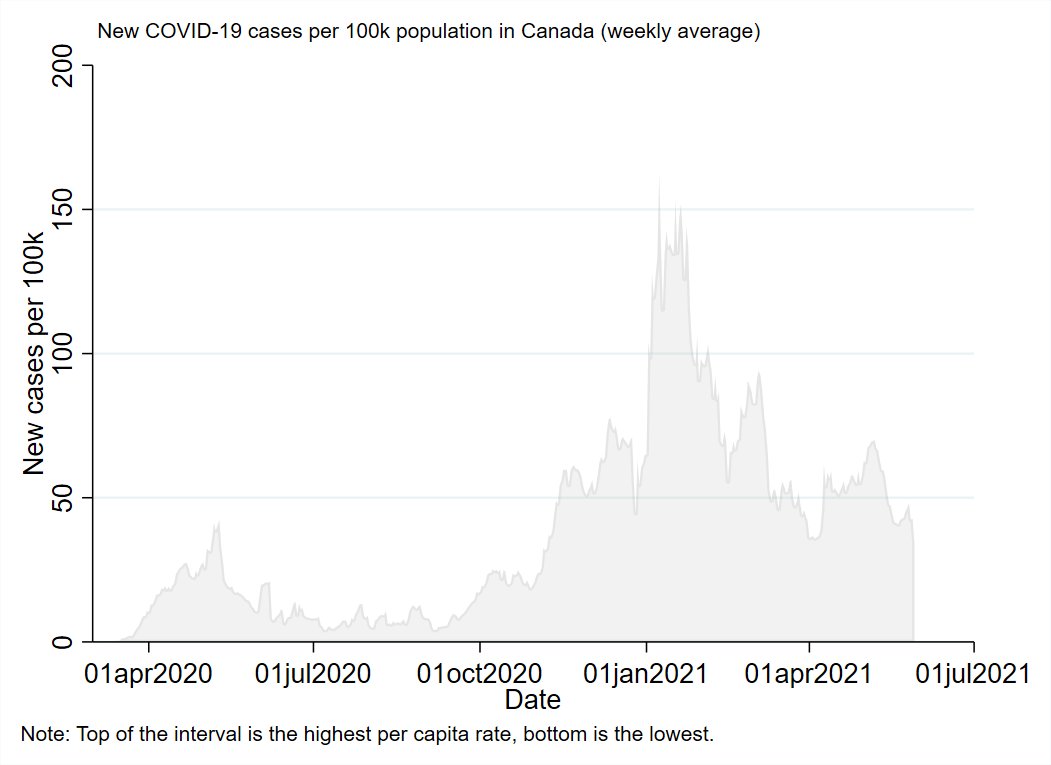
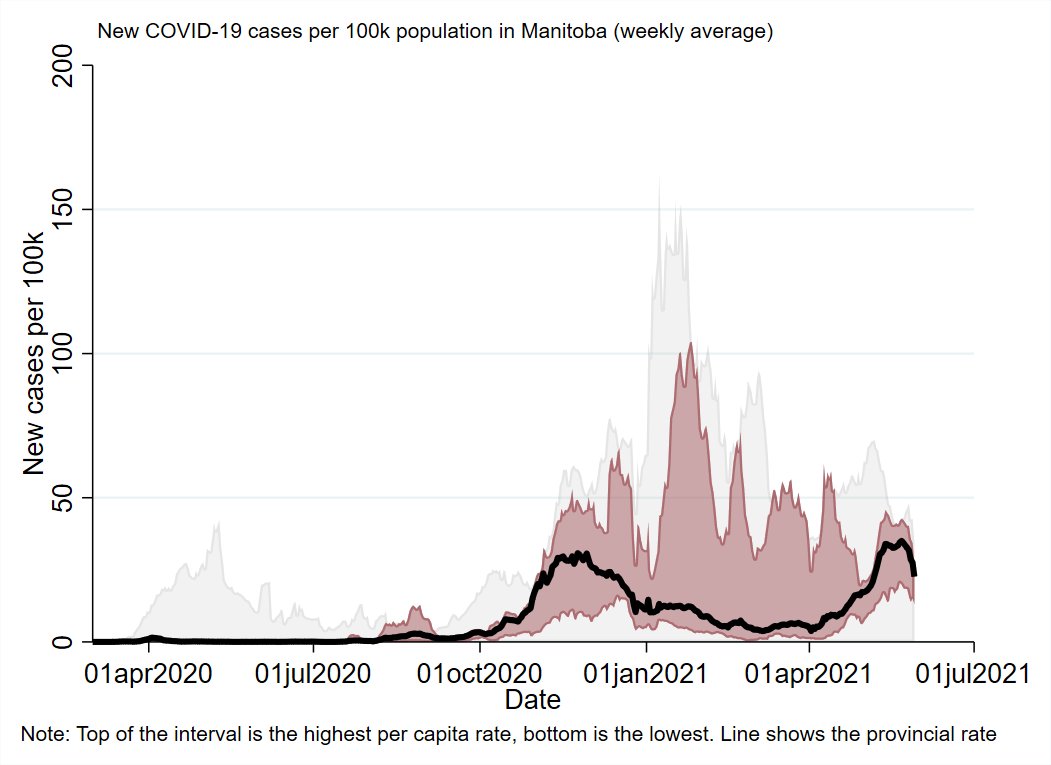
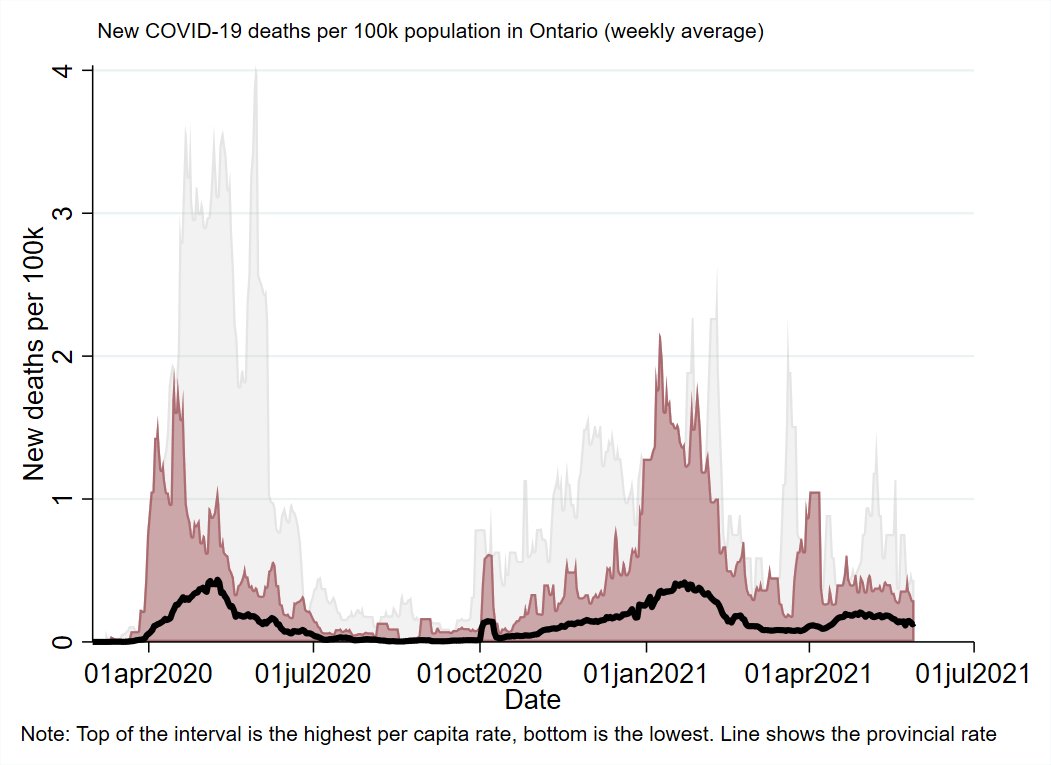
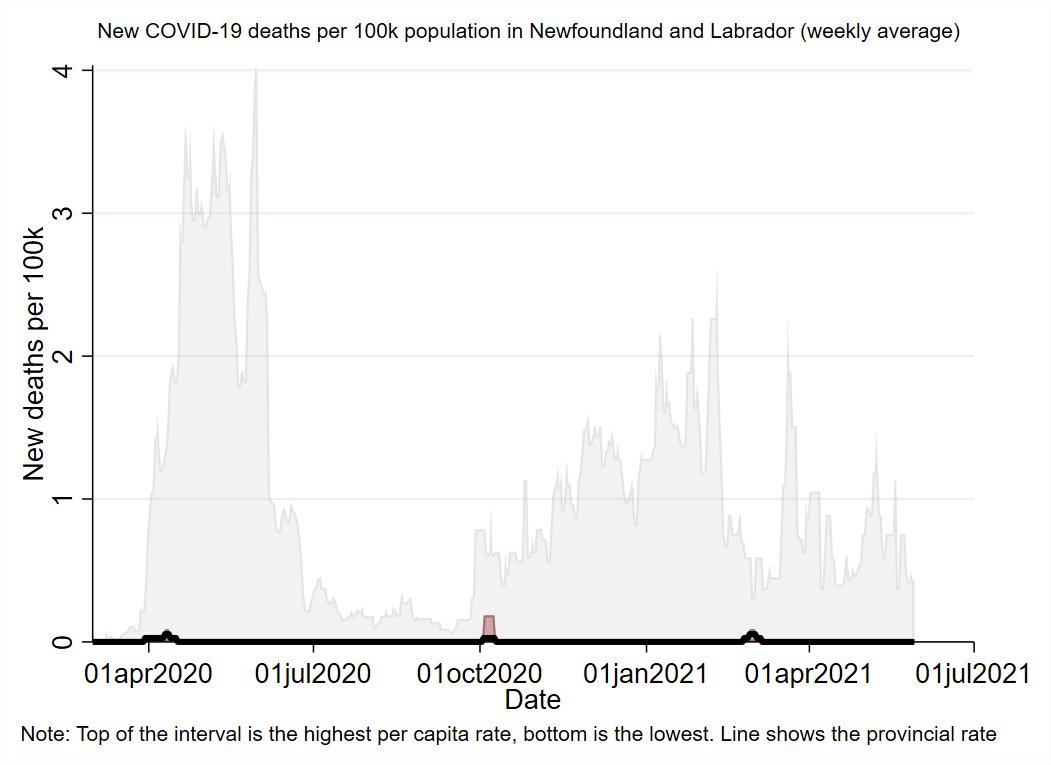
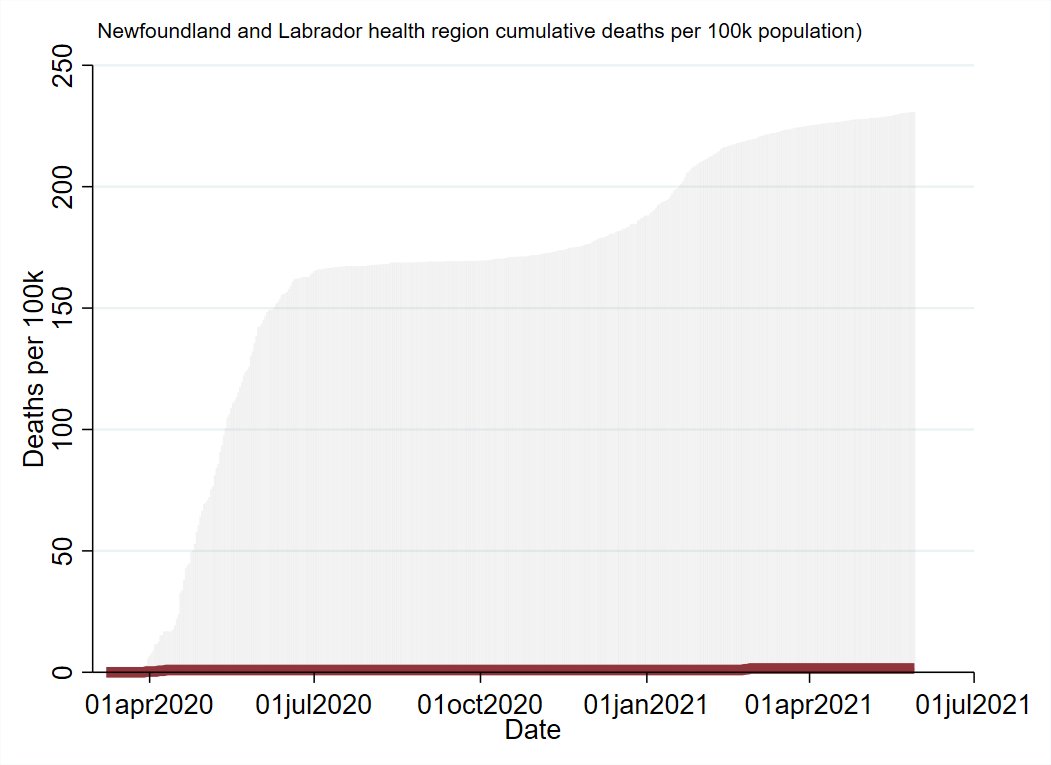
All the summaries have a common format. The grey shading in the background is the range of the lowest to highest per capita rate for the country.
The colour-shading is the same at the provincial level, and the line just shows the overall provincial rate.
The colour-shading is the same at the provincial level, and the line just shows the overall provincial rate.

BC's 3rd wave has more or less wound down, having hit it's peak in early/mid-April.
Deaths ticked up a little, but definitely nowhere near as much as pre-vaccine roll-out (this will be a recurring theme)
Deaths ticked up a little, but definitely nowhere near as much as pre-vaccine roll-out (this will be a recurring theme)


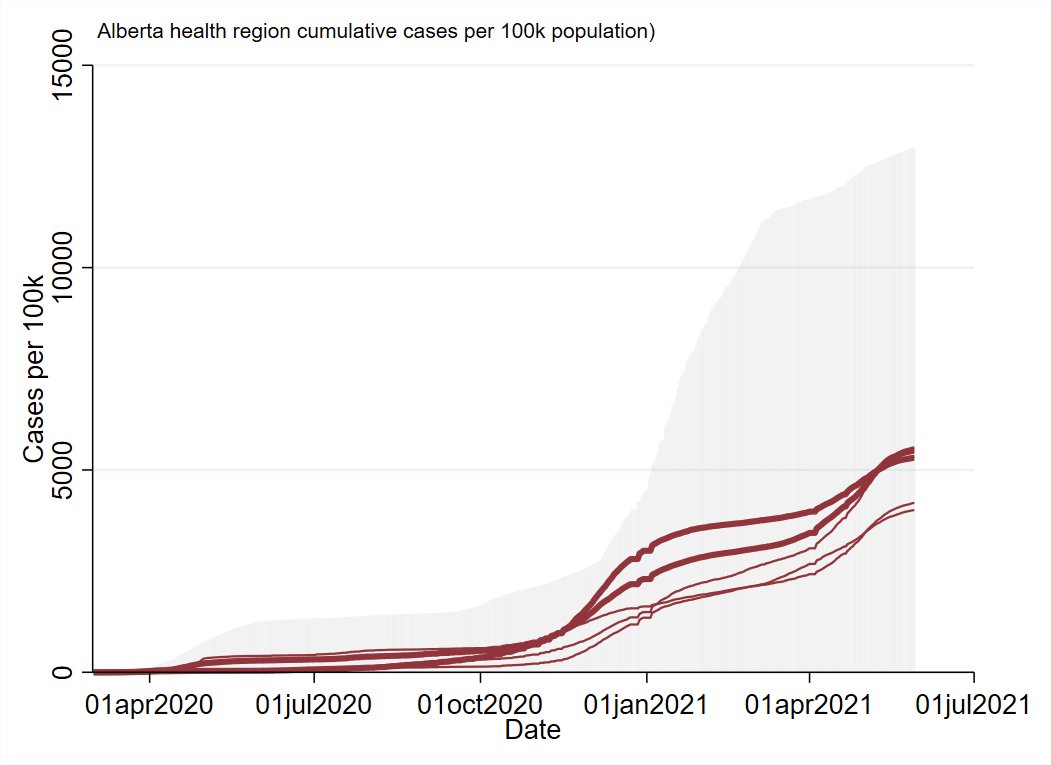
Alberta had the largest and one of the latest-peaking of the 3rd wave outbreaks.
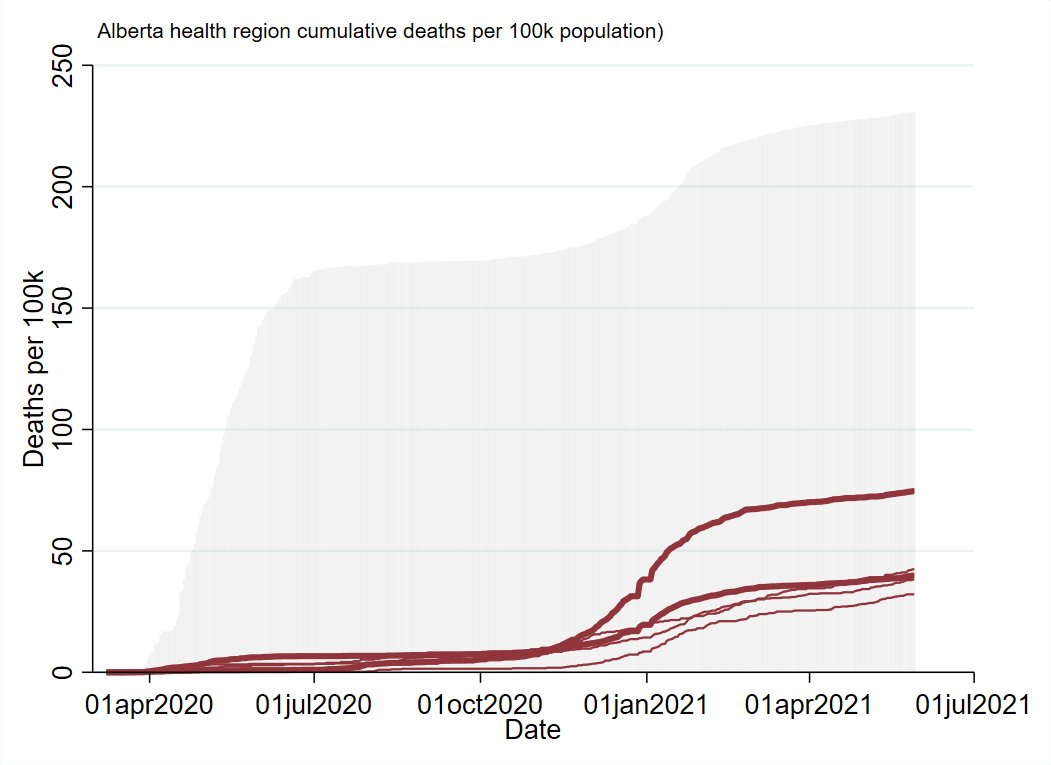
Deaths increased and don't seem to have yet peaked, but as with other provinces it's muted relative to previous waves.
Weird dynamic with AB is that the whole province goes up and down together.
Deaths increased and don't seem to have yet peaked, but as with other provinces it's muted relative to previous waves.
Weird dynamic with AB is that the whole province goes up and down together.


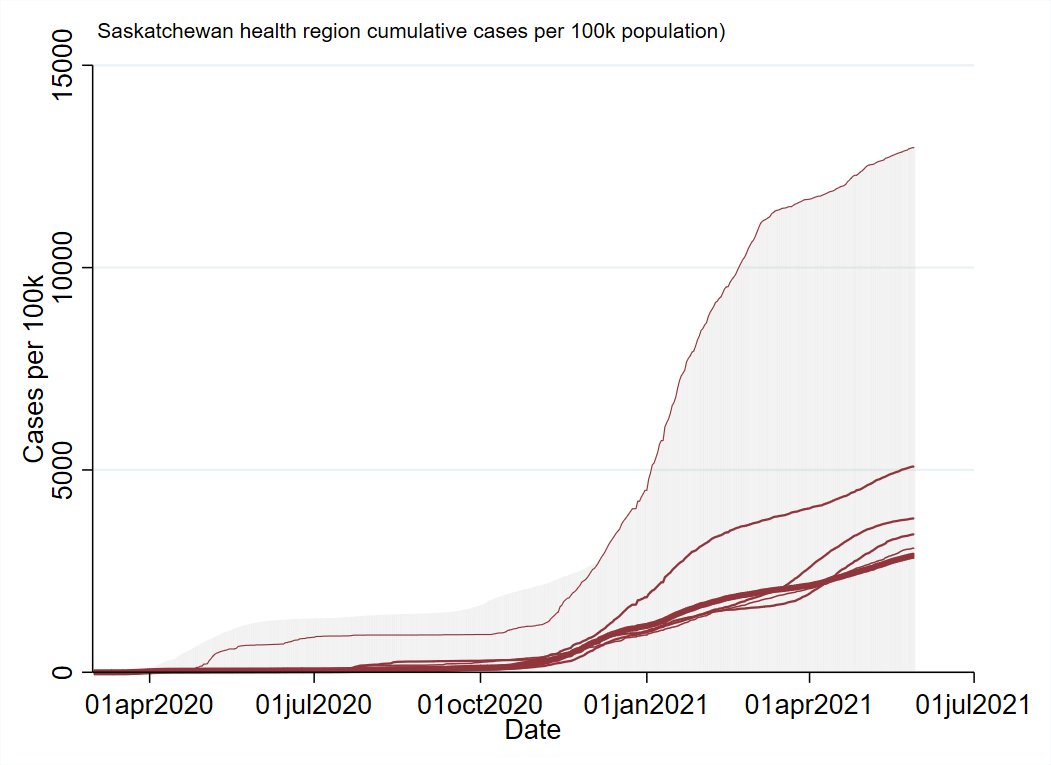
Saskatchewan's 3rd wave was more urban-centered than it's 2nd (Which had heavy rural involvement).
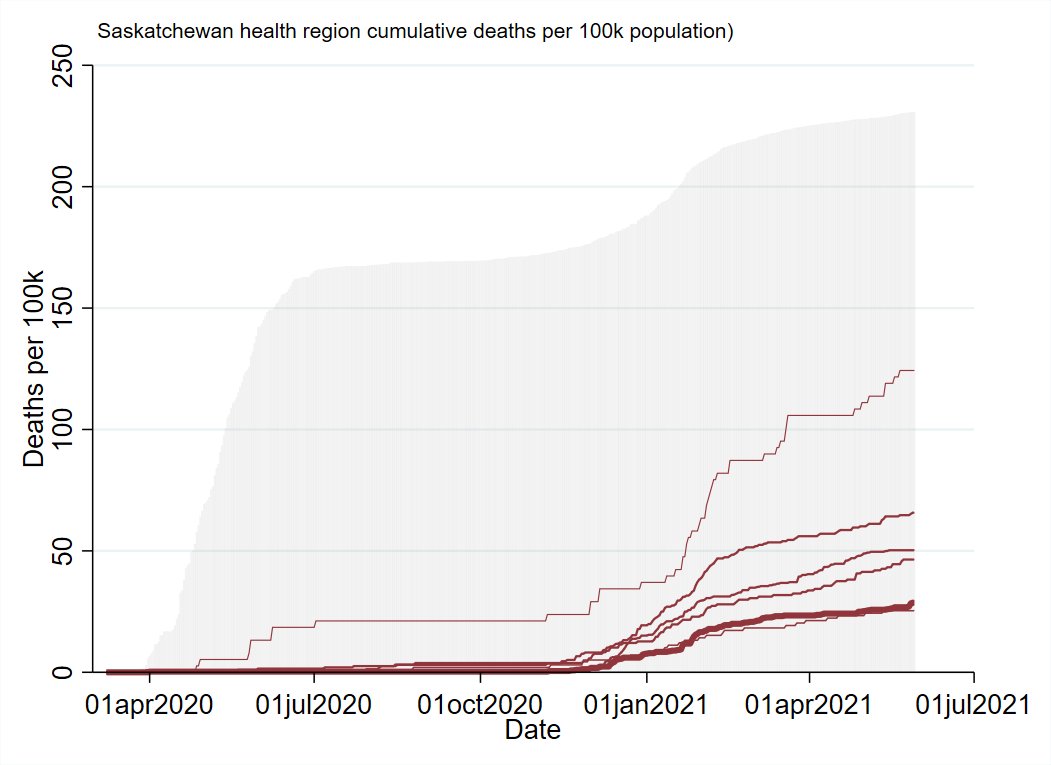
Deaths increased, but seemingly more in rural areas (top of the shaded area gets far away from the provincial line)
Northern SK is untouchable for cumulative cases per capita.
Deaths increased, but seemingly more in rural areas (top of the shaded area gets far away from the provincial line)
Northern SK is untouchable for cumulative cases per capita.


Manitoba's 3rd wave outbreak *just* hit it's crest and is starting to decline.
It was a bit of a mix in terms urban/rural involvement.
Deaths don't seem to have hit their peak, but are plainly muted compared to the 2nd wave.
It was a bit of a mix in terms urban/rural involvement.
Deaths don't seem to have hit their peak, but are plainly muted compared to the 2nd wave.


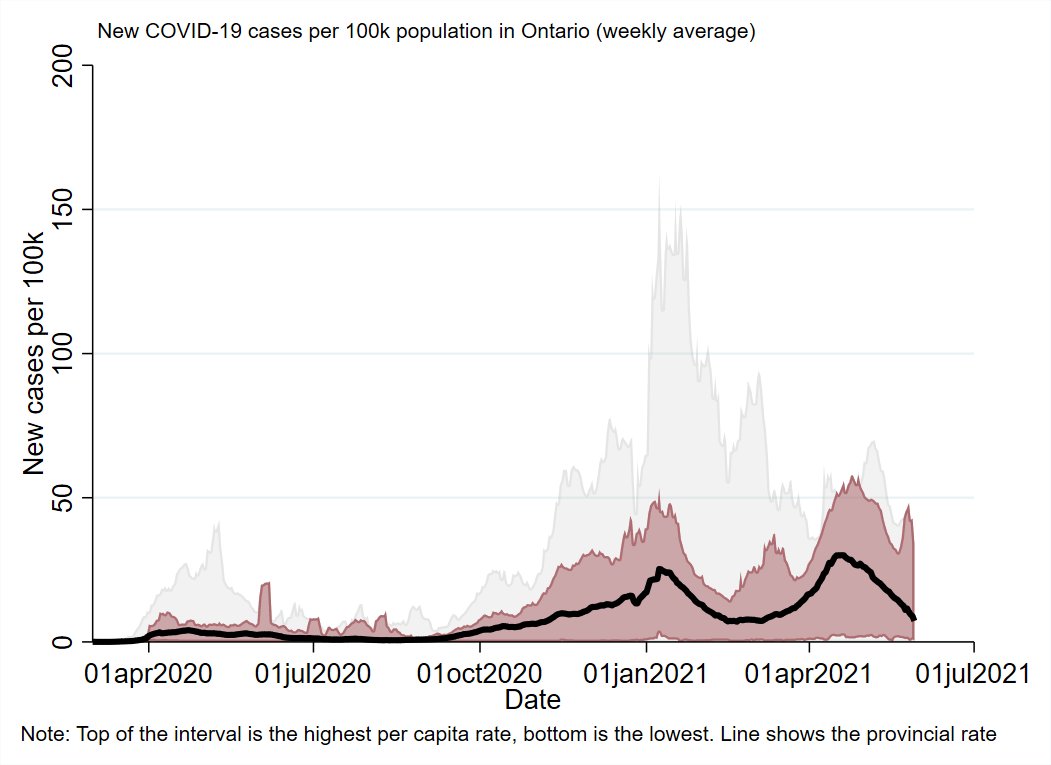
Ontario shows a lot of the same trend as the other provinces, with it's 3rd cresting a few weeks ago.
Some large outbreaks seem to have kicked off in some of the rural health regions recently.
Deaths increased, but at a substantially lower rate than previous outbreaks.
Some large outbreaks seem to have kicked off in some of the rural health regions recently.
Deaths increased, but at a substantially lower rate than previous outbreaks.


Quebec probably wins the Most Improved aware in terms of managing the 3rd wave.
There were fewer cases and correspondingly fewer deaths compared to previous waves.
Quebec's 3rd wave was a bit less centered on high-population health regions.
There were fewer cases and correspondingly fewer deaths compared to previous waves.
Quebec's 3rd wave was a bit less centered on high-population health regions.


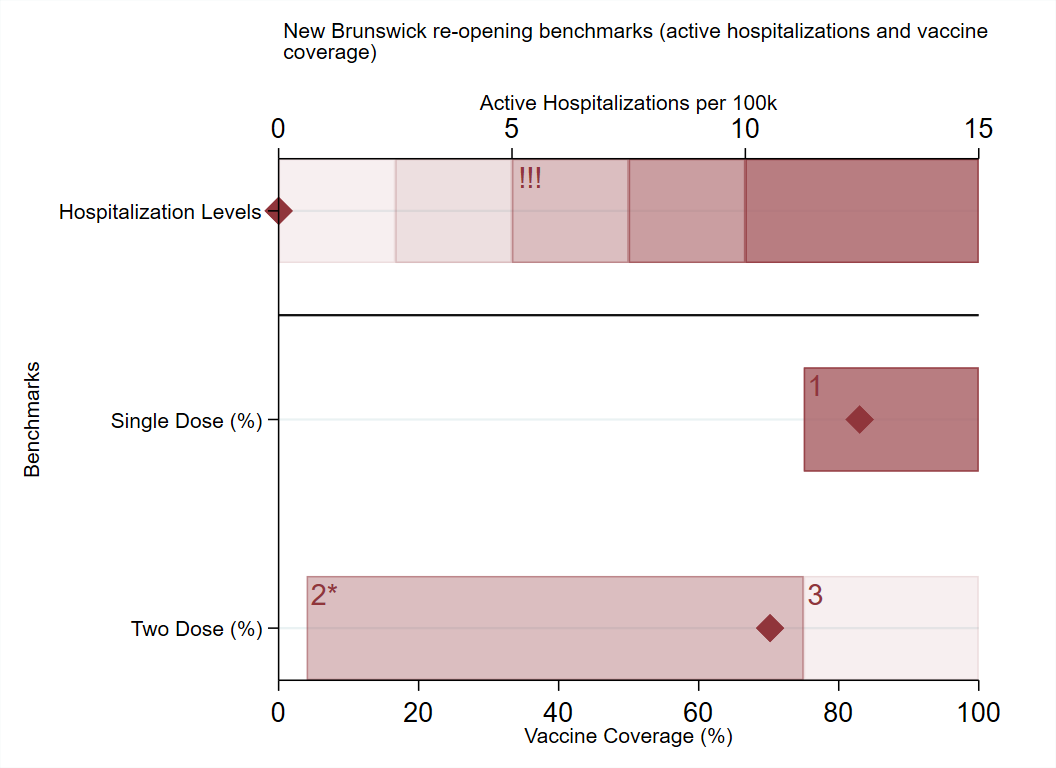
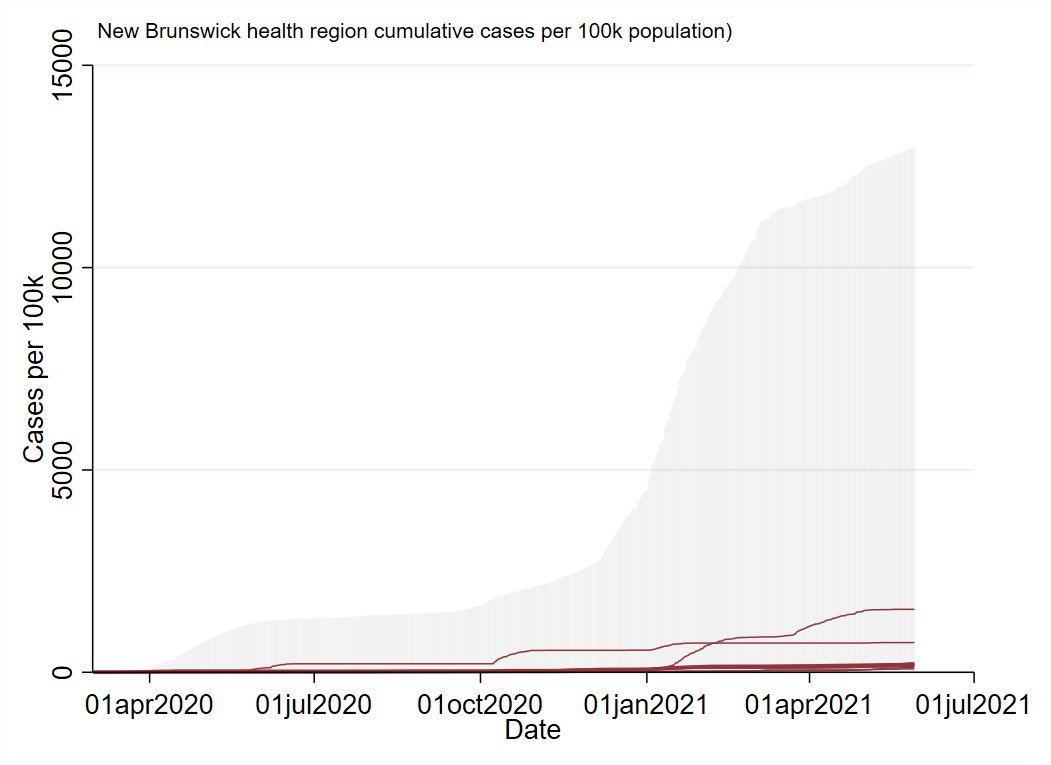
NB didn't really have any 'waves' during the pandemic, but instead spent the last 15 months putting out a series of brush-fire outbreaks.
It's... continuing to do so with a high level of success.
Edmundston remains the hardest hit part of NB by far.
It's... continuing to do so with a high level of success.
Edmundston remains the hardest hit part of NB by far.


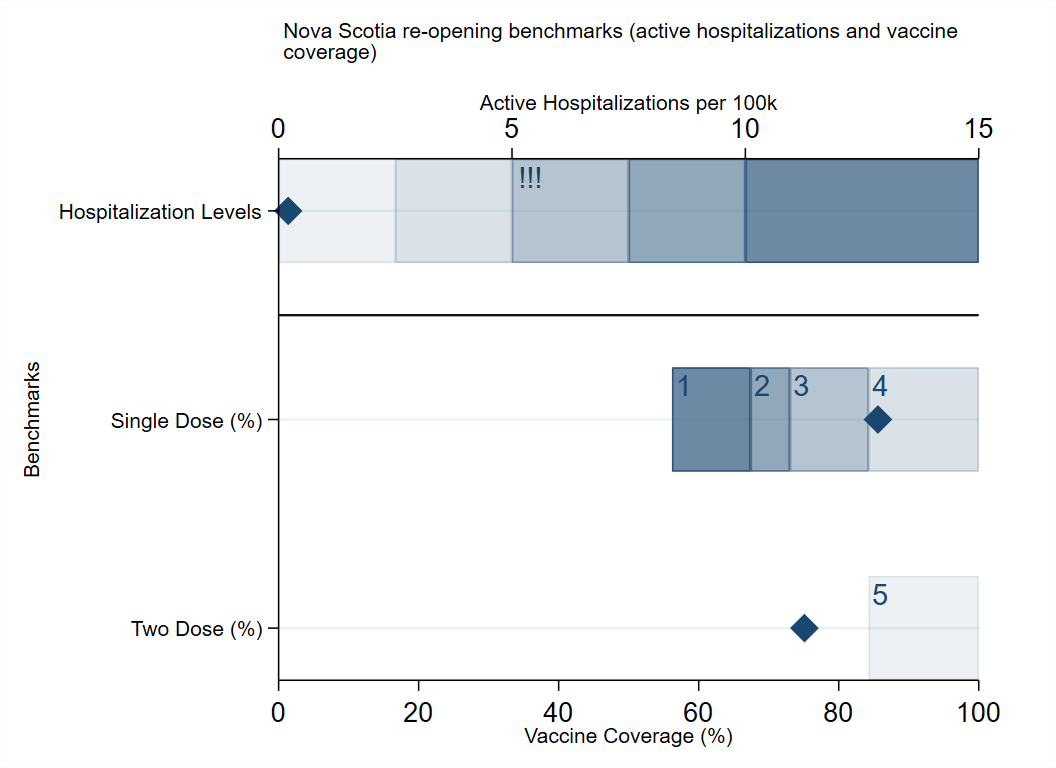
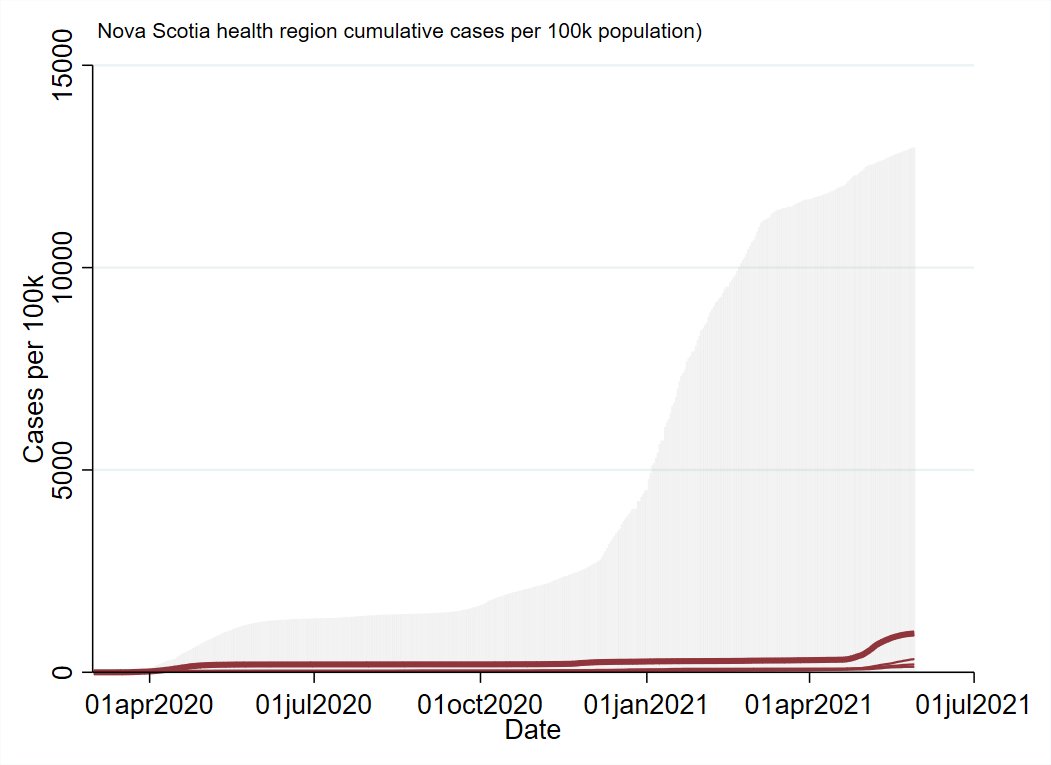
NS had an honest to goodness large outbreak centered in Halifax this month.
It's resolving relatively quickly, but there have now been almost 20 deaths associated with the outbreak.
It's resolving relatively quickly, but there have now been almost 20 deaths associated with the outbreak.


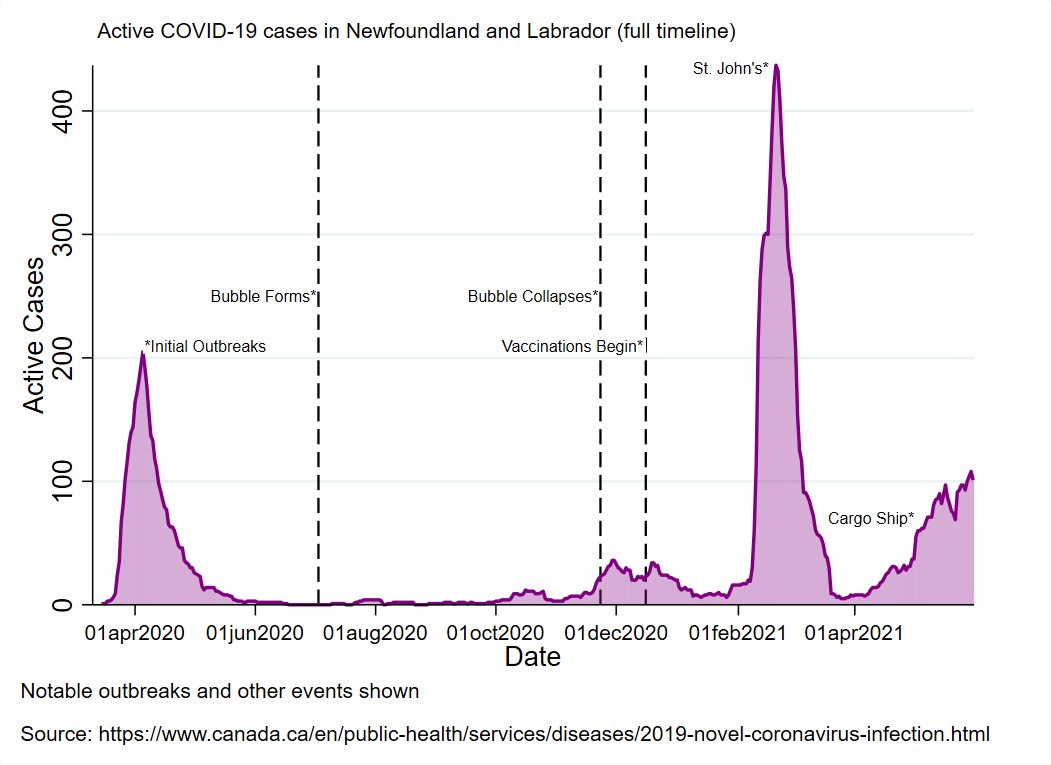
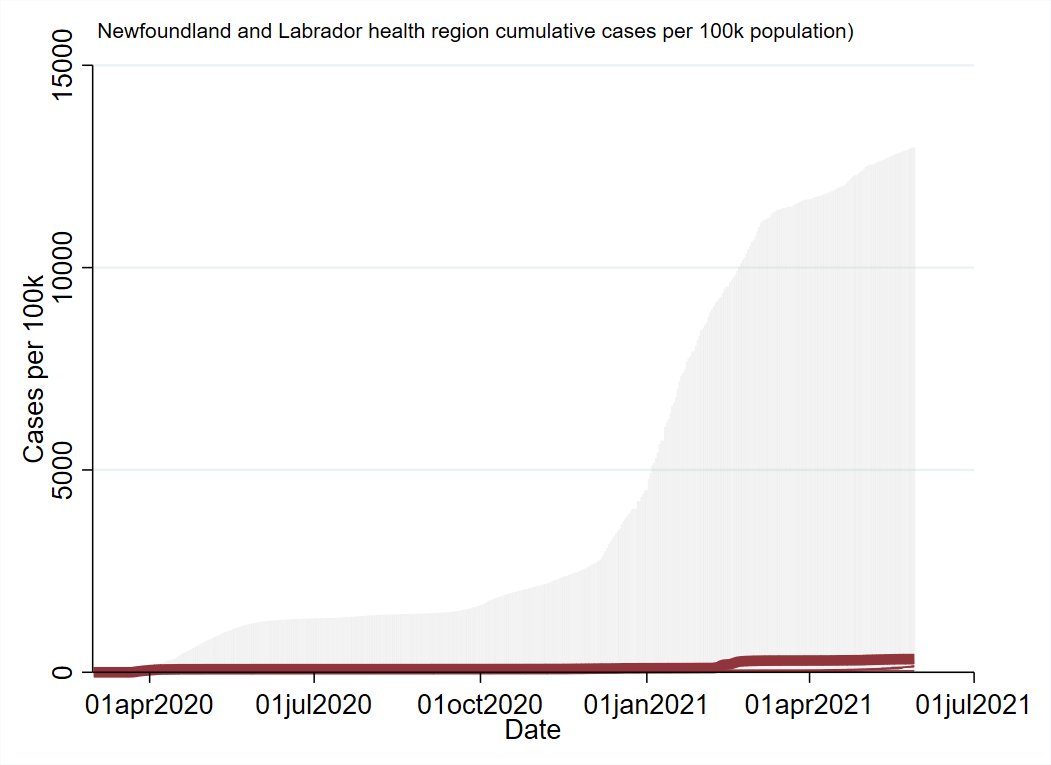
Newfoundland and Labrador likewise didn't have a big 3rd wave, but is currently dealing an outbreak in it's Central health region (small in absolute terms, medium in local per capita terms).
Still an ongoing outbreak.
Still an ongoing outbreak.

PEI likewise hasn't had any waves, or even a major outbreaks.
There have been a couple of single-location exposure events with secondary transmission that were resolved in 1-2 weeks.
Great stuff.
There have been a couple of single-location exposure events with secondary transmission that were resolved in 1-2 weeks.
Great stuff.


The Territories have been mostly quiet throughout the pandemic, dealing with relatively localized, smaller scale outbreaks.

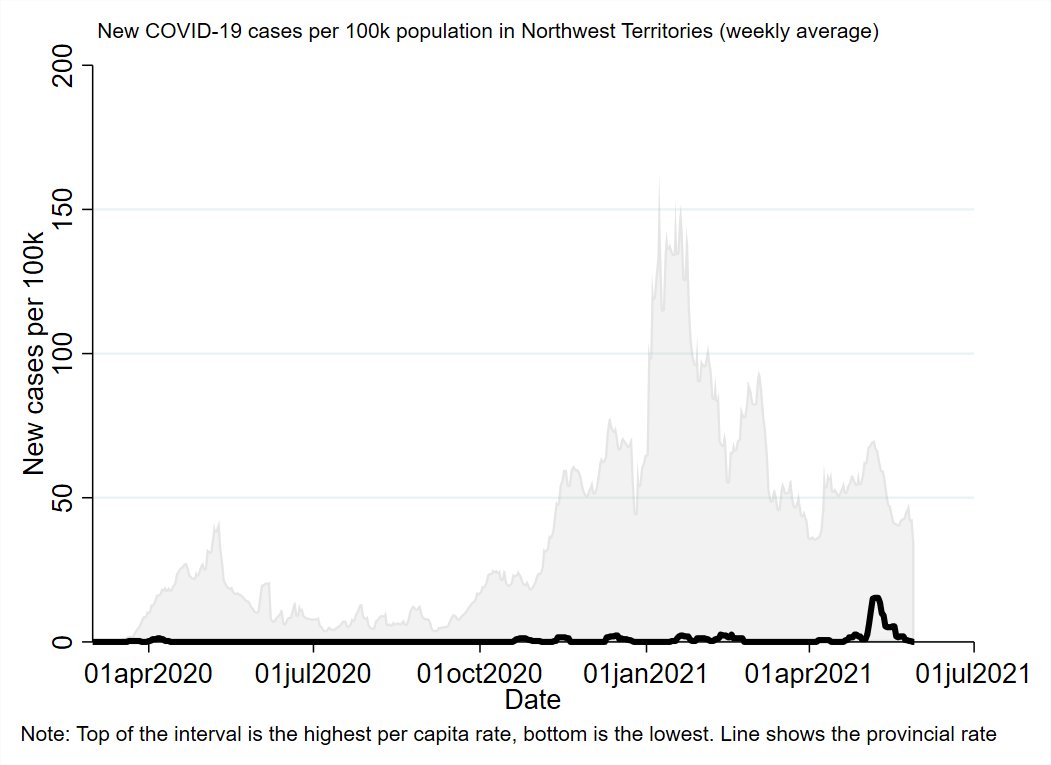
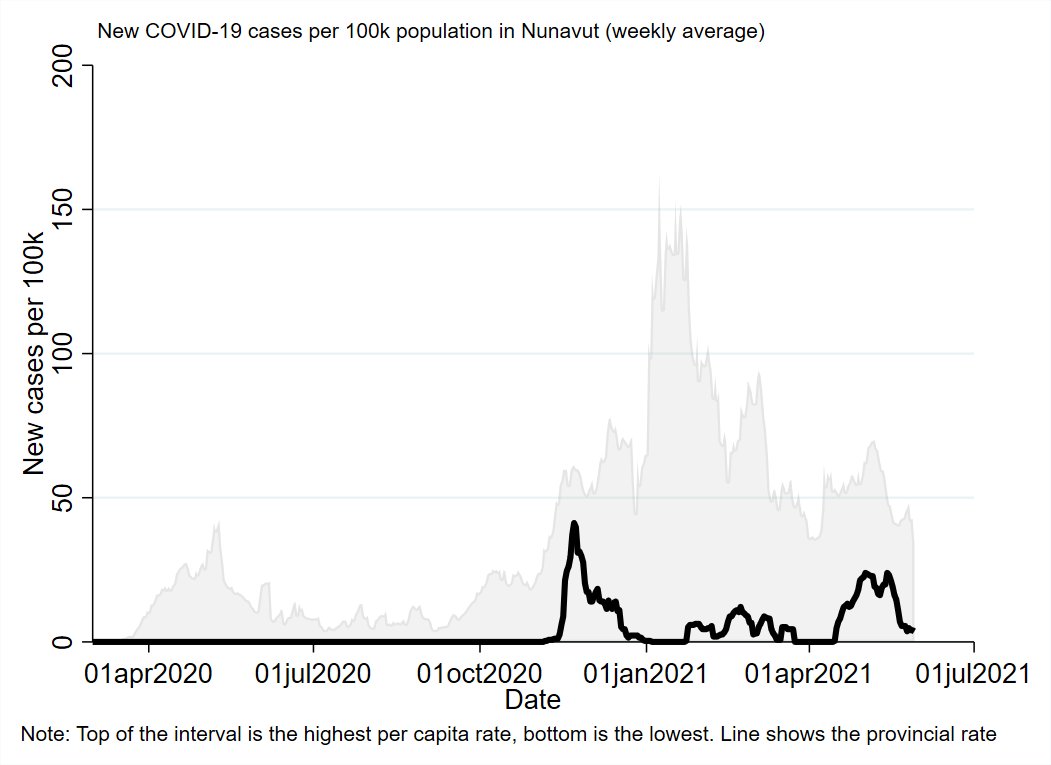
I literally can't spell anything.
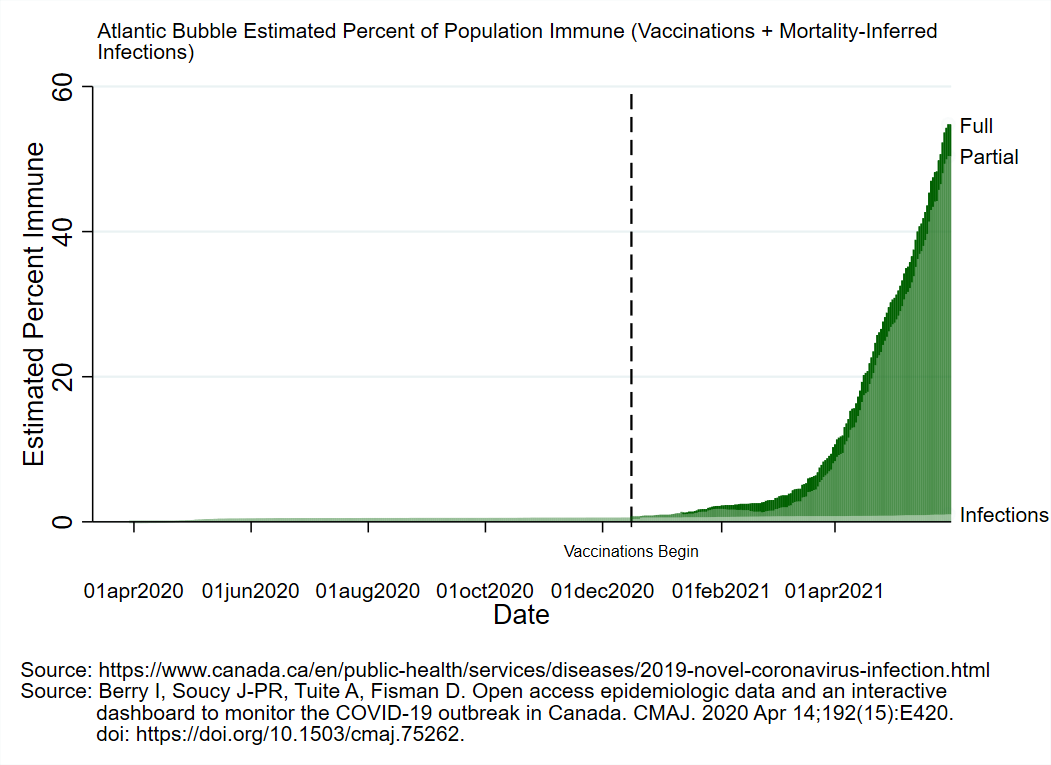
Quick summary of the 3rd wave in Canada is that it hit a lot of places at a time when the most vulnerable had some protection, but the vast majority of the population did not.
Result: Heavy burden on hospitals and a noticeable increase in deaths, but not as bad as past spikes
Result: Heavy burden on hospitals and a noticeable increase in deaths, but not as bad as past spikes
I.e., Vaccines work, folks. Get your shots.
Ok, that's the summary part.
The 2nd part is always a bit more technical and this one is probably worse than usual.
Wait! Don't run away! I'll walk you through the stats.
The 2nd part is always a bit more technical and this one is probably worse than usual.
Wait! Don't run away! I'll walk you through the stats.
So far all the more in depth analyses I've done in past monthly updates have been at the health-region level (the sub-provincial geographic units).
This time, it's at the outbreak level within each health region. How does each individual outbreak play out? And why?
This time, it's at the outbreak level within each health region. How does each individual outbreak play out? And why?
Step 1: Define and identify major outbreaks.
I can't go through all 92 health regions and manually define major outbreaks. So I wrote a program that looks for peaks of at least 5 cases per 100k (running average).
Below that? Not a major outbreak. A higher peak nearby? Same.
I can't go through all 92 health regions and manually define major outbreaks. So I wrote a program that looks for peaks of at least 5 cases per 100k (running average).
Below that? Not a major outbreak. A higher peak nearby? Same.
This *mostly* gets you what you would expect. A lot of places had 3 identifiable peaks/outbreaks. Some only had 2 because they more or less skipped the 1st wave.
The only real counter-intuitive thing I found was that Halifax didn't have a 2nd wave major outbreak.
"But there were cases, and a lockdown!"
Yes. But it never peaked above 5 cases per 100k. It was an outbreak, but not a major one.
"But there were cases, and a lockdown!"
Yes. But it never peaked above 5 cases per 100k. It was an outbreak, but not a major one.
But that's pretty much it. Everything else is about what you'd get from manually coding peaks on a timeline.
Speaking of, here is a timeline of when the peaks happened. This doesn't show how severe the outbreaks were, just how many of them were hitting peak at a time.
Speaking of, here is a timeline of when the peaks happened. This doesn't show how severe the outbreaks were, just how many of them were hitting peak at a time.

The number of major outbreaks wasn't evenly distributed across the country. Here it is mapped out for each of the health regions from west to east.


And where there's variability, we can look for ways to explain that variability.
To do this, I'm using a statistical approach called survival analysis.
The core concept is that you're measuring the time until some event happens. Until that event happens, you 'survive'.
To do this, I'm using a statistical approach called survival analysis.
The core concept is that you're measuring the time until some event happens. Until that event happens, you 'survive'.
Survival in this context isn't necessarily good. A common example would be a study to test a therapy to get you to quit smoking.
If you continue smoking, you 'survive'. Once you quit smoking, you 'fail'.
In this context, a health regions 'survives' until it has an outbreak.
If you continue smoking, you 'survive'. Once you quit smoking, you 'fail'.
In this context, a health regions 'survives' until it has an outbreak.
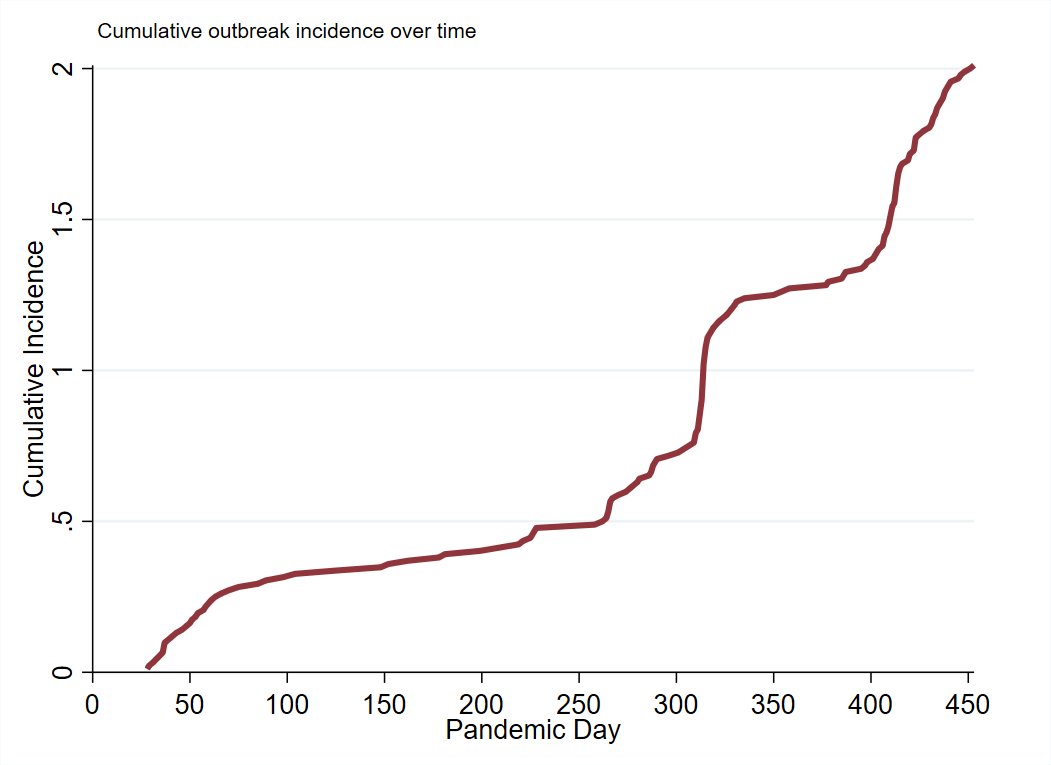
Simplest thing first, here is a timeline from 01MAR2020 of how may health regions have had at least one major outbreak.
Once they have their first, they aren't double counted.
You can clearly see when the 'waves' happened, causing more first-outbreaks.
Once they have their first, they aren't double counted.
You can clearly see when the 'waves' happened, causing more first-outbreaks.

Over time, almost every region has had at least one major outbreak (11/92 remain that haven't).
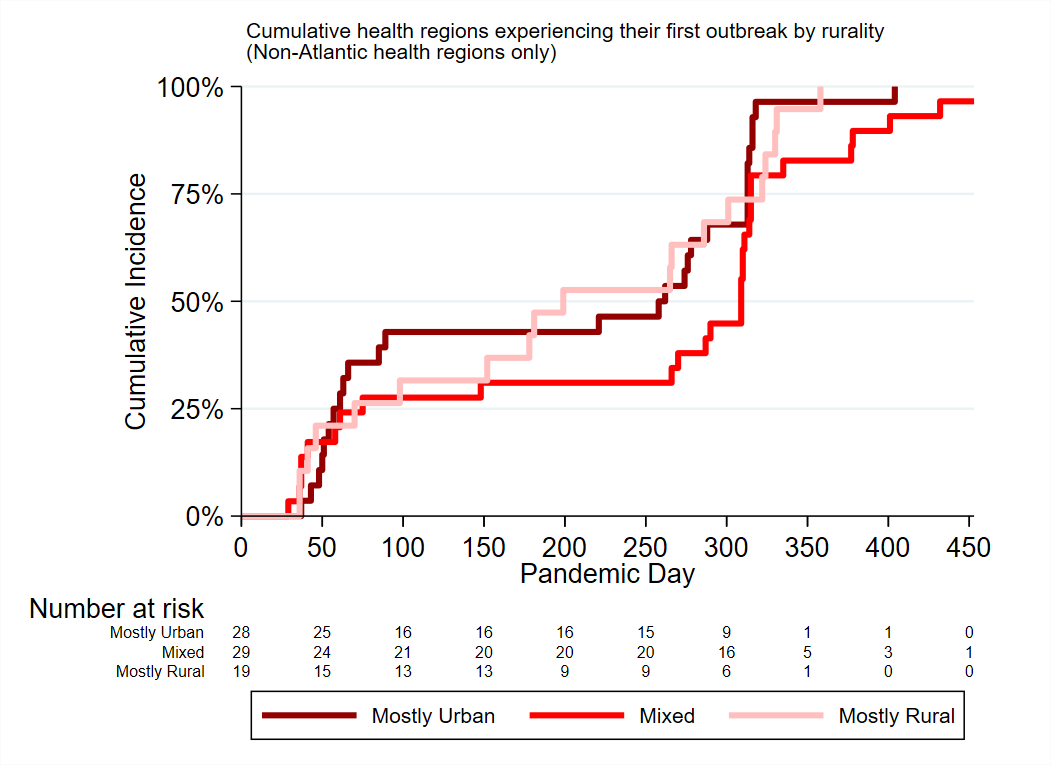
I grabbed some census data and here's the timeline split up by how rural the health regions are.
More urban areas fail sooner, more rural regions later.
I grabbed some census data and here's the timeline split up by how rural the health regions are.
More urban areas fail sooner, more rural regions later.

How does the Atlantic region compare?
The difference is a bit more stark. Most of the Atlantic health regions haven't yet experienced a major outbreak.
The difference is a bit more stark. Most of the Atlantic health regions haven't yet experienced a major outbreak.

To give a sense of scale: for every 1% of the population that lives in a rural setting, the odds of having a major outbreak goes down by a bit over 2%.
Being in the Atlantic region decreases the odds of having ever had a major outbreak by just under 90%.
Being in the Atlantic region decreases the odds of having ever had a major outbreak by just under 90%.
You can tease out the effects of rural population from the Atlantic region a couple of different ways.
The simplest is just to see of rural population is protective against major outbreaks *outside* the Atlantic region.
The short answer is: No, it doesn't matter.
The simplest is just to see of rural population is protective against major outbreaks *outside* the Atlantic region.
The short answer is: No, it doesn't matter.
The 2nd approach is to model the protective effects of a health region being in Atlantic Canada assuming an equivalent degree of rurality.
Basically try to make Atlantic/Rest of Canada the same on rural population, and see how they compare.
Still a big difference.
Basically try to make Atlantic/Rest of Canada the same on rural population, and see how they compare.
Still a big difference.

So having a more rural population is protective against ever having had a major outbreak, but only for those health regions in Atlantic Canada.
Otherwise it doesn't help.
Otherwise it doesn't help.
Of course, most places have had several outbreaks, no just one.
We can do the same type of analysis looking at how many outbreaks each health region has had.
We can do the same type of analysis looking at how many outbreaks each health region has had.
Rural population share *mostly* hasn't mattered, but the lines diverge for the period encompassing the 3rd wave.

And here's the cumulative number of outbreaks by region.
It looks a lot like the other set.
Atlantic health regions had 80% lower odds for the recurring risk of having a major outbreak.
After parsing out the effects of rurality, 76% lower odds.
It looks a lot like the other set.
Atlantic health regions had 80% lower odds for the recurring risk of having a major outbreak.
After parsing out the effects of rurality, 76% lower odds.

Unlike with the single-outbreak analysis, rural population share is actually protective of having multiple outbreaks even outside of Atlantic Canada.
So Atlantic Canada has ~75% lower odds of major outbreak events than would be expected based on how rural the population is.
There's more.
Our outbreaks are... weird.
Here's the average outbreak trajectory in Canada (all peaks set to 100%), and then split by region.
There's more.
Our outbreaks are... weird.
Here's the average outbreak trajectory in Canada (all peaks set to 100%), and then split by region.
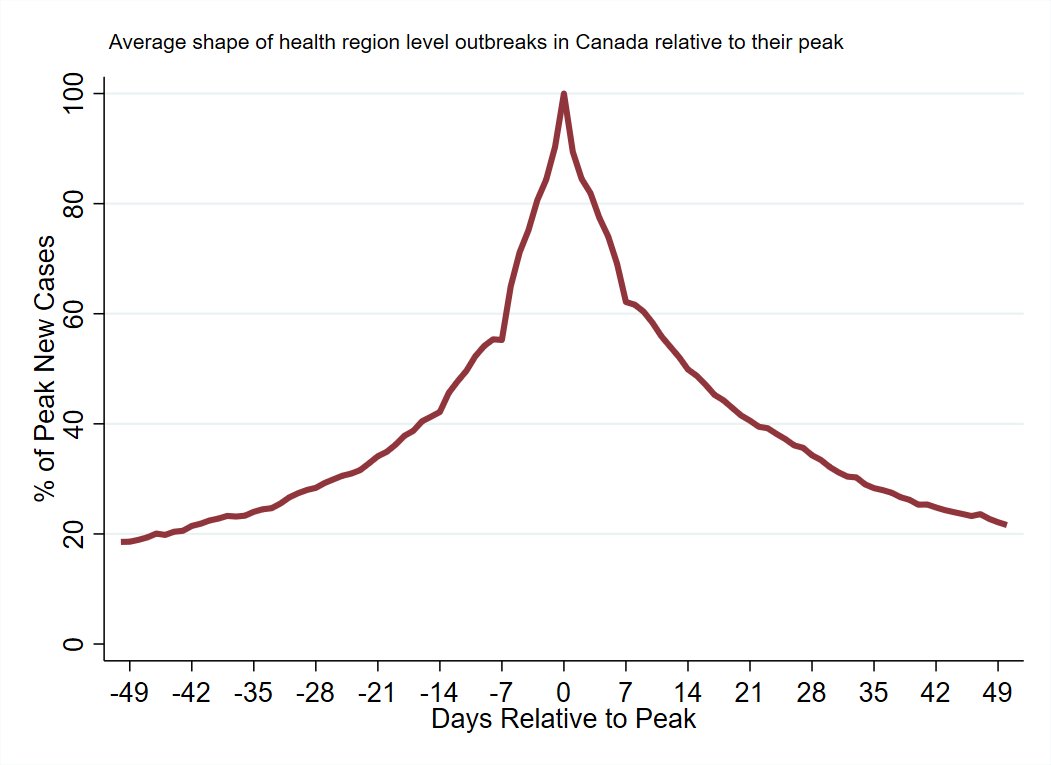

You can think of major outbreaks in the rest of the country as a slow rolling wave.
In the Atlantic health regions they tend to be more like spikes. They start 1-2 weeks before peak and then sharply drop in the subsequent 2-3 weeks.
In the Atlantic health regions they tend to be more like spikes. They start 1-2 weeks before peak and then sharply drop in the subsequent 2-3 weeks.
So for this part, I'm going to try to describe outbreak resolutions.
I consider a major outbreak resolved for the purposes of this analysis if cases per capita dip below 2.5 per 100k. Whenever that first happens, that's the end.
It's a low, achievable bar.
I consider a major outbreak resolved for the purposes of this analysis if cases per capita dip below 2.5 per 100k. Whenever that first happens, that's the end.
It's a low, achievable bar.
In Canada's 92 health regions there have been a total of 185 major outbreak events (peak > 5 cases per 100k).
Of those, 92 eventually resolved and 93 didn't (either because they timed-out in the data [hit present-day] or were superseded by another outbreak).
Of those, 92 eventually resolved and 93 didn't (either because they timed-out in the data [hit present-day] or were superseded by another outbreak).
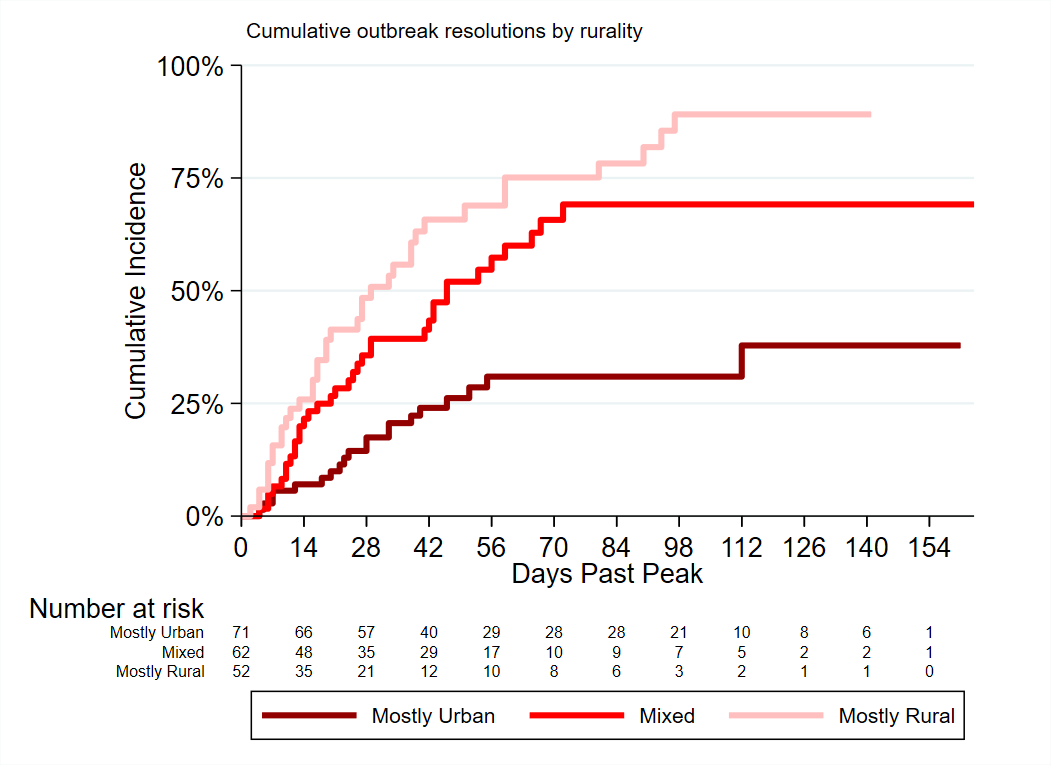
Here's the percent of outbreaks successfully resolving, starting counting once the outbreak hits its peak.
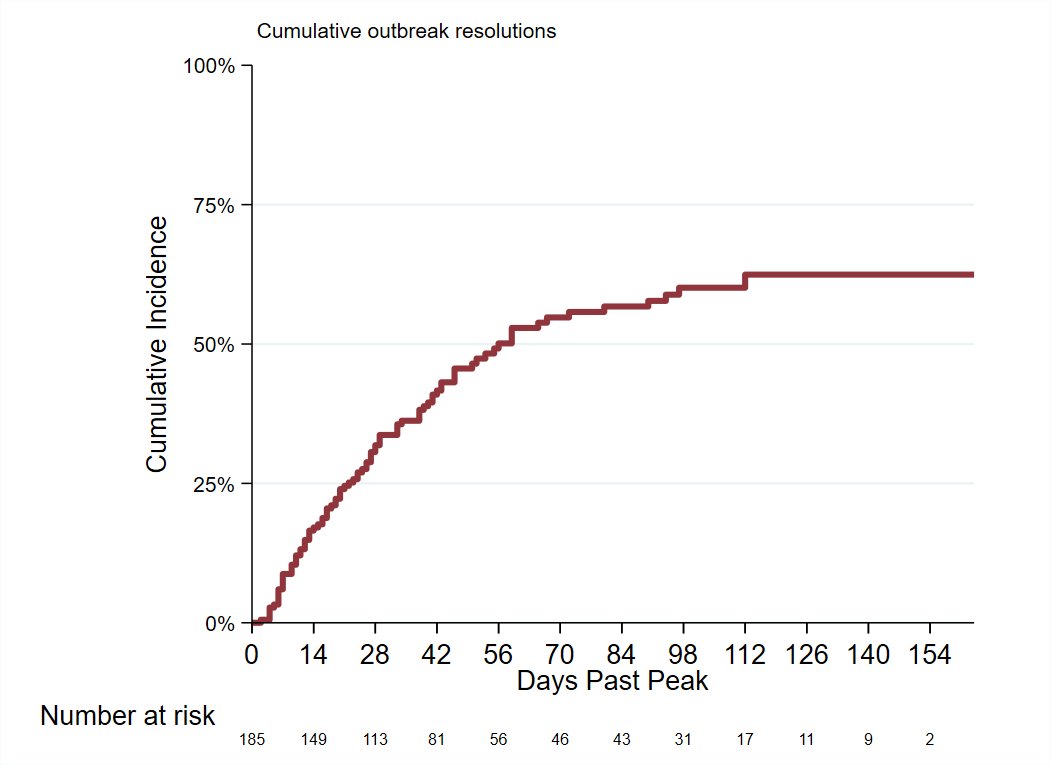
How rural the population is and (not surprisingly) how large the outbreak is seem to play major roles in determining how likely an outbreak is to eventually resolve, and how long that takes.
More urban population and larger outbreaks make it harder to resolve quickly/at all.
More urban population and larger outbreaks make it harder to resolve quickly/at all.

Atlantic health regions have fewer outbreaks, but are they any better at resolving them?
Yes.
The odds of a major outbreak successfully resolving are ~340% higher in Atlantic Canada vs the rest of the country.
Half resolve in 2 weeks, all by 6 weeks (so far).
Yes.
The odds of a major outbreak successfully resolving are ~340% higher in Atlantic Canada vs the rest of the country.
Half resolve in 2 weeks, all by 6 weeks (so far).

Atlantic region outbreaks tend to happen in more rural areas and have smaller peaks, so plausibly some of that difference is due to those factors.
If I model-out the effects of rural population and outbreak size, the gap is smaller but still quite large.
If I model-out the effects of rural population and outbreak size, the gap is smaller but still quite large.

Adjusting for the effects of rural population share drops the effect of an outbreak being in the Atlantic region on successful resolution from 340% increased odds to 200% increased odds relative to the rest of the country.
All of which is just a way of saying that all the work you've been putting in this year has made a big difference.
Outbreaks are much more rare, and resolve weeks/months faster than they do in the rest of the country, on average (see maps - average time to resolution in weeks)
Outbreaks are much more rare, and resolve weeks/months faster than they do in the rest of the country, on average (see maps - average time to resolution in weeks)


That's fewer people getting infected, going to the hospital, and dying.
But it's also fewer times where increased restrictions are necessary and when they can be reduced sooner.
Anyways, that's it for this monthly update.
*dips hands in ice*
But it's also fewer times where increased restrictions are necessary and when they can be reduced sooner.
Anyways, that's it for this monthly update.
*dips hands in ice*
• • •
Missing some Tweet in this thread? You can try to
force a refresh