A thread about NVT, one of the first on-chain signals first published in Feb 2017.
This is a 2021 re-hash of my NVT learnings since then.
"How to use on-chain volume to establish a fundamental valuation for Bitcoin."
This is a 2021 re-hash of my NVT learnings since then.
"How to use on-chain volume to establish a fundamental valuation for Bitcoin."

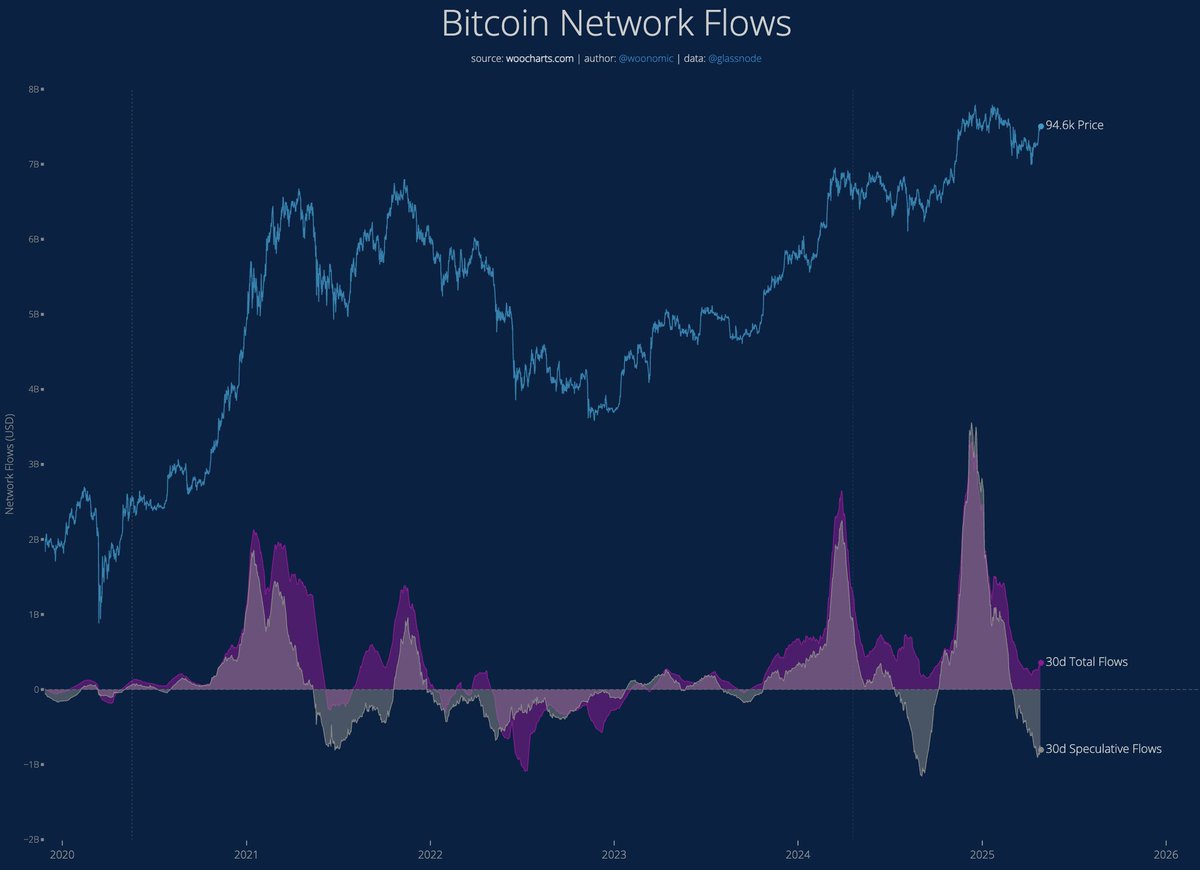
Ever seen this chart of BTC's on-chain volume vs its market cap and wondered why they track so closely?
On-chain volume measures the amount of money moving between investors as seen on the blockchain per day. It's highly correlated to market cap.
But why?
On-chain volume measures the amount of money moving between investors as seen on the blockchain per day. It's highly correlated to market cap.
But why?

Let's lay down a first principles equation for a pure store of value network:
value moving between investors = value of the network * how much the money supply churns
In short form:
I = M * V
where:
I = Value moving between investors
M = Market Cap
V = Monetary Velocity
value moving between investors = value of the network * how much the money supply churns
In short form:
I = M * V
where:
I = Value moving between investors
M = Market Cap
V = Monetary Velocity
I = M * V
In other words:
M = I * (1/V)
Market cap should fundamentally be proportional to the volume moving between investors.
The co-efficient of proportionality is inverse monetary velocity.
Aha, that's why these 2 lines track each other.
In other words:
M = I * (1/V)
Market cap should fundamentally be proportional to the volume moving between investors.
The co-efficient of proportionality is inverse monetary velocity.
Aha, that's why these 2 lines track each other.

Just like we can estimate the valuation of a company by looking at its earnings and multiplying by the expected PE Ratio for its category of company, we can do the same for Bitcoin... but instead of using PE Ratio and earnings, for Bitcoin we use NVT Ratio and investor volume.
I just introduced NVT Ratio.
NVT Ratio is inverse monetary velocity, the co-efficient of proportionality that we can multiple volume by to get market cap.
NVT Ratio is inverse monetary velocity, the co-efficient of proportionality that we can multiple volume by to get market cap.

NVT oscillates around an imaginary mid-line. That mid-line is in effect the normal ratio that we should multiply volume by to get its valuation.

Oscillations below and above the middle region indicate the market is undervaluing or over valuing the network respectively.

Notice how NVT is drifting upwards? This is because not all of the investment volume has been accounted for, volume has been moving off the blockchain as exchange dominance increases.

We can actually see the dominance of exchanges increase in big jumps since 2017.
Exchange user count data via surveys by @CambridgeAltFin, while on-chain user count via forensic clustering of BTC addresses by @glassnode.
Exchange user count data via surveys by @CambridgeAltFin, while on-chain user count via forensic clustering of BTC addresses by @glassnode.
https://twitter.com/woonomic/status/1356310219215699968?s=20
Putting it all together. We run a 2 year moving median of NVT Ratio, that gets us an estimate of the mid-line value also accounting for the drift upwards due to the missing exchange activity. Multiply this by the on-chain volume, and we get a fundamental network valuation.

Original NVT article:
woobull.com/introducing-nv…
Fun fact, this article was originally published in Forbes. @laurashin was the crypto editor there at the time and she approached me to write for them. I never did continue. Not long after, she went on to launch her amazing podcast.
woobull.com/introducing-nv…
Fun fact, this article was originally published in Forbes. @laurashin was the crypto editor there at the time and she approached me to write for them. I never did continue. Not long after, she went on to launch her amazing podcast.
Live charts available here...
NVT Price and NVT Premium:
charts.woobull.com/bitcoin-nvt-pr…
NVT Ratio:
charts.woobull.com/bitcoin-nvt-ra…
NVT Signal:
charts.woobull.com/bitcoin-nvt-si…
NVT Price and NVT Premium:
charts.woobull.com/bitcoin-nvt-pr…
NVT Ratio:
charts.woobull.com/bitcoin-nvt-ra…
NVT Signal:
charts.woobull.com/bitcoin-nvt-si…

• • •
Missing some Tweet in this thread? You can try to
force a refresh