Eric Profile picture
Jun 1, 2021 19 tweets 7 min read Read on X
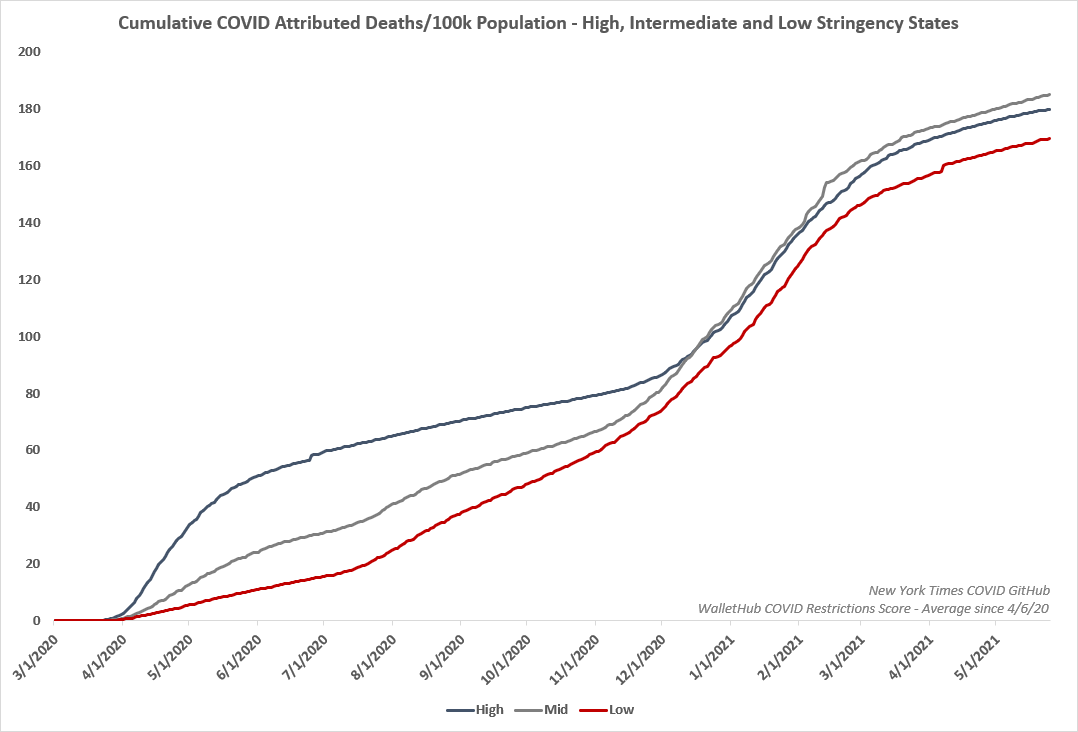
1/ With the pandemic finally, thankfully winding down in the US, I thought I'd compare the COVID death curves of high, intermediate and low-stringency states. Despite a large surge in Spring 2020, the high-stringency states still saw a similar surge this past winter.
2/ Looking at COVID deaths cumulatively, high, intermediate and low-stringency states performed about the same. It may be tempting to say low-stringency states performed "better", but it's more honest to say there's really no statistical difference between the three.
3/ And, if you like your charts very busy, here is a graph with both daily and cumulative COVID deaths per 100k, plus a map displaying what category each state falls in based on WalletHub's methodology.
4/ It's obvious over the past 15 months that the COVID pandemic response has been extremely political. When you organize the high, intermediate and low-stringency states by its governor's party, there is an obvious trend - D governors = strict policy, R governors = lax policy.
5/ This is obviously a problem. Hopefully we can all agree political bias should not drive scientific consensus or policy - but one's opinions on nearly every COVID issue, whether it's masks, school closures, lockdowns etc. have mostly aligned with one's political party.
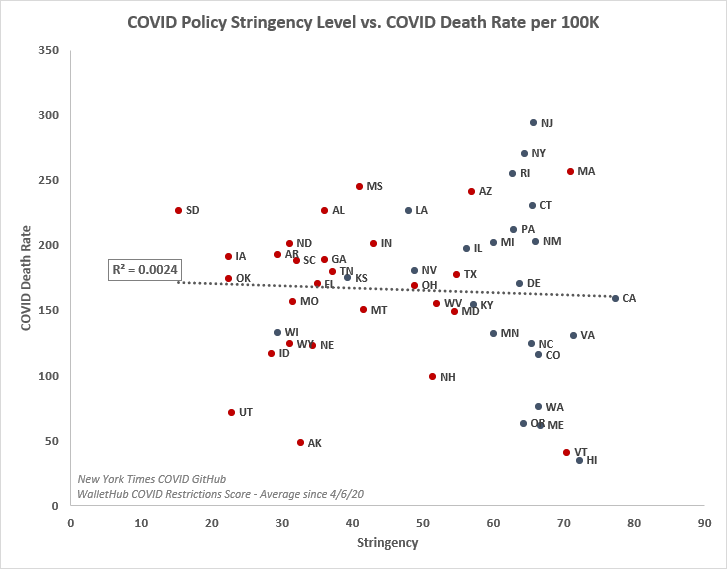
6/ Politics drove COVID policy - but did more stringent policies lead to improved outcomes? Plotting a state's average stringency vs. it's death rate, it's very obvious a) republican-led states were less stringent, and b) there is no relation between stringency and death rates.
7/ A common narrative over the past year was "we need to lock down/tighten our COVID policies to help the economy recover faster" - yet there is a very clear correlation between more lax COVID policies and stronger economic recovery.
8/ Policy didn't do much to affect the pandemic curve. So what actually did?

You can see the most stringent states' populations actually tend to be farther north (higher latitude), intermediate are in the middle, and less stringent states tended to be south (lower latitude)
9/ Based on Hope-Simpson seasonality one can assume that the farther north you are, the more you will align with the "North Temperate" pandemic curve. Here is the Hope-Simpson N. Temperate curve compared to the strict (high latitude) COVID death curve (h/t @Hold2LLC)
10/ The intermediate states were the most "in-between" north temperate and north tropical, so here is their death curve compared to the Hope-Simpson combined N. Temperate/N. Tropical seasonal curve.
11/ And finally, the low-stringency states (mostly Southern and Sun Belt states) had the lowest average latitude. You can see they saw increased activity in the summer with a peak in winter - similar to what Hope-Simpson observed years ago.
12/ While you can see a pattern based on stringencies organized by latitude, you get a much clearer pattern when organizing strictly by region. Here are population-adjusted COVID hospitalizations in the Midwest (with average highlighted).
13/ And the Sun Belt/South.
14/ And the Northeast.
15/ And here they are on the same plot.
16/ So COVID policy didn't affect pandemic trajectory, but seasonal/regional factors did. Yet for some reason scientific elites continue to perpetuate the lie that lockdowns etc. drive down infections - despite continually mounting evidence to the contrary
17/ A lot of this probably comes from the human tendency to want to think we are in control, when in reality we aren't. And, unfortunately, this human vanity project came with catastrophic cost, and virtually no benefit. telegraph.co.uk/news/2021/05/3…
18/ And therein lies a big problem - the same people who pushed for lockdowns, school closures etc. over the past year are now professionally incentivized to downplay the harms of the policies they advocated for while exaggerating their efficacy. They need to be held accountable.
19/ This is why the work of organizations like @collateralglbl is so important - tracking the devastation from these policies, whether it's exacerbating hunger, delaying preventative treatments, worsening mental health, etc. - we need to make sure lockdowns are never used again.

• • •

Missing some Tweet in this thread? You can try to force a refresh
 

Keep Current with Eric

Eric Profile picture

Stay in touch and get notified when new unrolls are available from this author!

Read all threads

This Thread may be Removed Anytime!

PDF

Twitter may remove this content at anytime! Save it as PDF for later use!

Try unrolling a thread yourself!

how to unroll video
  1. Follow @ThreadReaderApp to mention us!

  2. From a Twitter thread mention us with a keyword "unroll"
@threadreaderapp unroll

Practice here first or read more on our help page!

More from @The_OtherET

Jun 22, 2022
There is a false narrative emerging based on weak/little evidence that is attempting to blame the current issues around air travel on the removal of mask mandates. This is despite there being minimal disruptions for *two months* post-mandate and no documented outbreaks. 1/🧵
2/ As some of you know I've been periodically tracking flight disruptions for a while post-mandate. This was over a month after the mandate was removed. No issues:

3/ Compare this to over the holidays during the winter/omicron surge, where there were mass cancellations that airlines explicitly said were due to staff out with COVID. This was, of course, while the mask mandates were still in place. nytimes.com/2021/12/25/bus…
Read 15 tweets
Jan 30, 2022
1/ It's nearly February 2022 and people are still posting flu data suggesting masks, distancing etc. virtually eliminate influenza. Seasonal viruses "disappearing" is something that has happened previously during other pandemics/epidemics, regardless of policy. This isn't new. 🧵
2/ It is true that in the United States, flu prevalence dropped dramatically once mask wearing became slightly more common (from 58% -> 70%) - but this is a spurious correlation that doesn’t hold up when looking at areas where masking is not-so-common.
3/ Based on the chart above, one could assume that when community masking reaches some threshold, flu prevalence drops dramatically. Yet, looking at influenza surveillance for high-mask areas like New York (86%) and low-mask areas like South Dakota (42%), you see the same trend.
Read 12 tweets
Jan 10, 2022
1/ This ordinance proposal that I just read out of Jackson County, MO is truly insane. It essentially grants unilateral authority to the Jackson County Health Department. It would basically create a public health dictatorship.
2/ The health department (ominously labeled 'The Director' in this draft) can implement any public health measures they deem necessary in public and private schools as well as child care facilities, including "exclusion of people with suspected illnesses".
3/ The Director has the power to close any public or private school if they deem it a public health threat. They can close any place of public or private assembly. Presumably, this also includes churches. They cannot reopen unless The Director deems it safe.
Read 11 tweets
Dec 29, 2021
This thread is chock-full of self-contradictions and a complete misrepresentation of the physics of fine aerosols, as well as a misunderstanding of how the NIOSH hierarchy of controls works and what types of PPE it represents.
The transmission dynamics of airborne particles are far from "basic physics", but Joseph misleads people here by suggesting we're still dealing with large droplets that predictably fall to the ground. Look up Stokes law Joseph. Strike 1.
Joseph says he was one of the first people to call for masks in this Washington Post article.

In it, he once again talks about "droplets" and suggests fomite transmission is a major threat (it isn't). Bizarre that he'd still share this article. Strike 2.
Read 8 tweets
Dec 4, 2021
1/ An article/chart that suggest the state of Missouri's health dept suppressed data that "found masks work" has been making the rounds lately with a few particular posts getting thousands of likes and retweets. In reality, the data completely contradict what they're saying.
2/ First, the timeline they chose was completely arbitrary and includes a significant portion of time when both groups did not have mandates in place. The case numbers started diverging *two months* before the first mask mandates started, suggesting significant confounders.
3/ But what if people started wearing masks prior to mandates? The data don't support that - the number of people wearing masks only significantly increased after the mandates started. delphi.cmu.edu/covidcast/indi…
Read 9 tweets
Aug 30, 2021
1/ The letter the US DOE sent today to several states saying they are opening an investigation into their ban on school mask mandates is dangerous and misguided. Their main claim is that banning mask mandates in schools creates an unsafe environment for at-risk kids.
2/ They open the letter by saying cases are rising in both the US population and school-aged children - which is true but has nothing to do with masks in schools. They mention rising hospitalizations in kids but fail to mention we are seeing an enormous out-of-season RSV spike.
3/ Additionally, other countries that experienced a delta wave such as the UK did not see rising pediatric hospitalization rates. It doesn't make much sense that delta would be uniquely dangerous to US kids. COVID co-infection with RSV could explain this.
Read 16 tweets

Did Thread Reader help you today?

Support us! We are indie developers!


This site is made by just two indie developers on a laptop doing marketing, support and development! Read more about the story.

Become a Premium Member ($3/month or $30/year) and get exclusive features!

Become Premium

Don't want to be a Premium member but still want to support us?

Make a small donation by buying us coffee ($5) or help with server cost ($10)

Donate via Paypal

Or Donate anonymously using crypto!

Ethereum

0xfe58350B80634f60Fa6Dc149a72b4DFbc17D341E copy

Bitcoin

3ATGMxNzCUFzxpMCHL5sWSt4DVtS8UqXpi copy

Thank you for your support!

Follow Us!

:(