I know it seems like there is a lot happening on the @unusual_whales website, so I will try to highlight some of the sections that may not get as much attention as others.
You can configure your notification settings anyway you like. Here are some examples. To receive push notifications you will need to download the mobile application (Unusual Whales). unusualwhales.com/settings/notif…
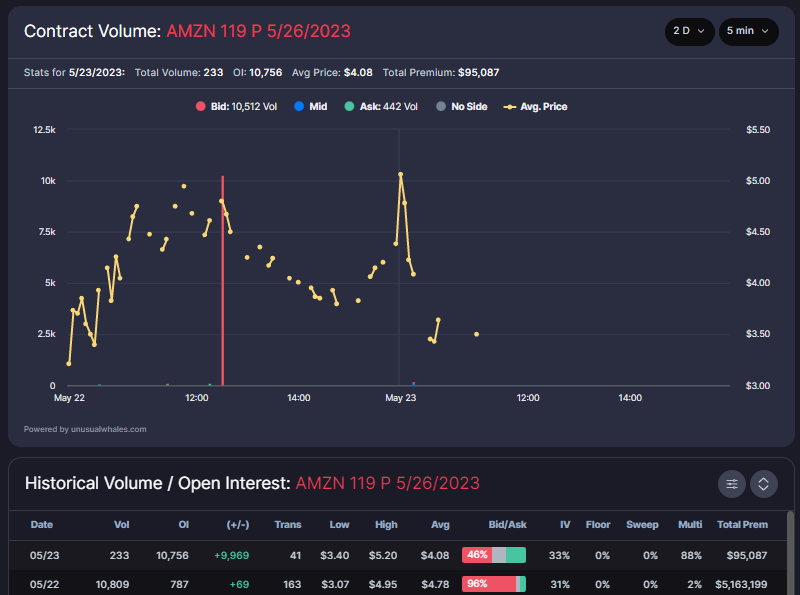
Using the search bar you can look up any ticker, which will take you to the company page. From here you can see everything from past alert history, technical charts, FURU data, stocks alerts, and more. unusualwhales.com/company/AAPL/a…
The EOD reports page will give you a birds-eye view of the bot's daily activity. You could use this to see if a particular sector has been being pushed and to get an idea of the daily bot performance. unusualwhales.com/reports
And lastly, you can refer friends and reduce your own subscription costs. unusualwhales.com/referrals As always, you can email support@unusualwhales.com or reach out in the Discord if you have any questions.
• • •
Missing some Tweet in this thread? You can try to
force a refresh
$AMD 195c 4/19
For those that like keeping track of the whales: $AMD trader(s) from Feb 29th are most likely all out of their position(s) as of today's trading session. This is a conclusion you can come to just from this image alone. Here's what I'm thinking: 🧵
My pinned tweet asks some questions that are relevant here. I won't hit on each one through this process but feel free to follow along. The UI will be slightly different but the concepts remain the same.
First let's look at what the opening flow looked like.
All that volume (far exceeding OI), followed by an increase in open interest the next day. Unclear exactly how many whales we're tracking but it's not relevant. Just focus on the fact that we're dealing with large volume. With some rounding the 4 large candles amount to about 11,000 volume. (Fact: a trade transacted at the ask is not necessarily a buy, nor is a trade transacted at the bid necessarily a sell. This may be contrary to what you think you know or have been taught.) With that in mind: from here on out we're looking to track around 11,000 contracts.
2) You'd like to see more activity towards either the bid or the ask, that way you know 'which way the flow is going' for that contract 4) You need to know if the contract activity is attached to multileg trades because that can change the sentiment (continued)
4 cont) If you see 1000 calls at the ask you'd think it was bullish. But if those 1000 calls are a part of a multileg trade you must take pause. Are they part of a call credit spread (🐻)? A debit spread (🐂)? Something else? Multil % isn't bad but a higher value requires more DD
5) Notional value is an arbitrary value of sorts. You just want to know that there's some actual $$ being moved. Not to say that smaller flow can't work, but (generally) you want to see at least a few hundred K at work at a minimum.
Any 2 or more of these strategies can be combined in order to create a more complex strategy. For example a long call and a short call be used in conjunction to create both a (1) bullish call debit spread or a (2) bearish call credit spread.
A call and put can both be longed or shorted in a variety of different ways to create strategies of varying sentiment. Shorting a call and longing a put would result in a (1) bearish synthetic short while shorting a put and longing a call would create a (2) bullish risk reversal.