-Everyone: 54.5% have at least one dose and 9.1% have two
-Age 12+: 64% and 10.7%
-Age 20+: 65.2% and 11.7%
Stage 2 target: 60% of 12+ w/ 1+ doses (achieved!)
Stage 3 target: 70% of 12+ w/ 1+ doses
Looking forward, Alberta will remove all provincial public health restrictions two weeks after 70% of those age 12+ have at least one dose.
At its current pace, that share is reached on June 8 so (if that pace holds) full re-opening occurs on June 22.
Where will Alberta be in terms of fully vaccinated? Or the 75/20 goal? Here's a rough guide based on when we'd have enough doses for different shares:
- 75% of age 12+ w/ 1+ dose and 20% w/ 2: June 21
- And 30% w/ 2 doses: July 1
The Premier also references `70% pop. protection`, here's a measure of that. First, this is different than doses or 12+ shares. One dose is less effective than two, effects lag and are uncertain, and total pop matters. Roughly, current "coverage" is ~19-36%.
And to whoever changed the age group name from 'All age years' to 'ALL years' ... 😡
• • •
Missing some Tweet in this thread? You can try to
force a refresh
The GoA/LifeWorks thought the Act implied we reverse the clock and estimate what a hypothetical APP would have accumulated since 1966 had all other variables remained unchanged. That reached 53% of CPP assets, or ~$334 billion. This was highly touted by the APP engagement panel.
How do carbon taxes affect food prices? In our latest paper, @dr_jen_winter and I analyze both direct and indirect impacts across the entire food supply chain:
TL;DR: Carbon taxes in Canada, such as the federal $80/tonne emissions price, are often criticized for raising costs. But we find that emissions pricing increases domestic food costs modestly—about 0.8%—with imports shrinking the overall impact on food prices to about 0.5%.
The paper isn't yet accepted for publication, so comments are welcome! 😀 We've completed revisions for the Canadian Journal of Agricultural Economics and recently resubmitted. The link above is to the latest version.
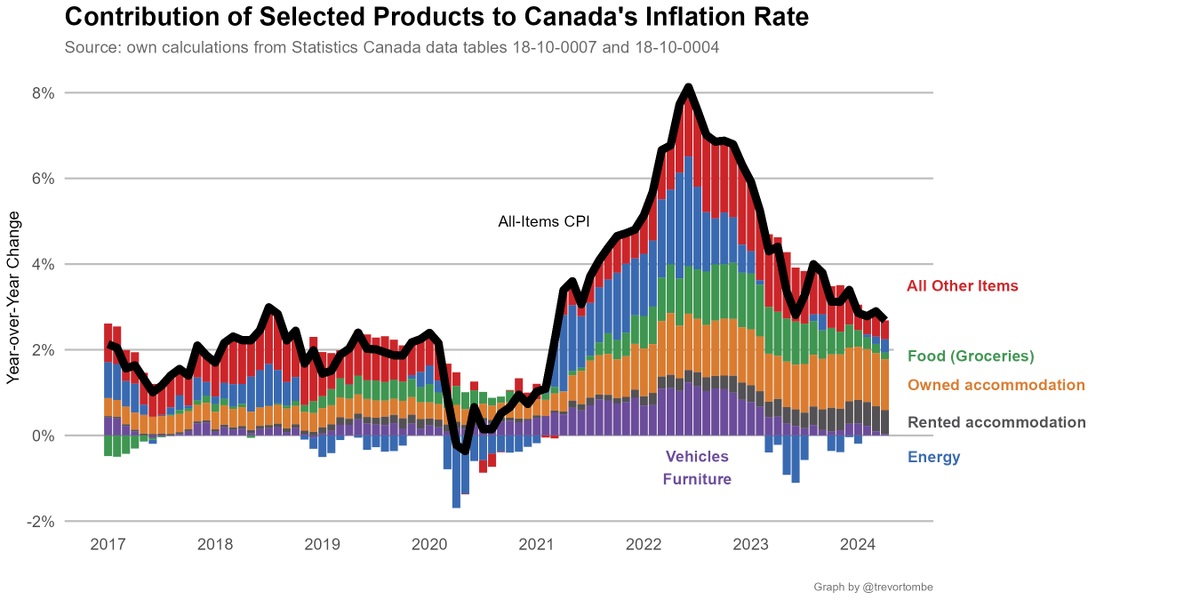
Today's data: inflation rate falls to 2.7% in April. Would have fallen more, but gasoline pushed the rate up. Shelter remains largest contributor, but pace of increase is falling.
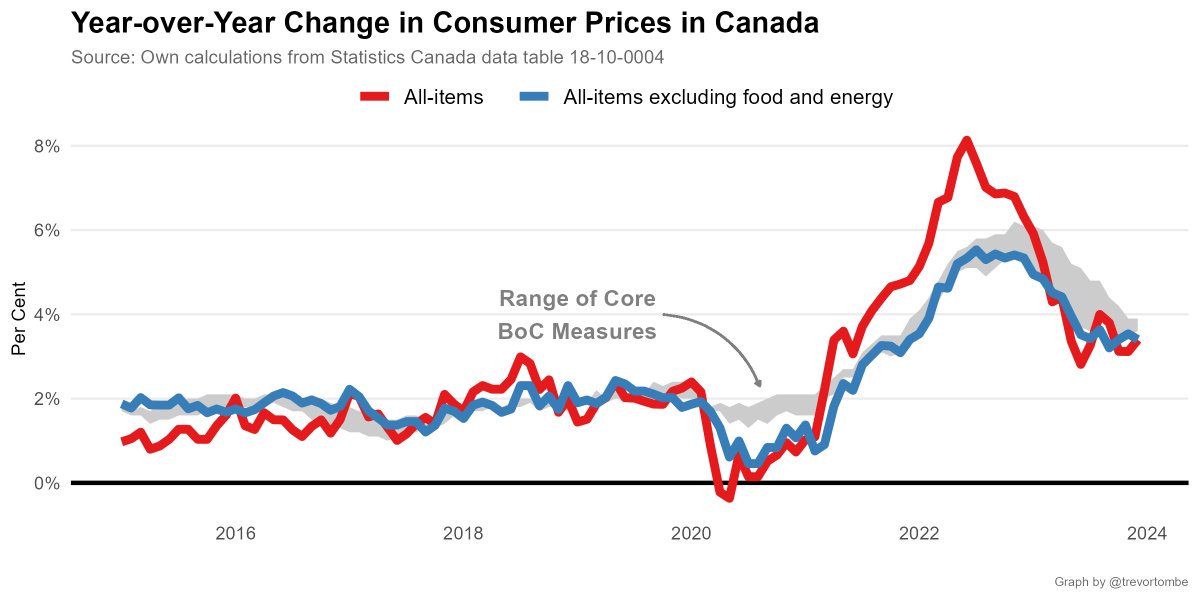
The key Bank of Canada core measures of inflation have also remained within the target range -- lower than 2% -- over the past 3 months. This is what the bank is looking forward before lowering rates.
Here are the contributors to the drop. Most items down, but energy prices offset some of that.
This accounts for *changes* in the CPI annual rate of increase. Alternatively, had energy prices remained flat yoy, then CPI growth would have been 2.4% in April.
Today's data: inflation! 🥳 Prices were 2.9%, on average, higher in January than a year earlier. Inflation down from 3.4% in Dec. Biggest contributors to the drop were energy, food, travel. Cell phones offsetting some.
Looking at the headline rate, shelter is larger contributor. Rent accounts for ~0.5 points of the 2.9, mortgage interest costs ~1.0 points.
Important: note the strong decline in the pace of grocery price growth. Now in line with historical norm.
The decline in inflation has also been fairly broad based, with now fewer than half of items seeing a pace of price growth above 3% -- although still a larger share than normal, which is ~0.3-0.4.
This is higher than last month, true, but it doesn't mean the inflation situation is worsening. I noted this yesterday, saying 3.4% was the number to watch.
This is a *very* important point to keep in mind for the next *several* months. Even if things are completely normal month-by-month, the headline rate won't fall much over the next quarter.
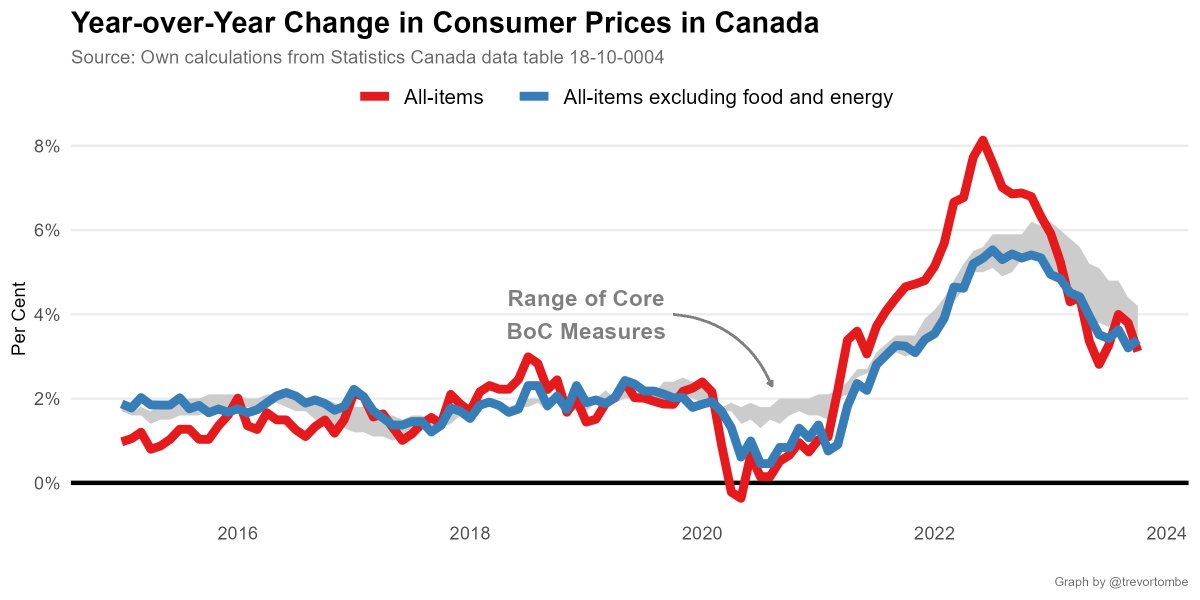
As expected, inflation fell in October. A lot. From 3.8% in September to 3.1% in October. And monthly, adjusted for seasonality, prices were lower in October than Sept.
A big part of the reason is from lower gasoline prices. That's anticipated because oil prices were down. There's a tight connection between energy's contribution to CPI and oil prices (obviously). This has been a consistent story over the past two years.
You can see the size of the contribution from energy to the change in inflation since September here 👇 . Basically everything else was a net wash.