HKxEva Profile picture
Jun 7, 2021 12 tweets 4 min read Read on X
This is possibly the most ridiculous thing I've seen here in a long time. A map showing very little correlation, no consideration of population density and no attempt to discuss the actual nature/reason of the protest. Correlation does not equal causation.
Reminds me of this... tylervigen.com/spurious-corre…
Apologies, I now have a link to a free version of the paper, where it has become clearer that an attempt at causal connection has been made. sciencedirect.com/science/articl…
It seems a key issue is the hypothesis that increased financial input for projects from China leads to a greater mistrust in the local government.
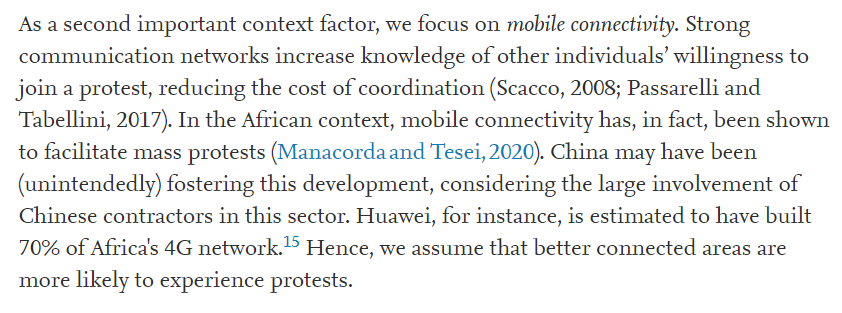
One of the key factors in mass protest is mobile connectivity, something which is obviously better in more developed areas, and partly China's fault... Image
Another key factor involved is the level of 'democracy' in a country. The suggestion is that more 'democratic' countries experience more protests. Image
Apparently, this is China's fault as well for the policy of non-interference in the political structure of a country instead of imposing external conditions on these sovereign countries. Image
If a protest lasts for more than 1 day it is counted repeatedly as separate protests. Image
One of the authors was unable to go into detail about the content of the protest, despite the fact that the data source used has this as a search option. ImageImage
Here's an example of one year (2011) in the timescale analysed. The links show where the protest happened and which other country it is associated with. Image
"We know something on their socio-economic effects already..". Yes *we* do - your 3 co-authors looked into this recently. ImageImage
This gets better. Apparently the population density map only overlaps with the red dots (protests) but not the green (projects). How then do the green and red overlap? Image

• • •

Missing some Tweet in this thread? You can try to force a refresh
 

Keep Current with HKxEva

HKxEva Profile picture

Stay in touch and get notified when new unrolls are available from this author!

Read all threads

This Thread may be Removed Anytime!

PDF

Twitter may remove this content at anytime! Save it as PDF for later use!

Try unrolling a thread yourself!

how to unroll video
  1. Follow @ThreadReaderApp to mention us!

  2. From a Twitter thread mention us with a keyword "unroll"
@threadreaderapp unroll

Practice here first or read more on our help page!

More from @MyUKnumber4

Jun 10, 2021
I’ve taken a look at Zenz’s new paper, “End the Dominance of the Uyghur Ethnic Group”: An Analysis of Beijing’s Population Optimization Strategy in Southern XJ. I have analysed his calculations and broadly get to the same numbers. This thread is a summary.
papers.ssrn.com/sol3/papers.cf…
TLDR: Zenz makes predictions based on Central Government policies that do not exist against an extrapolation of possible growth rates from one region in XJ to show that, in the future, people may not be born when they may, in fact, have been born.
The absurdity of the main premise of this paper is mind-boggling. In order to generate more ‘Victims of Communism’, Zenz argues that between 2.6 and 4.5 million Uyhgur births will be prevented from happening, due to Chinese central government family planning policies, by 2040.
Read 20 tweets

Did Thread Reader help you today?

Support us! We are indie developers!


This site is made by just two indie developers on a laptop doing marketing, support and development! Read more about the story.

Become a Premium Member ($3/month or $30/year) and get exclusive features!

Become Premium

Don't want to be a Premium member but still want to support us?

Make a small donation by buying us coffee ($5) or help with server cost ($10)

Donate via Paypal

Or Donate anonymously using crypto!

Ethereum

0xfe58350B80634f60Fa6Dc149a72b4DFbc17D341E copy

Bitcoin

3ATGMxNzCUFzxpMCHL5sWSt4DVtS8UqXpi copy

Thank you for your support!

Follow Us!

:(