Today's vaccine update:
- Shots reported today *: 407,964 (38% 2nd doses)
- Total shots: 26,503,428
- Age 12+ w/ a Shot: 70.8%
- Age 18+ w/ a Shot: 73.1% (est)
- Shots per 100 people: 69.7
- Inventory: 8.8 days
More: trevortombe.github.io/covidgraphs/
* Includes some weekend doses
- Shots reported today *: 407,964 (38% 2nd doses)
- Total shots: 26,503,428
- Age 12+ w/ a Shot: 70.8%
- Age 18+ w/ a Shot: 73.1% (est)
- Shots per 100 people: 69.7
- Inventory: 8.8 days
More: trevortombe.github.io/covidgraphs/
* Includes some weekend doses
The latest estimates of vaccinations by age:
- Those 60+: 89.3% have at least one dose and 17.0% have two
- 18-59: it's 66.0% and 7.4%
- Adults: 73.1% and 10.3%
Note: data comes with a 6-13 day lag; these are my own estimates
- Those 60+: 89.3% have at least one dose and 17.0% have two
- 18-59: it's 66.0% and 7.4%
- Adults: 73.1% and 10.3%
Note: data comes with a 6-13 day lag; these are my own estimates

In total, Canada is now up to 26.5 million shots given -- which is 88.8% of the total 29.8 million doses available. Over the past 7 days, 3,801,418 doses have been delivered to provinces.
And so far 3.0 million are fully vaccinated with two shots.
And so far 3.0 million are fully vaccinated with two shots.

Canada's daily pace:
Today's 407,964 shots given compares to an average of 377,290/day over the past week and 354,408/day the week prior.
- Pace req'd for 2 doses to 75% of Canadians by Sept 30: 265,292
- At current avg pace, we reach 75% by Aug 26
Today's 407,964 shots given compares to an average of 377,290/day over the past week and 354,408/day the week prior.
- Pace req'd for 2 doses to 75% of Canadians by Sept 30: 265,292
- At current avg pace, we reach 75% by Aug 26

And here's what our current pace means going forward. Enough doses to achieve:
- 75% w/ 1+ dose and 20% w/ 2 by June 20
- 75% w/ 1+ dose and 50% w/ 2: July 16
- 75% w/ 2 doses: August 7
- 75% w/ 1+ dose and 20% w/ 2 by June 20
- 75% w/ 1+ dose and 50% w/ 2: July 16
- 75% w/ 2 doses: August 7

The above is total doses. Based on that, and a model of 1st vs 2nd shots, here's a more detailed projection:
- 75% of people with a shot: June 15
- 20% fully vaccinated: June 24
- Match current U.S. fully vaccinated rate: July 25
- 75% fully vaccinated: August 17
- 75% of people with a shot: June 15
- 20% fully vaccinated: June 24
- Match current U.S. fully vaccinated rate: July 25
- 75% fully vaccinated: August 17

Dose projections are informative, but effective protection is lower than the share with a shot. One dose is less effective than two, plus effects lag and are uncertain. Roughly, current "coverage" is ~21-42%
Useful research summary: publichealthontario.ca/-/media/docume…
Useful research summary: publichealthontario.ca/-/media/docume…

Turning to individual provinces, here's total shots given and share of delivered doses used.
- Most shots given: YT at 130 doses per 100 people
- Fewest: PE at 63
- Highest share of delivered doses used: AB with 93%
- Lowest: NU with 64%
- Most shots given: YT at 130 doses per 100 people
- Fewest: PE at 63
- Highest share of delivered doses used: AB with 93%
- Lowest: NU with 64%

A more detailed look at provs/terrs:
- Highest overall: YT at 69% receiving at least one shot
- Most 1st doses only: QC at 58% receiving that shot
- Most Fully Vaccinated: YT at 60%
- Fewest Vaccinated: NU at 44%
- Highest overall: YT at 69% receiving at least one shot
- Most 1st doses only: QC at 58% receiving that shot
- Most Fully Vaccinated: YT at 60%
- Fewest Vaccinated: NU at 44%

How does Canada compare to others? Here's all 37 OECD (i.e., developed) countries:
- Share of pop. w/ at least one dose: Canada ranks 2nd
- Total doses per 100: 7th
- Fully vaccinated: 31st
- Share of pop. w/ at least one dose: Canada ranks 2nd
- Total doses per 100: 7th
- Fully vaccinated: 31st

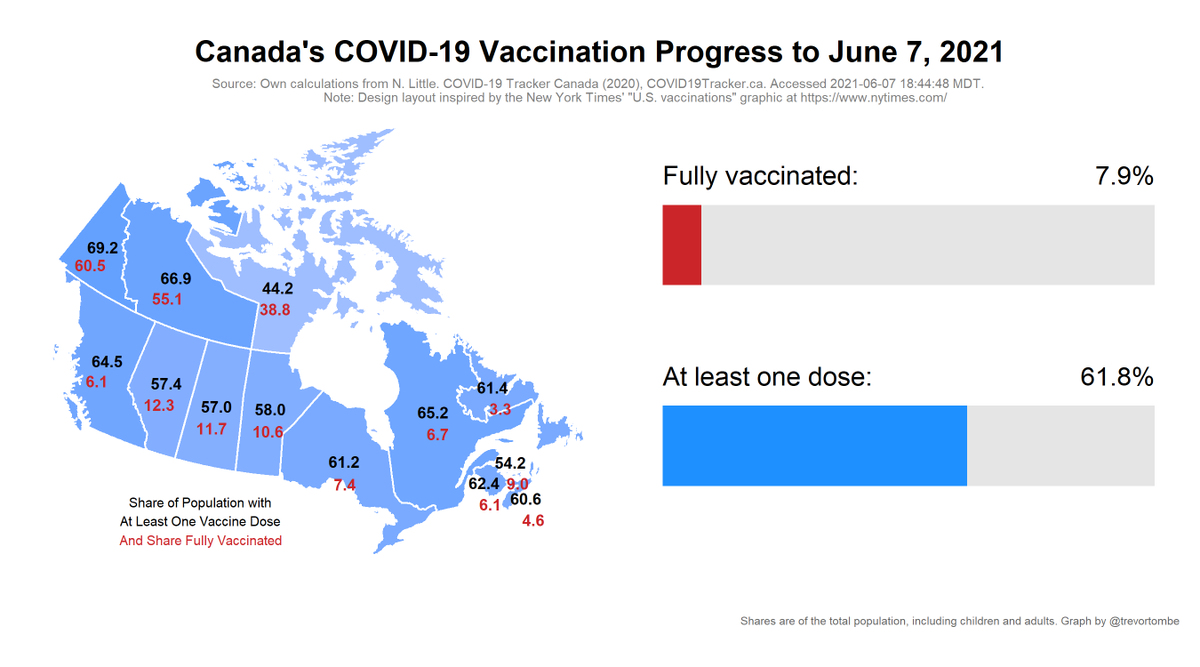
Canada/US comparison.
Received at least one dose:
- Top Prov: QC, 65.2% of pop
- Top State: VT, 71.5
- Top Terr: YT, 69.2
Fully vaccinated:
- Top Prov: AB, 12.3% of pop
- Top State: VT, 59.0
- Top Terr: YT, 60.5
Interactive plot here: trevortombe.github.io/covidgraphs/usa
Received at least one dose:
- Top Prov: QC, 65.2% of pop
- Top State: VT, 71.5
- Top Terr: YT, 69.2
Fully vaccinated:
- Top Prov: AB, 12.3% of pop
- Top State: VT, 59.0
- Top Terr: YT, 60.5
Interactive plot here: trevortombe.github.io/covidgraphs/usa

Going forward, here's a cdn/usa comparison of total doses per 100 people.
- In Canada, this rises by 0.99 per day. The US rises by 0.34 per day.
- Projected out, we match the US in 33 days
- Reaching the current US rate takes 22 days.
- In Canada, this rises by 0.99 per day. The US rises by 0.34 per day.
- Projected out, we match the US in 33 days
- Reaching the current US rate takes 22 days.

Of course, there's lots of countries and many ways to compare. Here's a selection across several metrics/groups of how Canada ranks globally. Pick your preferred measure!

Fin.
Note: all graphs (and more!) are automatically updated and posted online for later review and easy sharing at the following site: trevortombe.github.io/covidgraphs/
Note: all graphs (and more!) are automatically updated and posted online for later review and easy sharing at the following site: trevortombe.github.io/covidgraphs/
• • •
Missing some Tweet in this thread? You can try to
force a refresh