Office for National Statistics (ONS) Profile picture
Jun 10, 2021 5 tweets 4 min read Read on X
Our article looks at how red, amber and green lists might affect travel plans.

Between 2016 and 2019, an average of more than 5 million visits each summer were made to see friends and relatives in countries on amber and red lists as of 8 June 2021 ow.ly/Sfsx50F79W0 How many overseas visits will be affected by red, amber and
Current travel restrictions mean visitors to red and amber countries require #COVID19 tests and quarantine on return.

This will affect visits to see friends and family, including an average of more than 600,000 visits to Poland between July and September ow.ly/ofwo50F7a7y 19 of the 20 countries where UK residents make the most visi
Between 2016 and 2019, UK residents spent more than £1 billion throughout July, August and September in

▪️ Spain
▪️ USA
▪️ France
▪️ Italy
▪️ Greece.

This was generally more than residents of overseas countries spent in the UK ow.ly/odz750F7ab8 UK residents would normally spend more than £1 billion in e
UK residents have changed travelling habits due to the #COVID19 pandemic.

In September 2020, seasonally adjusted turnover in the camping sub-industry surpassed previous years at £498 million, compared with £363 million in the same month of 2019 ow.ly/Wnkh50F7adN Seasonally adjusted turnover in the camping sub-industry sur
In summer 2020, hotel room occupancy decreased in every region of England, according to @VisitEngland.

London had the largest percentage point fall compared with the year before while the South West had the smallest fall ow.ly/s7V050F7aeW Hotel occupancy in England in 2020 was down on a normal summ

• • •

Missing some Tweet in this thread? You can try to force a refresh
 

Keep Current with Office for National Statistics (ONS)

Office for National Statistics (ONS) Profile picture

Stay in touch and get notified when new unrolls are available from this author!

Read all threads

This Thread may be Removed Anytime!

PDF

Twitter may remove this content at anytime! Save it as PDF for later use!

Try unrolling a thread yourself!

how to unroll video
  1. Follow @ThreadReaderApp to mention us!

  2. From a Twitter thread mention us with a keyword "unroll"
@threadreaderapp unroll

Practice here first or read more on our help page!

More from @ONS

May 14
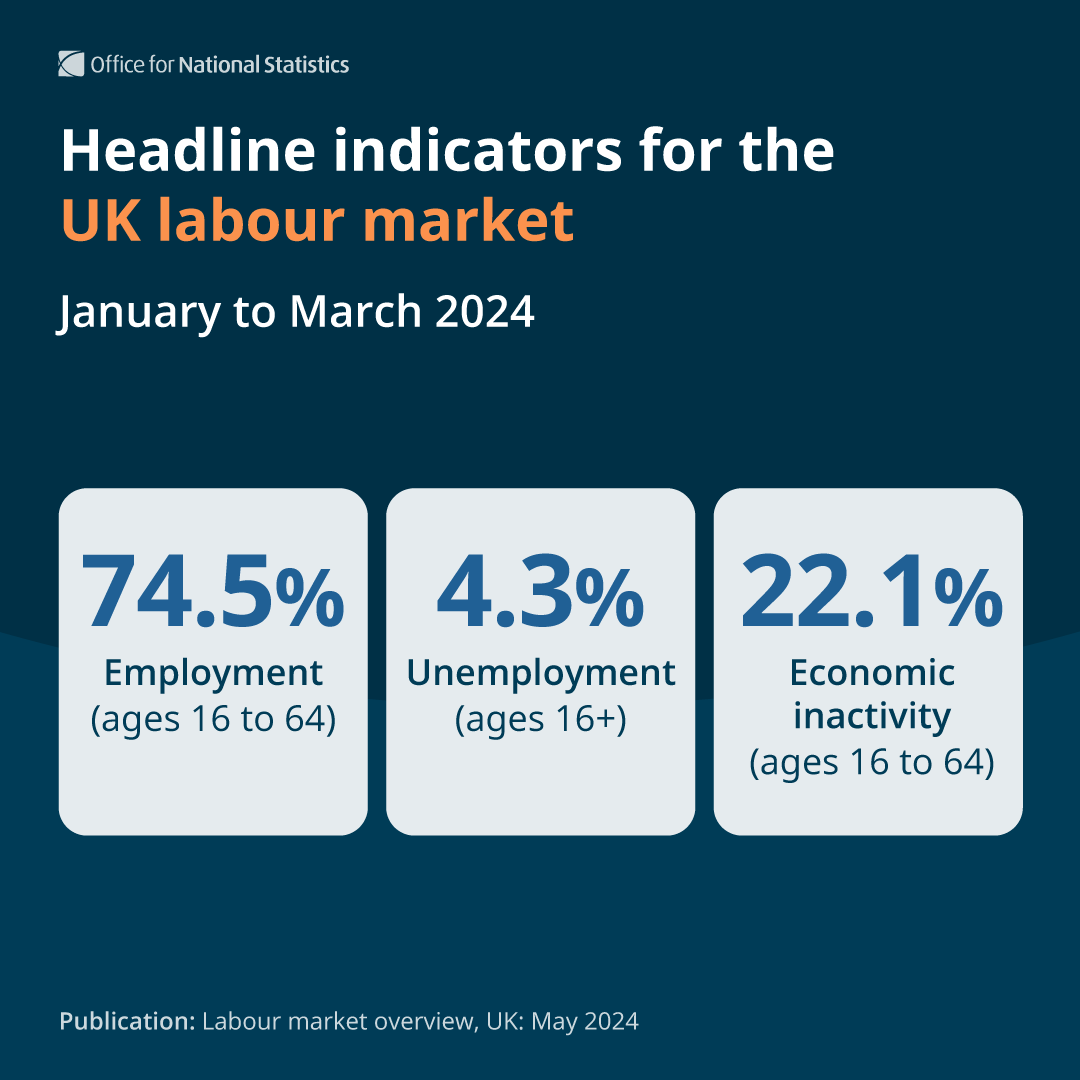
We’ve published the latest UK labour market figures.

Headline indicators for the UK labour market for January to March 2024 show:

· employment was 74.5%
· unemployment was 4.3%
· economic inactivity was 22.1%

Read Labour market overview ➡️ ons.gov.uk/employmentandl…
Headline indicators for the UK labour market  January to March 2024:     Employment (ages 16 to 64 years) 74.5%   Unemployment (ages 16 years and over) 4.3%   Economic inactivity (ages 16 to 64 years) 22.1%    Publication: Labour market overview, UK: May 2024  
Commenting on today’s figures, ONS Director of Economic Statistics Liz McKeown said: (1/3) 💬 "We continue to see tentative signs that the jobs market is cooling, with both employment from our household survey and the number of workers on payroll showing falls in the latest periods.”   Liz McKeown  Director of Economic Statistics, ONS
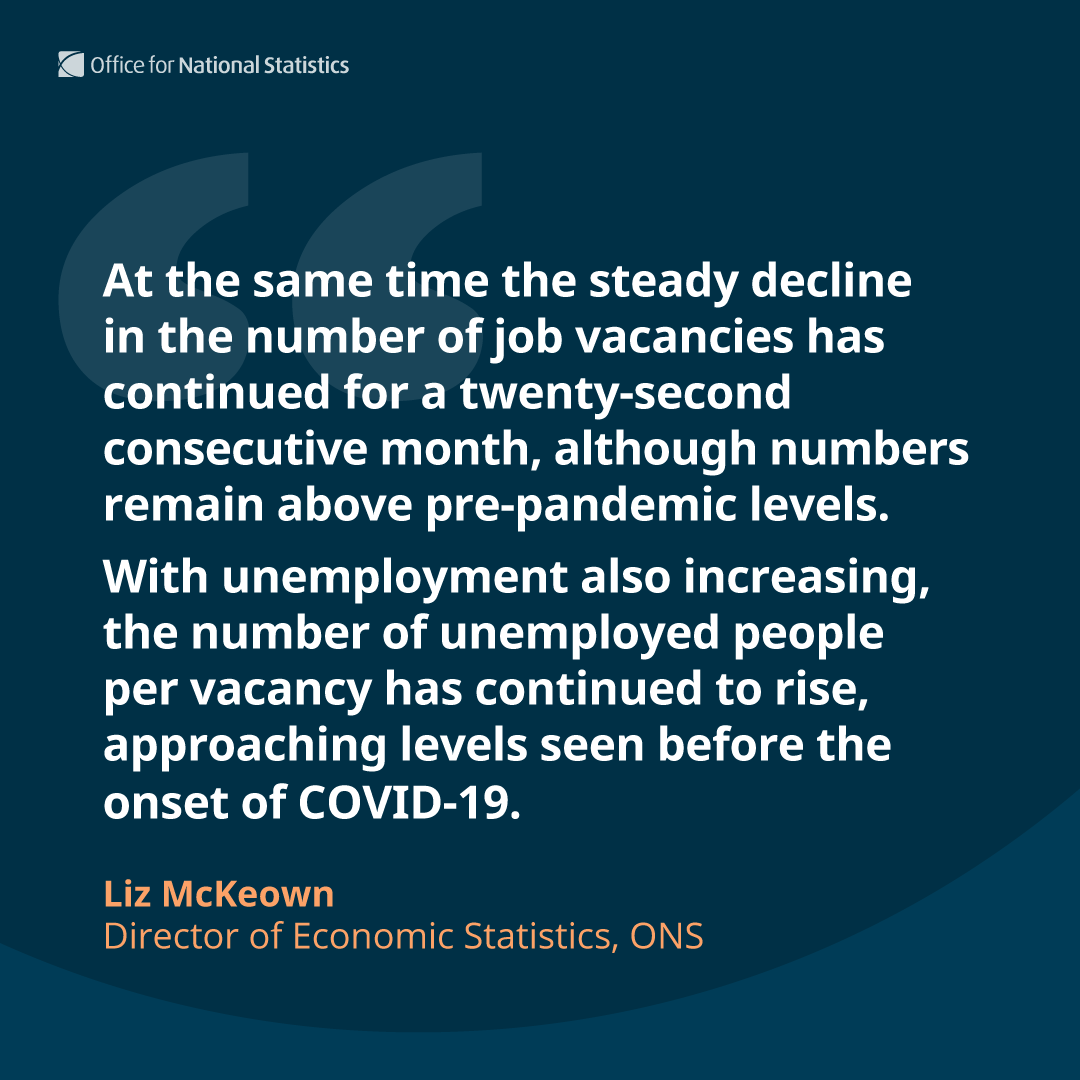
Liz McKeown added: (2/3) 💬 “At the same time the steady decline in the number of job vacancies has continued for a twenty-second consecutive month, although numbers remain above pre-pandemic levels. With unemployment also increasing, the number of unemployed people per vacancy has continued to rise, approaching levels seen before the onset of COVID-19."   Liz McKeown   Director of Economic Statistics, ONS
Read 8 tweets
Apr 25
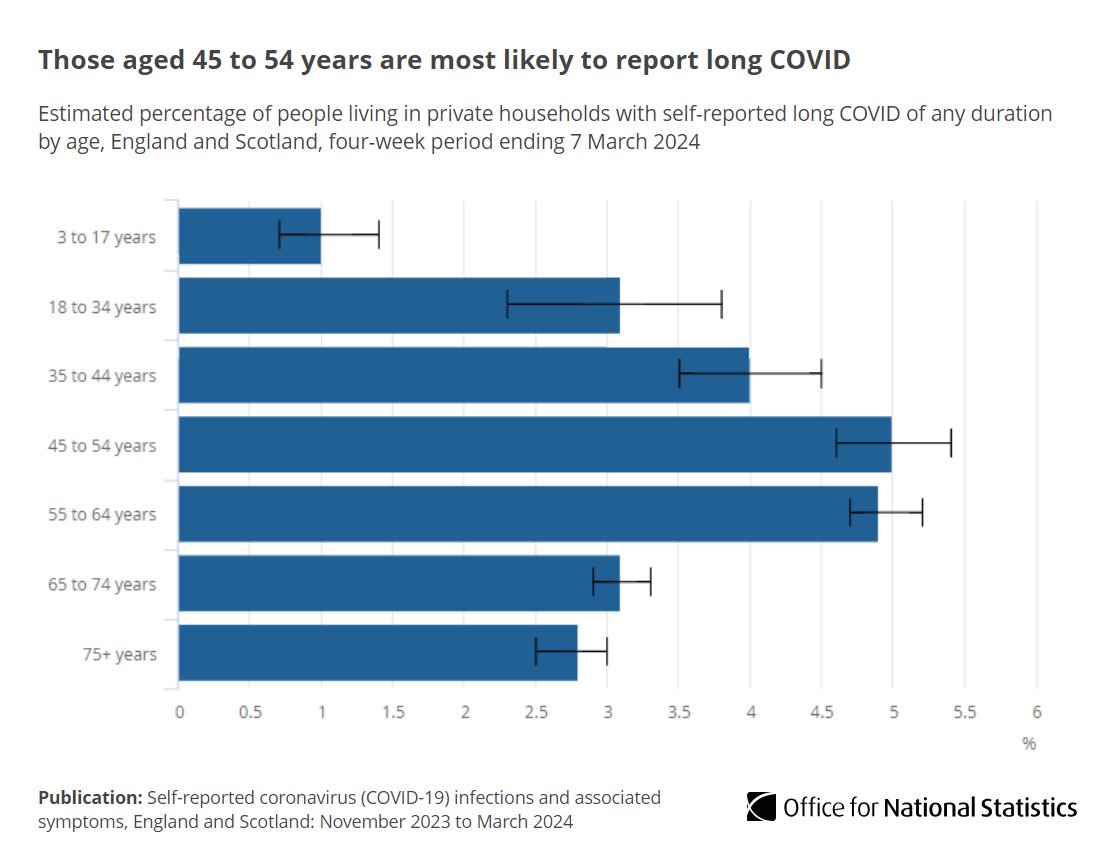
2 million people living in private households in England and Scotland were experiencing self-reported long COVID

Symptoms continuing for more than four weeks after a confirmed or suspected #COVID19 infection that were not explained by something else.

➡️ ons.gov.uk/peoplepopulati…
Confidence interval bar chart showing that those aged 45 to 54 years are most likely to report long COVID.
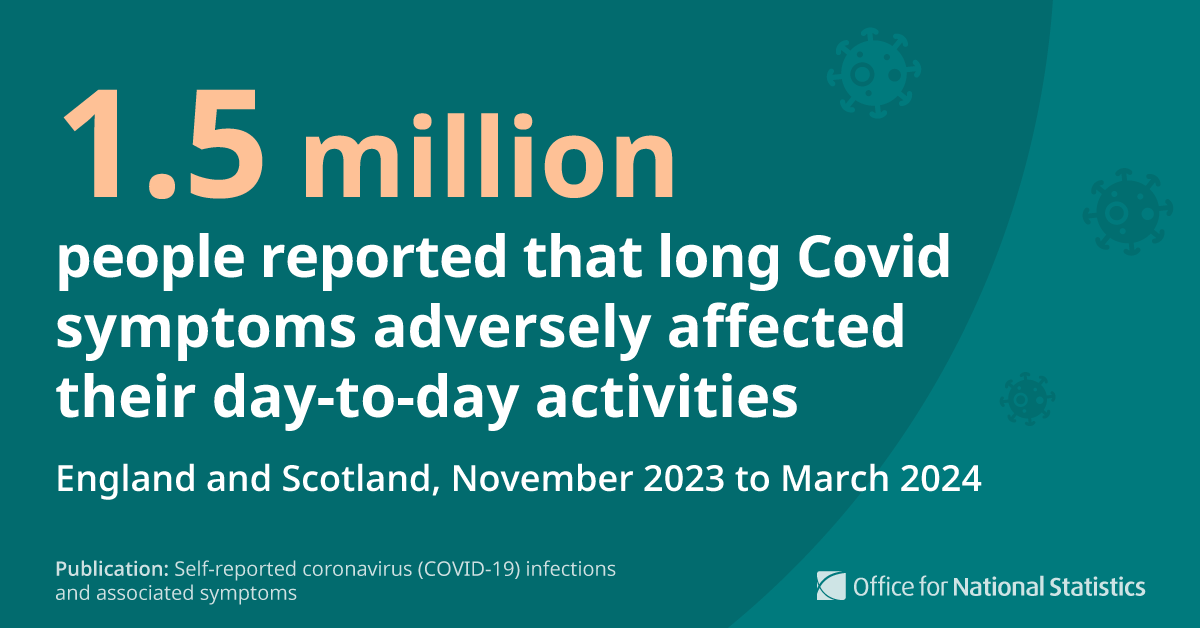
Long COVID symptoms adversely affected the day-to-day activities of 1.5 million people (74.7% of those with self-reported long COVID).

381,000 (19.2%) reported that their ability to undertake their day-to-day activities had been “limited a lot”. 1.5 million people reported that long Covid symptoms adversely affected their day-to-day activities.  England and Scotland, November 2023 to March 2024
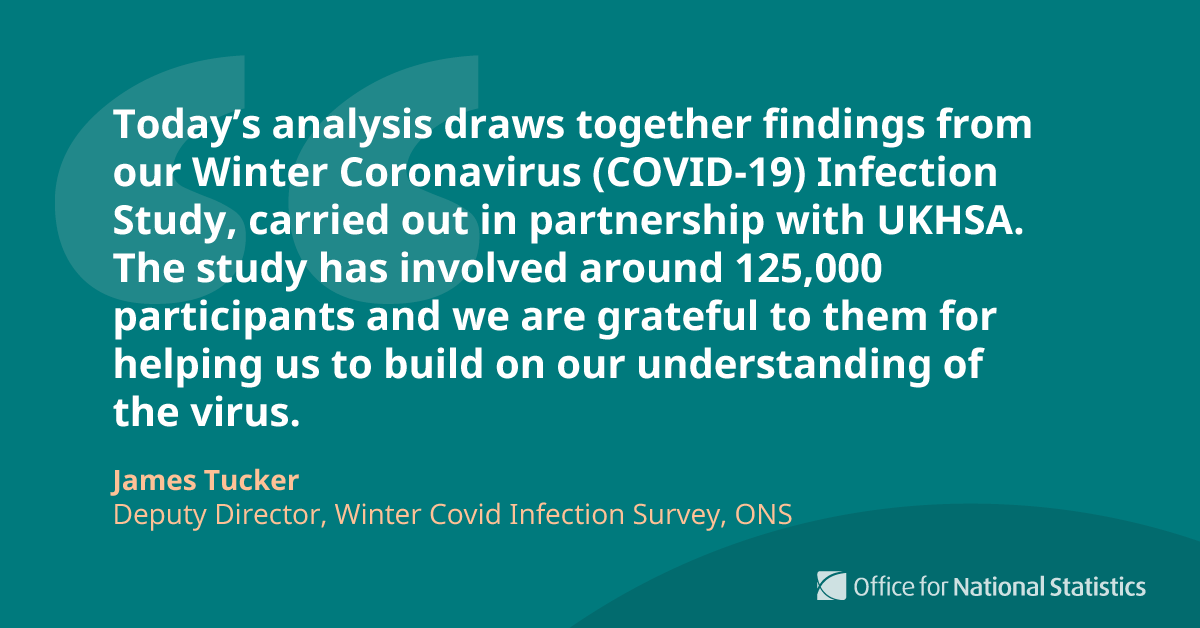
Commenting on today’s release, ONS’s James Tucker, said: (1/2) 💬 Today’s analysis draws together findings from our Winter Coronavirus (COVID-19) Infection Study, carried out in partnership with UKHSA. The study has involved around 125,000 participants and we are grateful to them for helping us to build on our understanding of the virus.   James Tucker, Deputy Director, Winter Covid Infection Survey, ONS
Read 4 tweets
Feb 20
We've led the development of a new method for estimating the number of excess deaths across UK countries.

Julie Stanborough talks us through the data released today and how this new method will give us a better understanding in this complex area ➡️ ons.gov.uk/peoplepopulati…
Expected number of deaths used to calculate excess mortality is now estimated from age-specific mortality rates rather than death counts, so changes in population size and age structure are taken into account. Our new method also accounts for trends in population mortality rates.
In 2023, the new method estimates 10,994 excess deaths in the UK, which is 20,448 fewer than the current method.
Read 5 tweets
Nov 8, 2023
We've been investigating the quality of #Census2021 gender identity data after some unexpected patterns were identified.

Our final summary report has been published today to help users in their interpretation of the census results.

➡️ ons.gov.uk/peoplepopulati…
Commenting on the release of today’s report, Jen Woolford Director of population statistics at the ONS said: (1/6)💬⬇️ Quote graphic with the wording: We have confidence in our gender identity estimates at a national level, however there are some patterns in the data that are consistent with - but do not conclusively demonstrate - that some respondents may not have interpreted the question as intended, for example, people with lower English language skills in some areas.   Jen Woolford, Director of Population Statistics, ONS
She went on to say: (2/6)💬⬇️ Quote graphic with the wording:  While these patterns may be unexpected, this does not necessarily mean they are wrong. Some local authorities may attract trans people due to established communities and unexpected patterns can result from correlations between variables, such as younger age profiles in some ethnic groups.    Jen Woolford, Director of Population Statistics, ONS
Read 7 tweets
Nov 1, 2023
We've published a new article exploring the disability, health status, ethnic group, religion and employment of people of different sexual orientations (aged 16 years and over) in England and Wales using #Census2021 data.

➡️ ons.gov.uk/peoplepopulati…
Sexual orientation: further personal characteristics, England and Wales; Census 2021. Read our new release.
#Census2021 included a voluntary question about sexual orientation of usual residents aged 16 and over:

▪️ 89.4% said they were straight or heterosexual
▪️ 3.2% identified as lesbian, gay, bisexual or another sexual orientation (LGB+)
▪️ 7.5% did not respond to the question
People who identified as LGB+ were younger on average, with a far higher proportion aged between 16 and 34 years (57.9%) than in the overall population of England and Wales (29.6%).

However, different LGB+ sexual orientation groups had markedly different age distributions. Multiple rotated bar charts showing  people who identified as LGB+ were much younger than the overall population of England and Wales.
Read 9 tweets
Sep 22, 2023
We've published a new article looking at the relative risk of death associated with temperature for England and Wales from 1988 to 2022.

Temperatures below -5 and above 25 degrees Celsius represent the greatest risk 🌡️

➡️ ons.gov.uk/peoplepopulati…
Graphic showing and an icon representing plant Earth and the text Climate-related mortality, England and Wales: 1988 to 2022. Read our new release
Commenting on today’s release, Gillian Flower from the ONS, said (1/2) 💬 Graphic with a quote from Gillian Flower, Climate and Health analysis, ONS saying "Our analysis shows that, in England, historically very low temperatures were responsible for a greater number of deaths than very high temperatures, although over recent years there is some indication that heat related deaths have increased".
She went on to say (2/2) 💬 Graphic with a quote from Gillian Flower, Climate and Health analysis, ONS saying "We continue to develop our methods to measure climate-related health outcomes, and monitor the situation in the context of the increasing frequency of hotter days".
Read 6 tweets

Did Thread Reader help you today?

Support us! We are indie developers!


This site is made by just two indie developers on a laptop doing marketing, support and development! Read more about the story.

Become a Premium Member ($3/month or $30/year) and get exclusive features!

Become Premium

Don't want to be a Premium member but still want to support us?

Make a small donation by buying us coffee ($5) or help with server cost ($10)

Donate via Paypal

Or Donate anonymously using crypto!

Ethereum

0xfe58350B80634f60Fa6Dc149a72b4DFbc17D341E copy

Bitcoin

3ATGMxNzCUFzxpMCHL5sWSt4DVtS8UqXpi copy

Thank you for your support!

Follow Us!

:(