
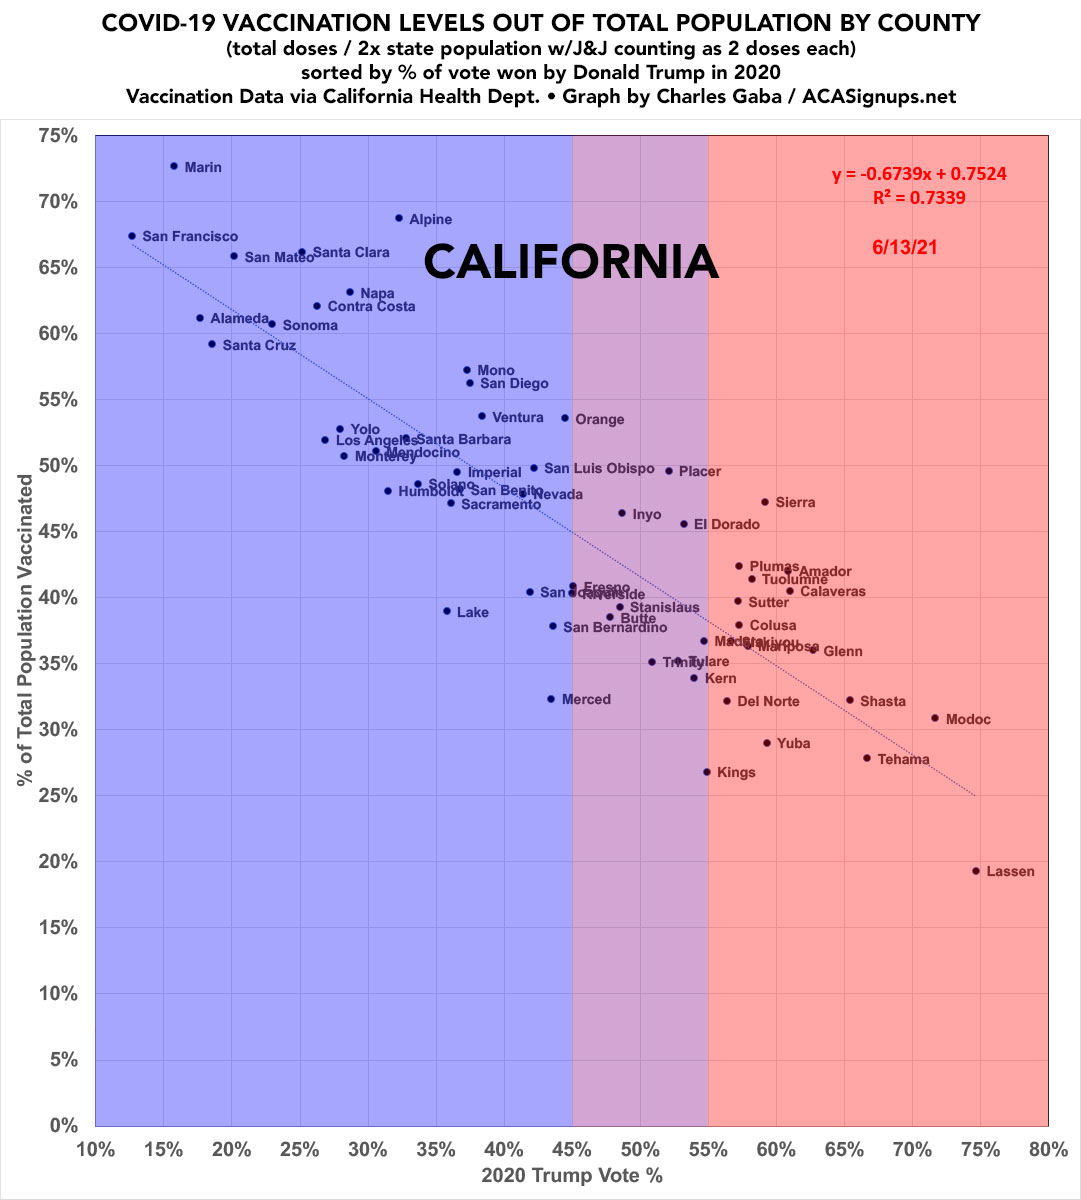
Decided to check in on a few states at the county level again. Here's California. Good grief.
cc: @ForecasterEnten
cc: @ForecasterEnten
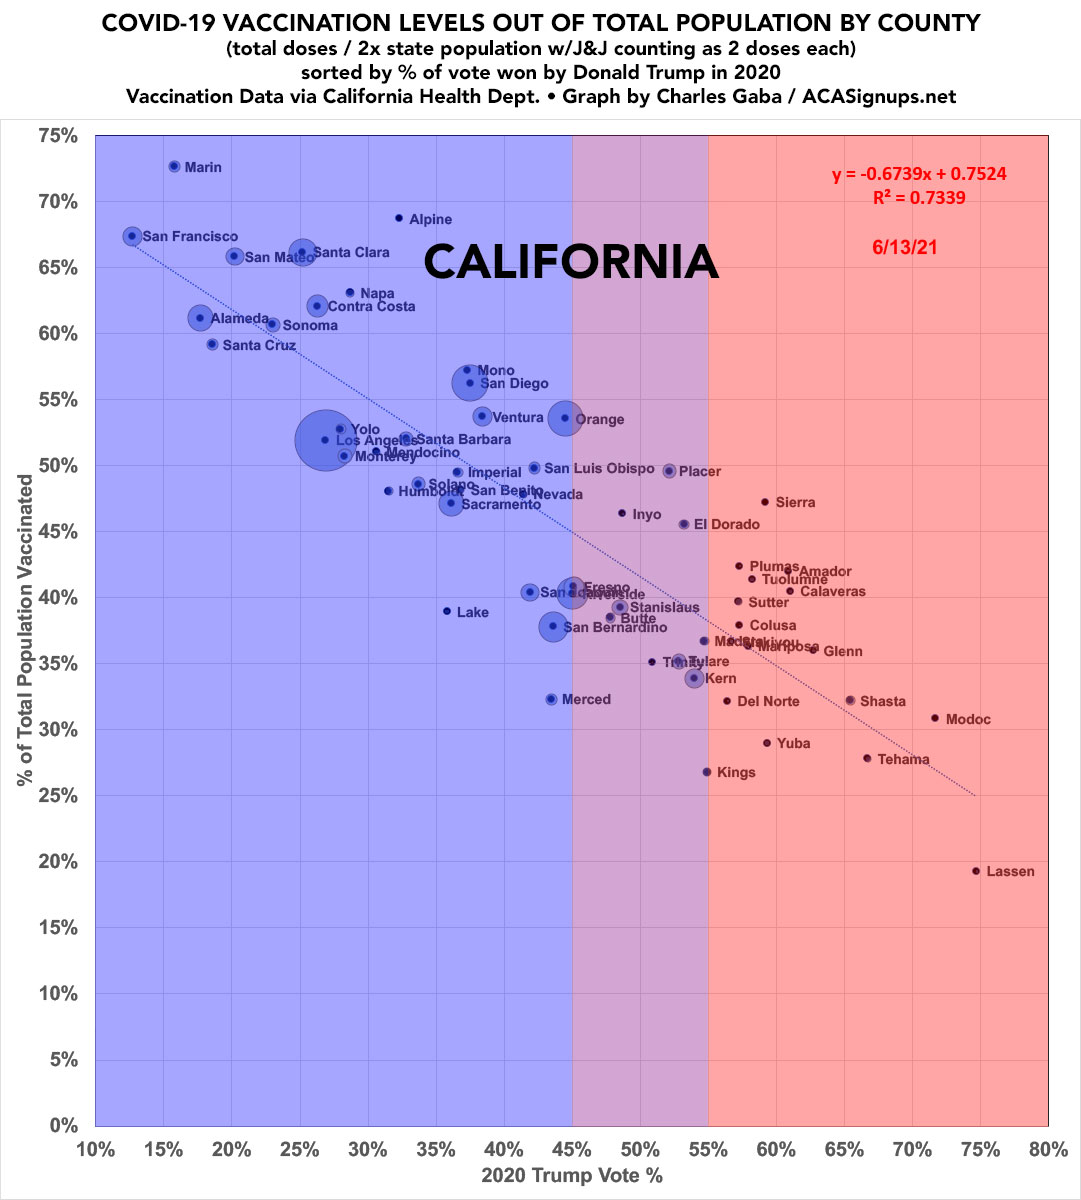
Here's what it looks like w/the counties sized by population.

Colorado as of today.

Colorado counties sized by population.

Illinois as of today...

...with Cook County kind of outweighing a LOT of the state, of course...

Michigan (with the counties by size overlaid on top):

TEXAS. I don't know what Presidio County is doing right, but they're kicking ass. King County? Not so much.

Washington State.

Here's California again, this time with the relative county sizes superimposed over the labels. I've reduced the scale to make the individual counties more visible, however:
Colorado again, with relative county sizes superimposed over the county markers/labels.

A reminder that if you find my work useful (and can afford to do so), you can support it here: acasignups.net/support
Illinois again, this time with relative county sizes superimposed over the markers/labels. Again, I changed the scale so the individual counties are easier to make out (still too much overlapping but not much I can do about that...)

Minnesota.

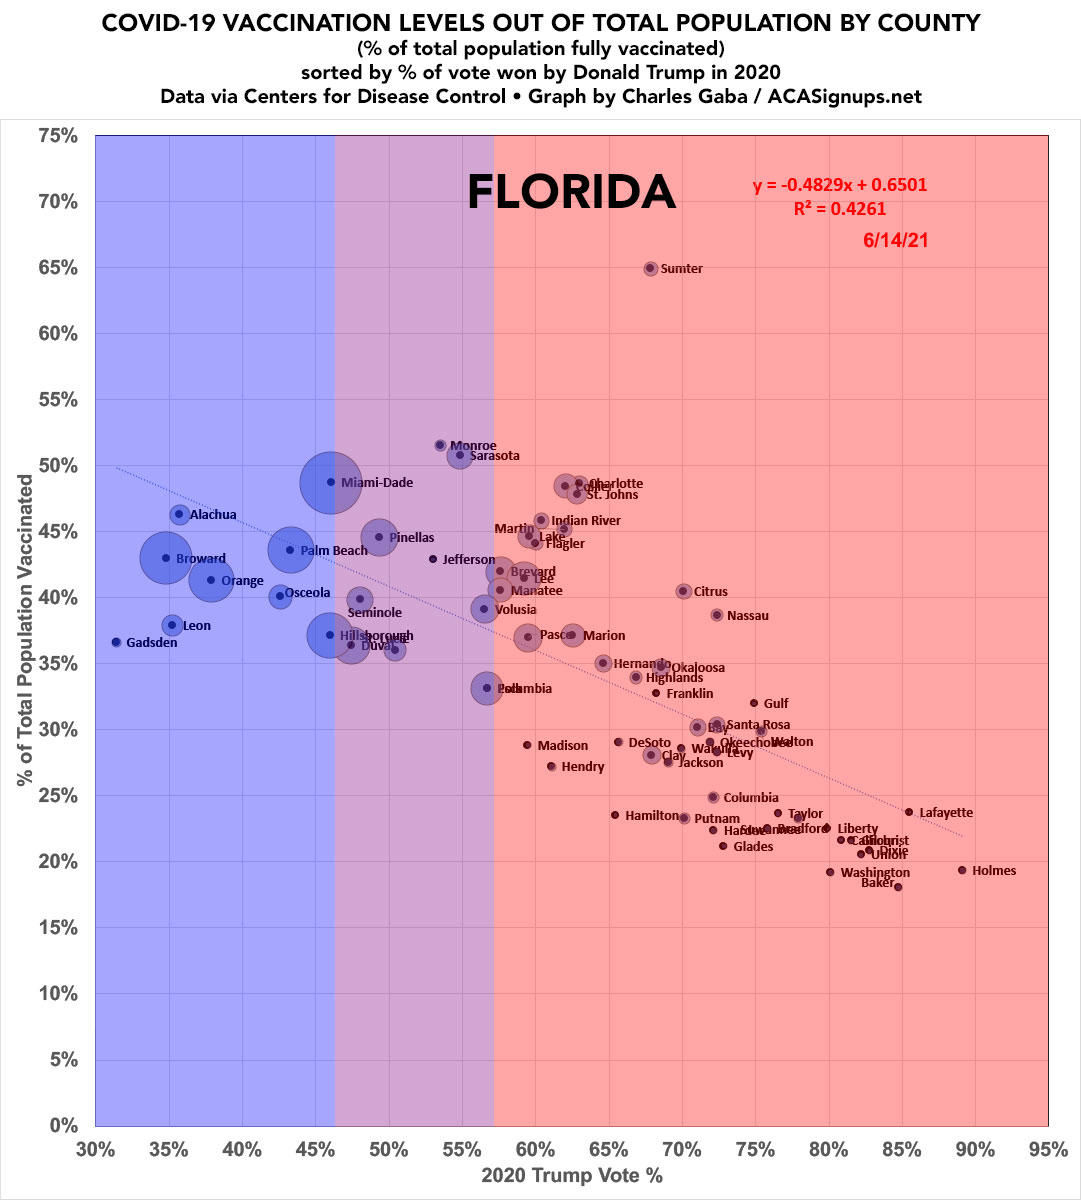
FLORIDA. Sumter County is apparently home to "The Villages," the massive retirement community which was infamous for having a bunch of jam-packed Trump rallies last year featuring clashing convoys of golf carts.
villages-news.com/2020/11/08/tru…
villages-news.com/2020/11/08/tru…
North Carolina. This one has the weakest correlation of the states I've posted so far, but it's still there:

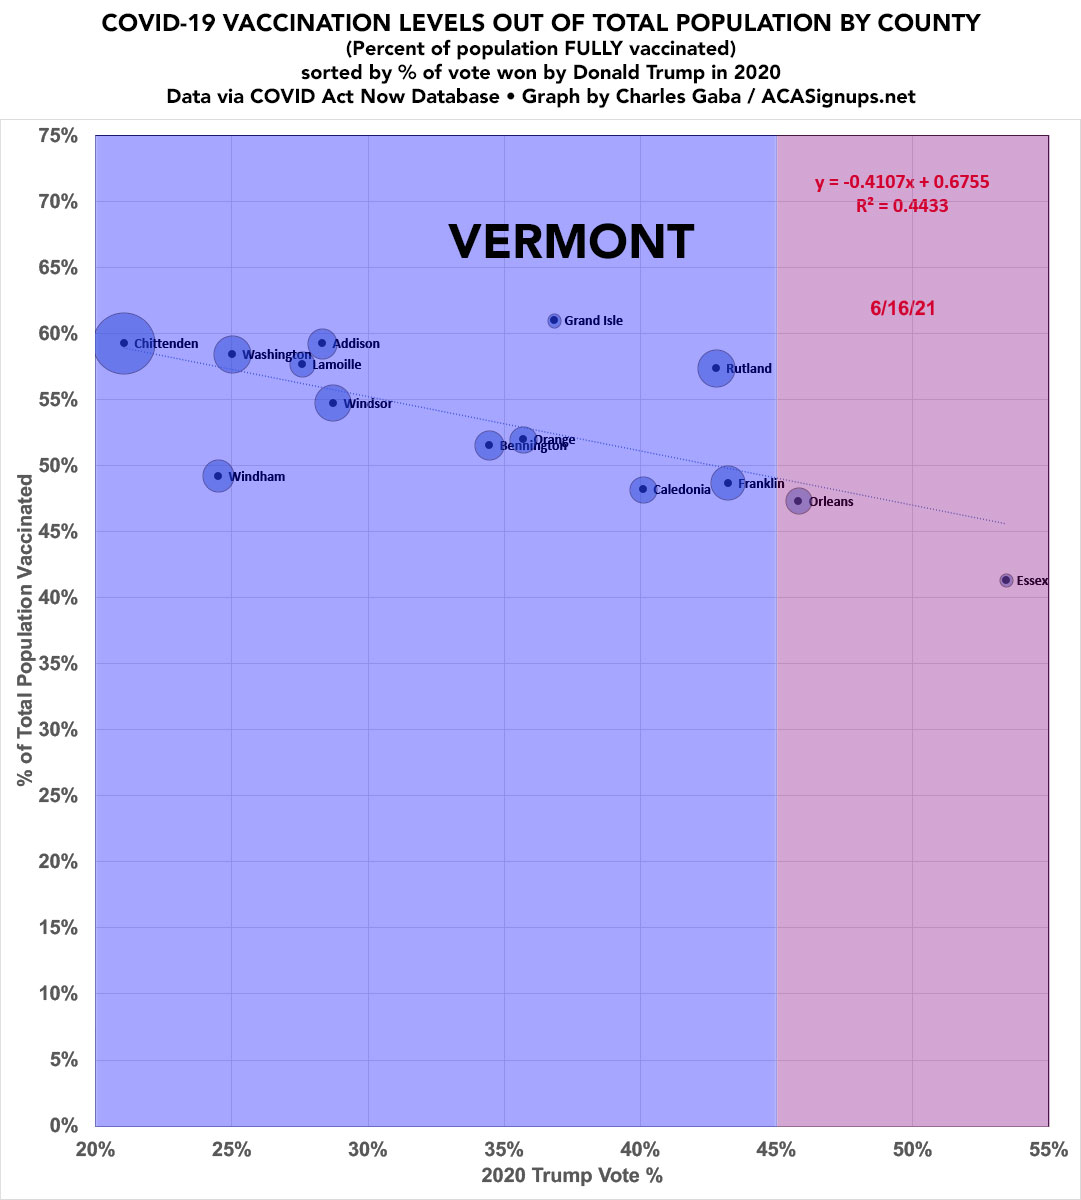
Vermont. Not much correlation here, but then again nearly every county is pretty blue to begin with.

📣 NATIONAL (now featuring relative state populations overlaid). R^2 is up to 0.692.

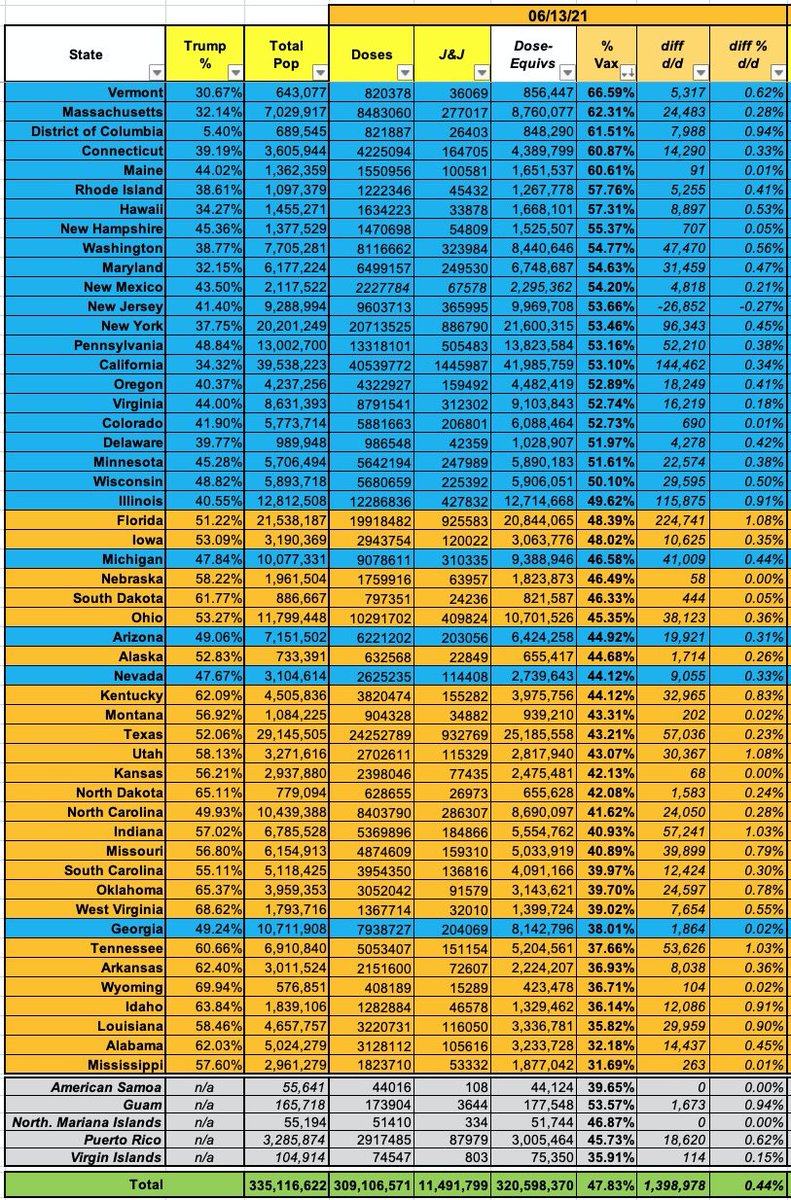
--VERMONT has vaxxed 2/3 of their *entire* population (not just adults)
--Data glitch in NJ?
--WISCONSIN breaks 50% vaxxed
--SOUTH CAROLINA & OKLAHOMA should break 40% tomorrow
--We need 14.5 million more doses administered for 50% of the *entire* U.S. population to be vaxxed
--Data glitch in NJ?
--WISCONSIN breaks 50% vaxxed
--SOUTH CAROLINA & OKLAHOMA should break 40% tomorrow
--We need 14.5 million more doses administered for 50% of the *entire* U.S. population to be vaxxed
Tennessee.

Oregon.

Interestingly, Alabama doesn't have much of a slope at all.

Same with Mississippi, the *other* state competing for dead last in vaccination rates:

Wyoming. R^2 = 0.8098.

As I noted a couple weeks ago, Teton County reminds me of the "Thor's Twins" scene from "The Hunt for Red October."
NEW YORK. Anyone know what's up with tiny Hamilton County (pop. 4,416)?

GEORGIA. Like MS & AL, the slope isn't very steep but it's there. I'm assuming there's a significant racial/access factor keeping the larger blue counties down in these GOP-run states, but could be wrong...

Montana. That's a pretty clean line.

Arizona.

Massachusetts. Not much variance, but then again, the entire state is blue, so...

Louisiana. Anyone know what the story is with West Feliciana Parish?

Utah.

Nevada.

NEW JERSEY: AT LAST! I FINALLY FOUND A STATE WITH *NO* PARTISAN SLOPE AT THE COUNTY LEVEL WHATSOEVER!
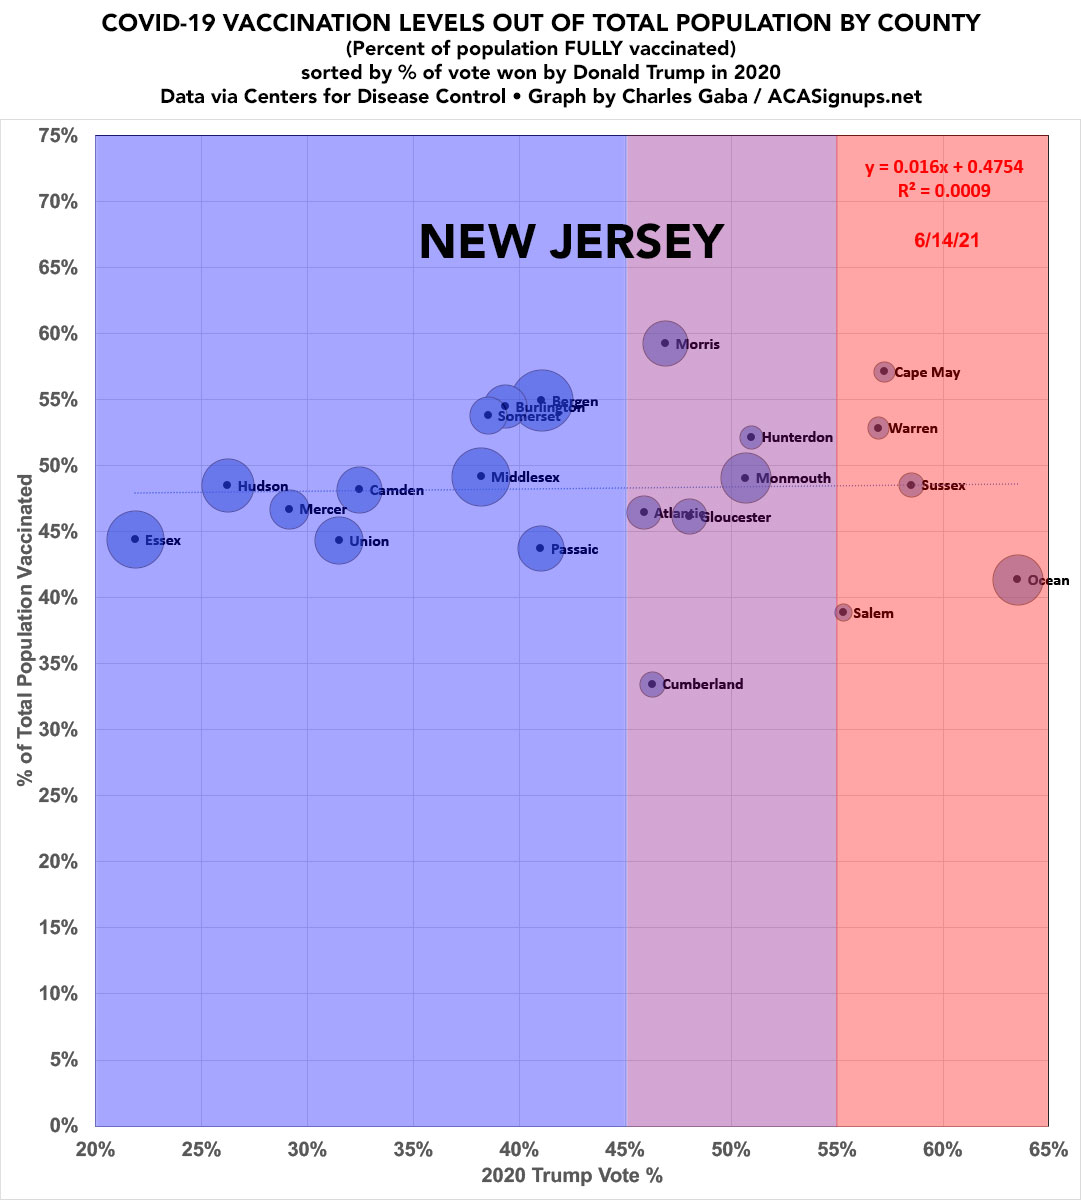
Interestingly, the first state where there appears to be NO partisan vaccination lean at the county level just happens to be the state which has been devastated the worst in COVID deaths per capita.
Imagine that...
Imagine that...
Alaska is pretty much all over the place.

Arkansas. Very similar slope to other southern states like Mississippi & Alabama.

New Mexico.

Idaho.

Connecticut. The state only has 8 counties and *all* of them voted for Biden, so this doesn't really mean much, but even here there's a slight slope.

Delaware, Hawaii AND Rhode Island: There's only 13 counties between all 3 states, and one of those is Kalawao, Hawaii, which only has 86 residents (none of whom appear to have been vaccinated yet), so it seems kind of pointless to look for any "trend lines" at the county level.

📣 Since this thread has gone fairly viral, I wanted to remind everyone that the vaccination levels shown are based on the TOTAL population of each county/state, not just adults. If you only include adults, every county would rank somewhat higher regardless of partisan lean.
📣 Also, MOST states use the % of total population *fully* vaccinated only (2 shots of Pfizer/Moderna or 1 shot of J&J). There's a few states where I'm using *total doses administered* (divided into 2x the population, w/J&J counting twice) depending on what data is available.
The states using total doses administered will show slightly higher rates across the board than if I'd used fully-vaxxed only, but those are still consistent across every county regardless of partisan lean (ie, the blue counties might be ~5% higher but so would the red counties).
I still have 18 states left to add, which I'll get to later on today if possible, including: IN, IA, KS, KY, ME, MD, MO, NE, NH, ND, OH, OK, PA, SC, SD, VA, WV, WI
Stay tuned, and remember you can support my work here: acasignups.net/support
Stay tuned, and remember you can support my work here: acasignups.net/support
INDIANA (as of today, 6/15):

📣 NATIONAL: R^2 drops slightly to 0.6879:

📣 DAILY VAXX UPDATE:
--Vermont *officially* breaks the 2/3 mark (*total* population)
--Wisconsin solidly over 50%
--Illinois should hit 50% tomorrow
--Oklahoma & South Carolina break 40%
--American Samoa breaks 40%
--Mississippi breaks...32%
--Vermont *officially* breaks the 2/3 mark (*total* population)
--Wisconsin solidly over 50%
--Illinois should hit 50% tomorrow
--Oklahoma & South Carolina break 40%
--American Samoa breaks 40%
--Mississippi breaks...32%

IOWA:

NOTE: THIS IS *EXACTLY* WHY I BASE ALL OF MY VACCINATION TRACKING ON THE *TOTAL* POPULATION, NOT JUST ADULTS.
https://twitter.com/ReporterMarina/status/1404847525153153027
Nationally, we need ~14 million more *adults* to get their 1st shot to hit President Biden's 70% of adults target.
However, in order to hit 70% of the *total population* vaccinated, we need 58 million more Americans of whatever age to #GetVaxxed.
However, in order to hit 70% of the *total population* vaccinated, we need 58 million more Americans of whatever age to #GetVaxxed.
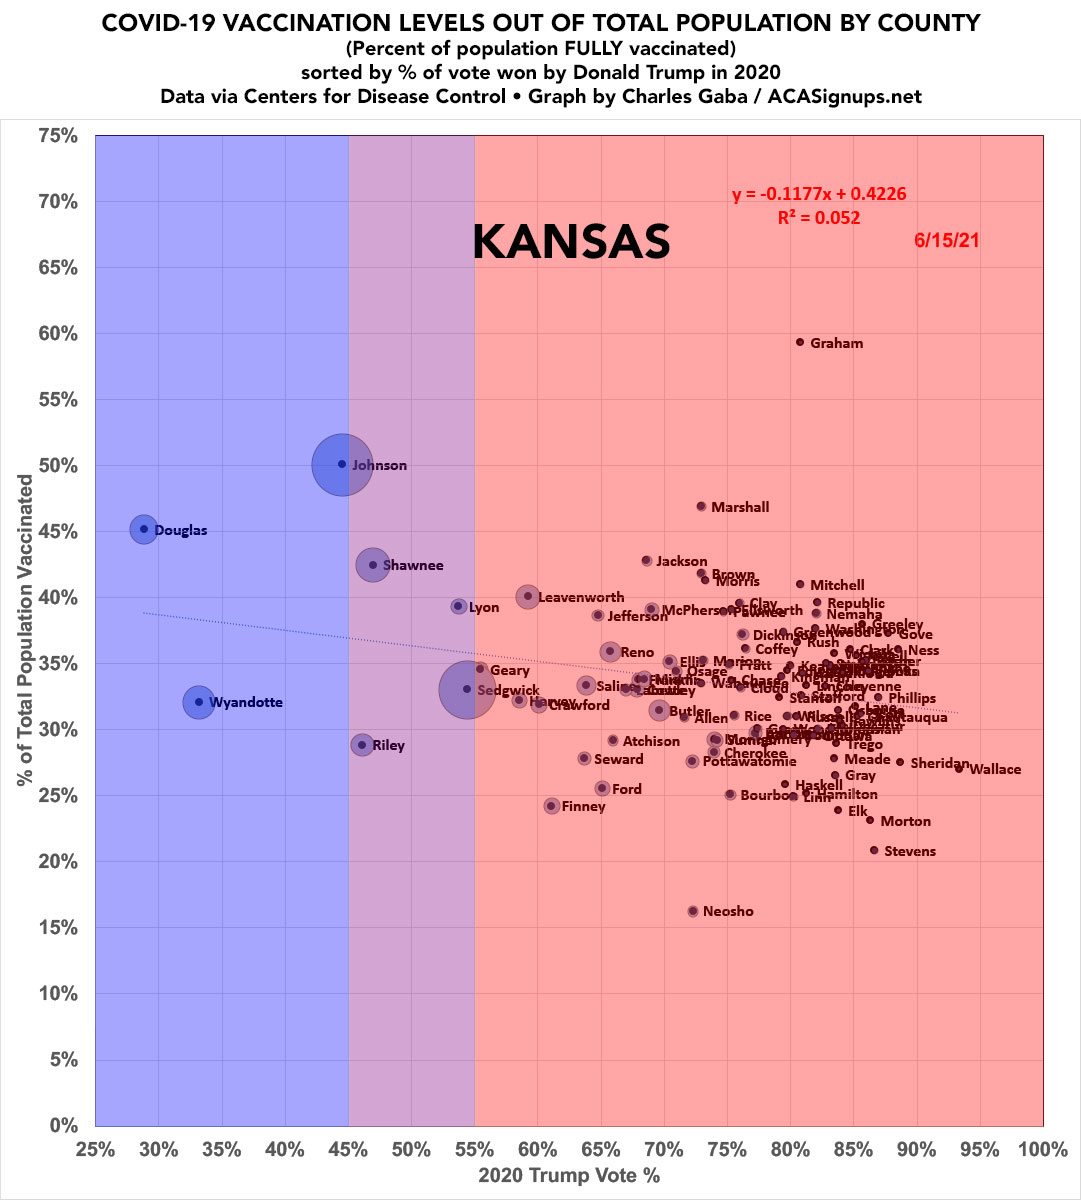
KANSAS. Not much of a story to tell here...
KENTUCKY, on the other hand...

MAINE. Wow. I know the state only has 16 counties, but still...R^2 of 0.8011...

MARYLAND.

MICHIGAN (again). Yeah, I know I already posted it yesterday but it's my home state so I'm keeping a *daily* watch on it).
My home of Oakland County is up to 54.5% of the *entire* population vaccinated...
My home of Oakland County is up to 54.5% of the *entire* population vaccinated...

MISSOURI.

NEBRASKA. Yes, McPherson County, population 494, is sitting at just 9% vaxxed.

NEW HAMPSHIRE. Again, only 10 counties to begin with and not a wide partisan range, but the slope is still there.

NORTH DAKOTA. What's going on with Sioux County?

OHIO.

📣 OK, packing it up for the night. Seven more states to go in the morning: Oklahoma, Pennsylvania, South Carolina, South Dakota, Virginia, West Virginia and Wisconsin.
Then I'll run a graph with EVERY COUNTY FROM EVERY STATE (there's over 3,100 of them). Should be...messy.
Then I'll run a graph with EVERY COUNTY FROM EVERY STATE (there's over 3,100 of them). Should be...messy.
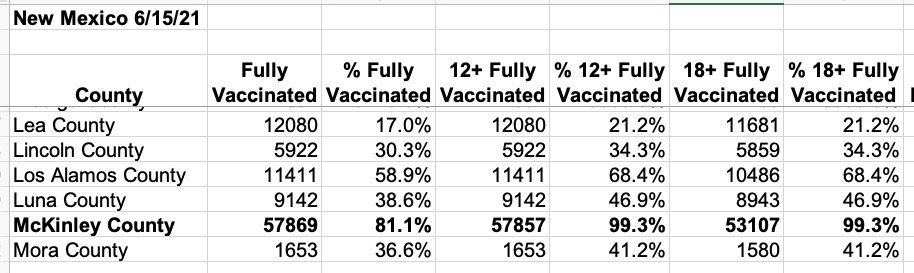
OK, strike that--one more graph before I shut down. @TulliusCicero43 pointed out that my NEW MEXICO graph is missing McKinley County, because it cuts off at 75%...but McKinley has vaxxed *81%* of their total population!
Here's the corrected version (also updated for Tuesday):
Here's the corrected version (also updated for Tuesday):

McKinley County, NM isn't a ghost town either--it has over 71,000 residents, which is small but not *that* small.
I believe McKinley County, NM has taken the crown for most-vaxxed county in the U.S. from Aleutians East Borough, AK.
I believe McKinley County, NM has taken the crown for most-vaxxed county in the U.S. from Aleutians East Borough, AK.
If you don't believe me, here's the raw data from the @CDCgov website: 81.1% of the entire population, 99.3% of those 12 and older.
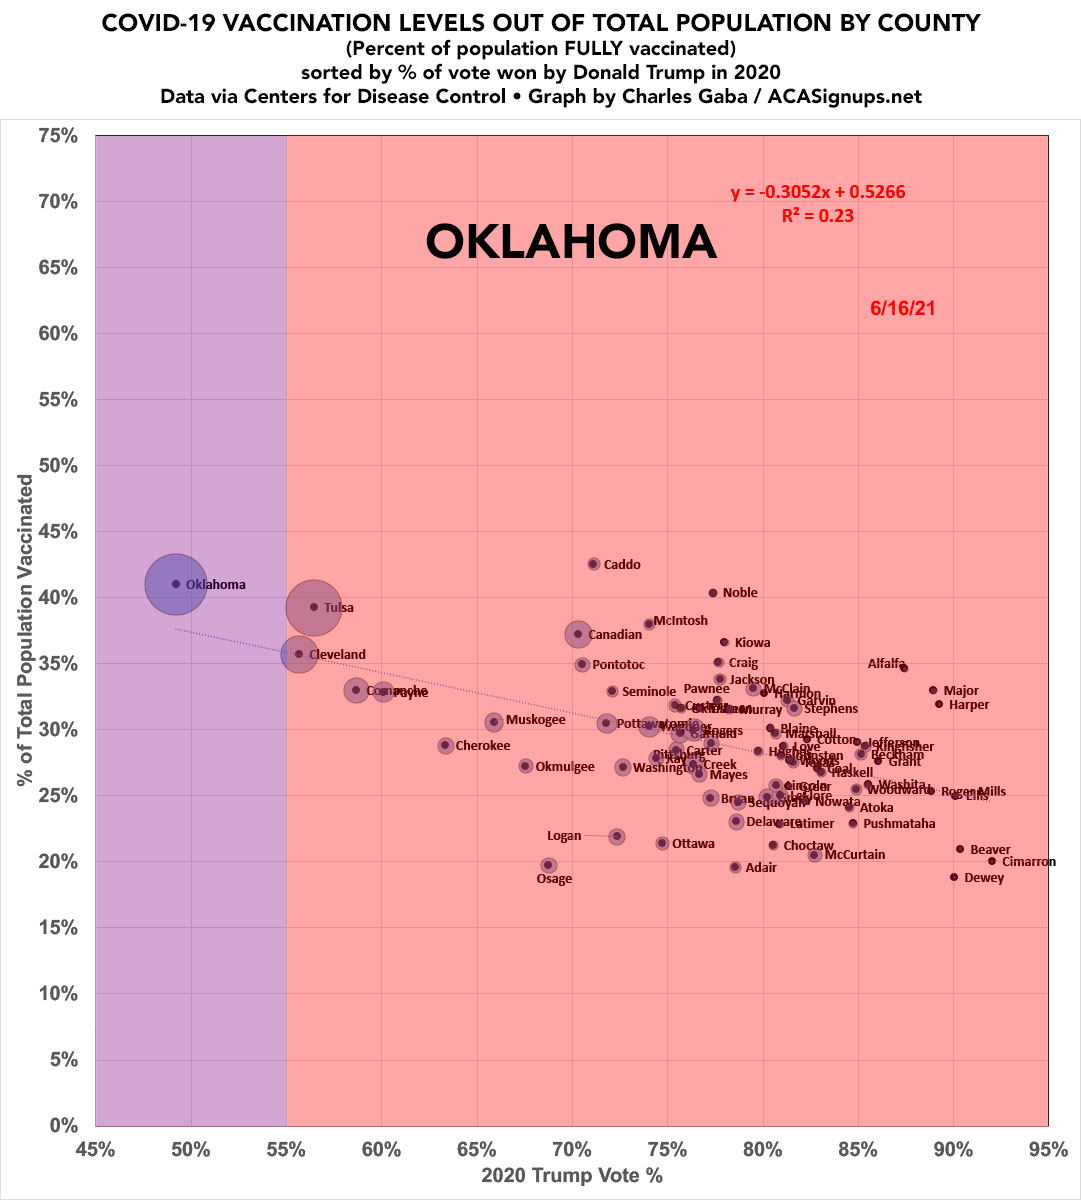
OOOOOOKLAHOMA...where not a single county has vaccinated more than 43% of their total population...
PENNSYLVANIA. Philly really needs to get their sh*t together.

SOUTH CAROLINA.

SOUTH DAKOTA. Someone told me that counties w/large Native American populations are being undercounted since a lot of doses are being administered by the IHS/etc, but those are *supposed* to be included, and I just noted that McKinley County, NM is through the roof. Huh.

WISCONSIN.

WEST VIRGINIA. Remember a few months ago when they were leading the way in vaccinating seniors? It looks like they kind of...stopped after that.

GEORGIA (reposted due to a data error the first time I posted it). Also updated by a couple of days.

📣 FINAL STATE: VIRGINIA...which is kind of all over the place, though some of that may be due to half of the "counties" being individual *cities* which are considered "county equivalents":

⚠️ ONE FINAL CORRECTION: VERMONT. The official @CDCgov website cautions that their Vermont data only includes 74% of county of residence; I've re-run the graph via @CovidActNow data which seems more comprehensive for VT:
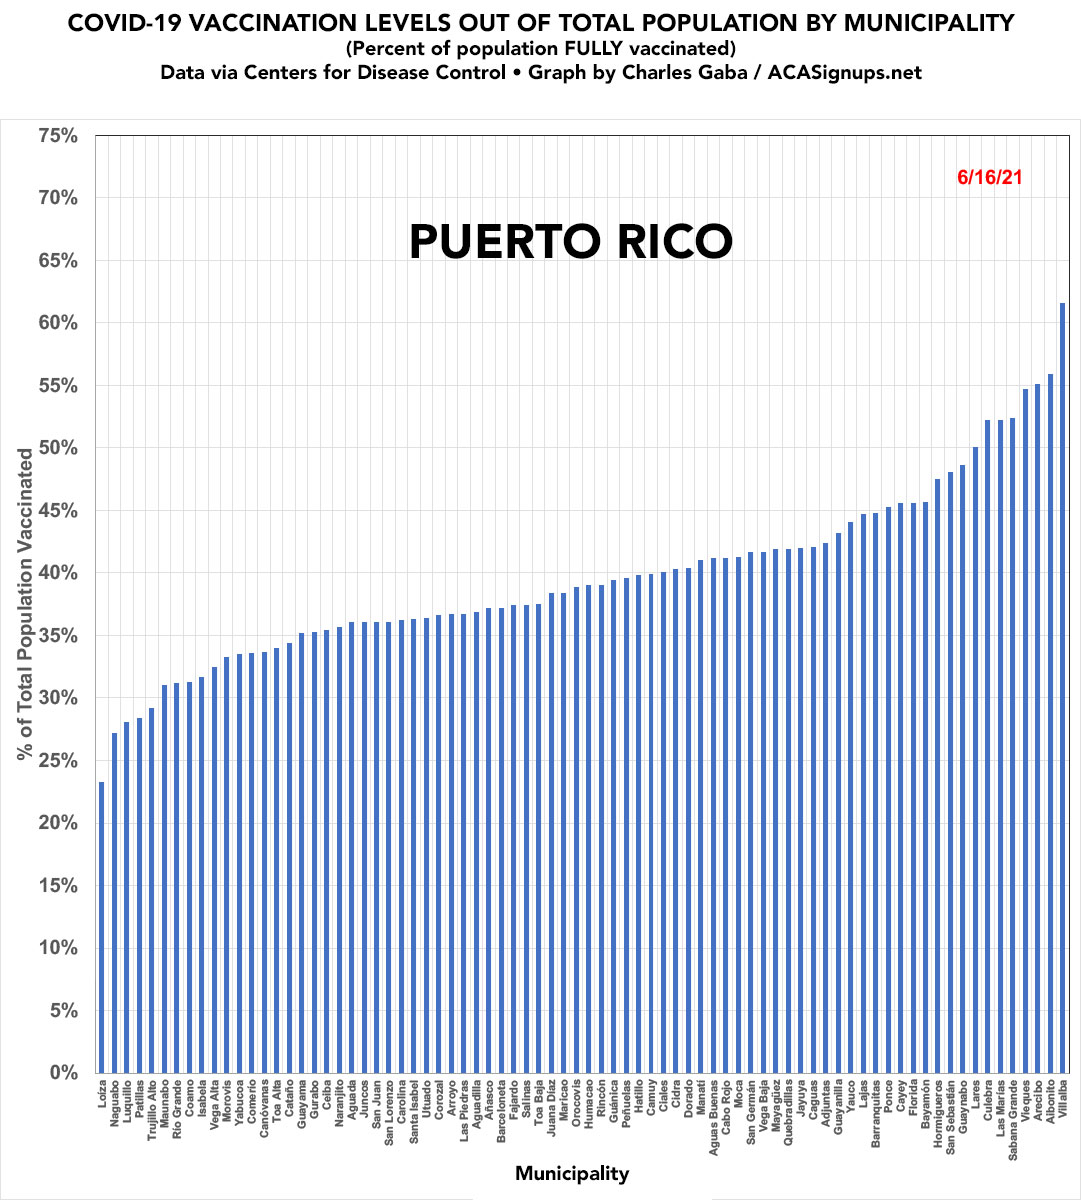
PUERTO RICO: Since PR doesn't vote for U.S. President and I don't know enough about the internal political leanings to speculate, I'm just listing their municipalities from lowest to highest. PR natives/experts may draw some insight from this...
📣🎉🔥 FINAL GRAPH: ALL 3,143 U.S. counties from all 50 states +DC, as of 6/14 - 6/15!
R^2: 0.3888
cc: @DrEricDing @PeterHotez @DataDrivenMD @digiphile @smotus
R^2: 0.3888
cc: @DrEricDing @PeterHotez @DataDrivenMD @digiphile @smotus

📣 6/16/21 STATE-LEVEL VAXX UPDATE:
R^2: 0.6922
R^2: 0.6922

--Illinois on the verge of breaking 50%
(of TOTAL population)
--Arizona breaks 45%
--Alabama reaches 1/3 of their total population
(of TOTAL population)
--Arizona breaks 45%
--Alabama reaches 1/3 of their total population

📣 STATE-LEVEL VAXX UPDATE:
R^2 = 0.6968
R^2 = 0.6968

--New Mexico breaks 55% of *total* population
--Guam close to 55%
--Illinois breaks 50%
--Michigan bypasses Nebraska
--Alaska on verge of breaking 45%
--Alabama breaks 1/3 of total population
--Guam close to 55%
--Illinois breaks 50%
--Michigan bypasses Nebraska
--Alaska on verge of breaking 45%
--Alabama breaks 1/3 of total population

📣 DAILY STATE-LEVEL VAXX UPDATE:

--Florida should break 50% within a few days
--Alaska breaks 45%
--Alaska breaks 45%

📣 DAILY STATE-LEVEL VAXX UPDATE:
R^2 breaks 0.7 for the first time, I think.
R^2 breaks 0.7 for the first time, I think.

--New Jersey about to break 55% of their *entire* population
--Florida should break 50% tomorrow or Monday
--Alaska & Nevada break 45%
--Kentucky should break 45% tomorrow
--West Virginia nears 40%
--Florida should break 50% tomorrow or Monday
--Alaska & Nevada break 45%
--Kentucky should break 45% tomorrow
--West Virginia nears 40%

📣 DAILY VAXX UPDATE:

--NJ breaks 55% of *entire* population vaxxed
--FL on verge of 50%
--NV & KY break 45%
--FL on verge of 50%
--NV & KY break 45%

• • •
Missing some Tweet in this thread? You can try to
force a refresh


