The Honest Broker Profile picture
Jun 14, 2021 11 tweets 4 min read Read on X
I was curious
So I graphed percent of CONUS in drought according to the US drought monitor, data is weekly from 1/2000
droughtmonitor.unl.edu/CurrentMap.aspx
Here from US EPA is the same data by drought category
epa.gov/climate-indica…
And here from EPA is a longer time series, 1895-2020 for CONUS
Note: On this graph up means wetter, down means dryer
epa.gov/climate-indica…
And here is the percent in drought (D0-D4) of the Colorado River Basin over Jan 2000 to present
droughtmonitor.unl.edu/CurrentMap.aspx
And here is Colorado River Basin drought 1901-2015
via McCabe et al 2020
journals.ametsoc.org/view/journals/…
And for a much longer perspective, here is Colorado River Basin drought over the past 1800 years
Also from McCabe et al 2020
TL;DR
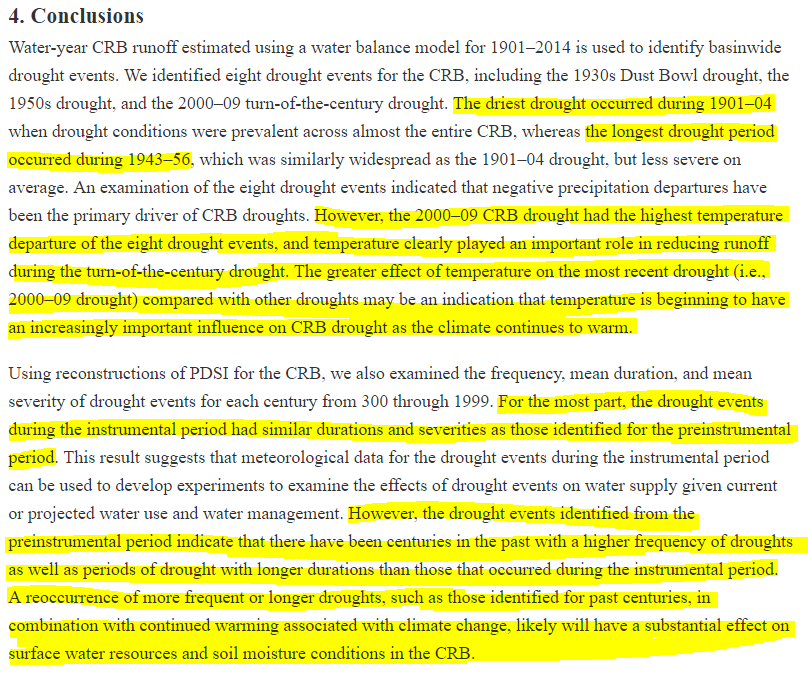
Here are the conclusions of McCabe et al 2020
Well worth reading carefully
And here is what the US National Climate Assessment concluded on drought in 2018
nca2018.globalchange.gov/chapter/2/
PS
A side note
For accurately citing peer reviewed literature & US NCA on drought trends in 2013 Congressional testimony, I earned the distinction of being the only US researcher in history to be attacked by the president's science advisor (Holdren) in a White House blog post 😎
PPS
Holdren is still wrong
The IPCC, USNCA & peer reviewed literature that they rely on is still correct

Climate change is real, and aggressive mitigation & adaptation policies make good sense

The reality of climate change doesn't mean scientific integrity can be ignored

/END
Oh, I guess I should point out Holdren's false claims about me posted on White House website were basis for a subsequent Congressional investigation of me that turned my life upside down & almost ended my career
But I'm still here
And that kids is how I came to understand tenure

• • •

Missing some Tweet in this thread? You can try to force a refresh
 

Keep Current with The Honest Broker

The Honest Broker Profile picture

Stay in touch and get notified when new unrolls are available from this author!

Read all threads

This Thread may be Removed Anytime!

PDF

Twitter may remove this content at anytime! Save it as PDF for later use!

Try unrolling a thread yourself!

how to unroll video
  1. Follow @ThreadReaderApp to mention us!

  2. From a Twitter thread mention us with a keyword "unroll"
@threadreaderapp unroll

Practice here first or read more on our help page!

More from @RogerPielkeJr

Aug 7
🧵The US National Climate Assessment has been a politiczed mess from the start due to its institutional design, which places it in the White House

The NCA proved too tempting for both Ds and Rs to put a thumb on the scale

Links at end of thread . . .
The idea it was perfect under Democrats, as @afreedma & other advocacy journos suggest, is simply wrong

The most recent NCA was totally capture by interest groups and companies that would benefit from the report - UCS, TNC, EDF, CAP, Stripe etc

Below just a few of its authors Image
@afreedma The head of the NCA5 stated publicly that she would never cite our work in the assessment, even though our work is by far the most cited research on economic losses in the US associated with floods, hurricanes, tornadoes

Here is how the NCA handled a reviewer comment Image
Read 7 tweets
Jul 31
🧵Let's take a quick look at the implications of the regulations that have followed from the 2009 EPA endangerment finding

According to @C2ES_org the 2021 GHG standards for light vehicles would reduce projected CO2 emissions by a cumulative 3.1 billion tons to 2050
c2es.org/content/regula…Image
Over the next 25 years the world would emit 925 gigatons of CO2 assuming constant 2025 emissions and ~690Gt assuming emissions are cut in half by 2050

That means that the projected impact of the regulations would reduce global emissions by 0.0003% (constant) & 0.0004% (halved)
The idea that CO2 can be regulated out of the economy is flawed

If the purpose of CO2 regulation is to create a shadow carbon tax, then it is a horribly inefficent way to do that

Once again, all this leads us back to Congress and the need for smart energy & climate policy
Read 4 tweets
Jan 11
🧵
The percentage of a percentage trick is increasingly common & leads to massive confusion

Here a undetectable difference of 0.01 events per year per decade is presented as the difference between a 31% and 66.4% increase (in the *likelihood* of the event, not the event itself) Image
The resulting confusion is perfectly predictable

Here is a reporter (NPR) explaining completely incorrectly:
"The phenomenon has grown up to 66% since the mid-20th century"

False Image
Also, the numbers in the text and figure do not appear to match up
I asked Swain about this over at BlooSkeye Image
Read 4 tweets
Dec 22, 2024
The new hurricane damage time series trick

Step 1: create Frankenstein dataset w/ an increasing trend where there was not an increasing trend before

Step 2: Attribute the increasing trend to climate change

Step 3: Use Frankenstein dataset to impeach other research w/ no trend Image
The reason that the blue and red numbers are different is that they are different measures of hurricane losses

E.g., the red numbers include inland NFIP damage
The blue numbers do not, on purpose, because NFIP only started in 1968

They are apples and oranges
Now 3 peer-reviewed papers (PNAS, JAMC, BAMS) make this most basic of errors by replacing and splicing NOAA BDD to the MWR/NHC time series

Predictably all three papers find an increasing trend in normalized hurricane damage even though landfalling hurricanes are not increasing Image
Read 6 tweets
Dec 21, 2024
A Frankenstein dataset results from splicing together two time series found online

Below is an example for US hurricane damage 1900-2017
Data for 1980-2017 was replaced with a different time series in the green box
Upwards trend results (red ---)

Claim: Due to climate change! Image
The errors here are so obvious and consequential that it is baffling that the community does not quickly correct course

Read about it here
Is my analysis flawed?
osf.io/preprints/osf/…
The IPCC AR6 cited a paper misusing the Frankenstein hurricane loss dataset to suggest that NOAA's gold standard hurricane "best track" dataset may be flawed

JFC - Using flawed economic loss data to suggest that direct measurements of hurricanes are in error! Image
Read 6 tweets
Nov 2, 2024
We’ve reached the point where an IPCC author is openly rejecting the conclusions of the IPCC out of concern over how their political opposition is correctly interpreting the AR6

The integrity of the IPCC on extreme events is now under attack
The IPCC explains that a trend in a particular variable is DETECTED if it is outside internal variability and judged with >90% likelihood

For most (not all) metrics of extreme weather detection has not been achieved

That’s not me saying that, but IPCC AR6 Image
The IPCC also assesses that for most (but not all) metrics of extreme weather the signal of a change in climate will not emerge from internal variability with high confidence (ie, >90%) by 2050 or 2100, even assuming the most extreme changes under RCP8.5 Image
Read 6 tweets

Did Thread Reader help you today?

Support us! We are indie developers!


This site is made by just two indie developers on a laptop doing marketing, support and development! Read more about the story.

Become a Premium Member ($3/month or $30/year) and get exclusive features!

Become Premium

Don't want to be a Premium member but still want to support us?

Make a small donation by buying us coffee ($5) or help with server cost ($10)

Donate via Paypal

Or Donate anonymously using crypto!

Ethereum

0xfe58350B80634f60Fa6Dc149a72b4DFbc17D341E copy

Bitcoin

3ATGMxNzCUFzxpMCHL5sWSt4DVtS8UqXpi copy

Thank you for your support!

Follow Us!

:(